Trends in waste generation and management in Europe. Özgür Saki European Environment Agency
|
|
|
- Cody Stokes
- 5 years ago
- Views:
Transcription

1 Trends in waste generation and management in Europe Özgür Saki European Environment Agency

2 The European Environment Agency An EU institution situated in Copenhagen since 1994 Provides the information necessary to enable policy makers to provide efficient and scientific legislation 32 member countries: EU-27, Turkey, Iceland, Norway, Liechtenstein and Switzerland 7 cooperating countries in the Western Balkan
3 Main EEA Activities on Waste - Analysis and assessments on waste State and outlook of the environment report EEA publications on waste in 2011 Indicators on waste Other analysis on waste (waste prevention, transboundary shipments...etc.) - Waste policy support Country fact sheets on waste policies Policy analysis reports Eionet workshops

4 What is SOER 2010? Thematic assessments Understanding climate change Mitigating climate change Adapting to climate change Biodiversity Land use Soil Marine and coastal environment Consumption and environment Material resources and waste Water resources: quantity & flows Freshwater quality Air pollution Urban environment Assessment of global megatrends Social megatrends Technological megatrends Economic megatrends Environmental megatrends Political megatrends Country assessments Country profiles National and regional stories Common environmental themes Climate change mitigation Land use Nature protection & biodiversity Waste Freshwater Air pollution Each EEA member country (32) and EEA cooperating country (6) assessed all six environmental themes above.
 and EEA cooperating country (6) assessed all six environmental themes above.")
5 SOER 2010: Country Assessments Country assessments Country profiles National and regional stories Common environmental themes Climate change mitigation Land use Nature protection & biodiversity Waste Freshwater Air pollution * Kosovo under UNSCR 1244/99 Each EEA member country (32) and EEA cooperating country (6) assessed all six environmental themes above.
6 SOER 2010 country assessments Waste part All 38 countries contributed to the waste assessments 86,847 words, 296 figures and tables DPSIR and outlook Content analysis (Overall assessments, Deviance between National data and Eurostat, etc) Available (
7 Policy question: Are we reducing the generation of waste? Total waste generation in the EU-27, Turkey, Norway, Iceland, Croatia: 2,7 billion tonnes (2008) Total municipal waste generation in the EU 27: 252 million tonnes (2010) 502 kg/cap municipal waste generation(2010), large differences between countries Total hazardous waste generation: 98 million tonnes (2008)
8 Sweden United Kingdom Finland Slovakia Romania Slovenia Portugal Poland Total Waste Generation in Europe Belgium Bulgaria Czech Republic Denmark Germany Estonia Ireland Greece Spain France Italy Cyprus Latvia Lithuania Luxembourg Hungary Malta Netherlands Turkey Norway Austria Source: Eurostat

9 Generation of Municipal Waste in Europe kg/capita
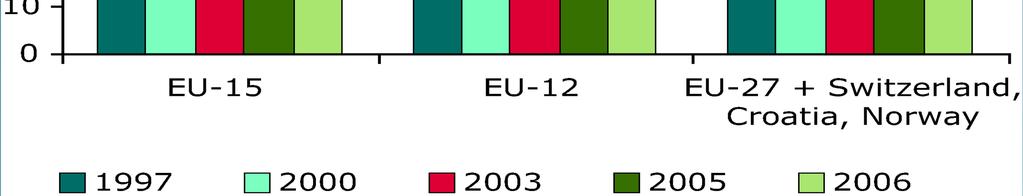
10 Municipal Waste Generation in Europe kg/capita (CSI 016) EU-15 + EFTA 500 EU EU Total EU-27 + EFTA + Turkey + West Balkan countries (where available) Turkey West Balkan countries (no data for all countries and years available) 0
11 Trend in Generation of Municipal Waste in Europe Index Municipal w aste generation EU-27 Index GDP EU27 Population EU27 index

12 Hazardous Waste Generation in the EU

13 Packaging waste generation per capita by country (CSI 017)
14 Trend in Generation of Packaging Waste in Europe (CSI 017)
15 Thematic Strategy on Waste,2005 The long-term goal is for the EU to become a recycling society, that seeks to avoid waste and uses waste as a resource. (Thematic Strategy on prevention and recycling of waste, 2005)
16 Recycling Targets Year Recovery targets Recycling targets Collection targets Packaging waste % 55% % incl. Reuse 80% incl. reuse 100% End-of-Life Vehicles % incl. Reuse 85% incl. reuse 100% Waste Electrical and Electronic Equipment % (differs acc. to WEEE categories) % incl. reuse (differs acc. to WEEE categories) Min. 4 kg per inhabitant per year % Batteries % Batteries, lead acid and accumulators % efficiency (different targets for different battery types) Tyres 2006 Zero landfill of tyres Landfill of biodegradable municipal waste 2006 Reduction to 75% of the amount generated in Reduction to 50% of the amount generated in Reduction to 35% of the amount generated in 1995
17 Recycling Targets, WFD 2015 Separate collection: At least for paper, plastic, metal and glass New Targets 2020 recycling rates of 50% for household and similar wastes (at least paper, plastic, metal and glass) % for construction and demolition waste
18 Policy question: How far the EU reached to be a recycling society? The management of waste has improved, with many countries recycling and recovering more, but more efforts are needed if the EU is to become a 'recycling society'. The majority of this waste (45 %) is still sent to landfill, but an increasing amount is recycled (42 %) or incinerated (5 %). Municipal waste landfilled 62 % (1995) > 38 % (2010)


19 Trend and Outlook of Municipal Waste Management in Europe
20 Landfilling of Municipal Waste by countries Switzerland Germany Netherlands Sweden Austria Denmark Belgium Norway Luxembourg France EU-27 countries Estonia Italy Finland United Kingdom Spain Ireland Portugal Iceland Czech Republic Poland Hungary Slovenia Romania Slovakia Greece Turkey Cyprus Lithuania Malta Latvia Bulgaria %

21 Average recycling rate of packaging waste in the EU is 61% (CSI 017)

22 Packaging waste management, EU-15 (CSI 017)
23 WEEE Management, 2008 (New indicator) Kg per capita in private households collection target: 4 kg per capita per year AT BE BG CY CZ DK EE FI FR DE GR HU IE IT LV LI LT LU NL NO PL PT RO SK ES SE UK Put on the market Total collected Reuse and recycling Collected from private households
24 Landfill of BMW, 2006 (New indicator)
25 Transboundary shipments of waste kg/capita, 2009 (New indicator) Import and export of notified waste in the EU, Import 2009 Export Austria Belgium Bulgaria Cyprus Czech Republic Denmark Estonia Finland France Germany Greece Hungary Ireland Italy Latvia Lithuania Luxembourg Malta Netherlands Poland Portugal Romania Slovakia Slovenia Spain Sweden UK in kg/cap
26 Total turnover of seven key recyclables The turnover of seven recyclables has almost doubled from EUR 32,5 billion in 2004 to EUR 60,3 billion in Due to the economic downturn the turnover of recycling declined sharply at the end of 2008 and in the first half of 2009 but seems to have recovered markedly since then Billion euros Other metals Precious metals Iron and Steel Cu, Al and Ni Plastic Paper and Cardboard Glass *
27 Coverage of the consumtion by recycling Even though recycling has increased over the last decade, only a small fraction of our total material consumption is based on recycled material. Depending on the material, current recycling covers only from 2 % to 42 % of the EU s consumption. How much can recycling contribute to consumption? 70% 60% 50% 40% 30% 20% 10% Current contribution Potential contribution 0% Iron & Steel Paper & Cardboard Other Metals Glass Aluminium Copper Concrete WEEE Plastics Waste material
28 Demand and supply for the critical metals Europe lacks geological stocks of these critical metals or has very limited reserves and therefore depends almost entirely on imports. Emerging technologies' demand for rare metals. Index compared to current production (100) Index Gallium Indium Germanium Neodymium Platinum Tantalum Cobalt Palladium Ruthenium Metal


29 Thank you for your attention Özgür SAKI Project Manager Waste prevention and management