Network Capability & Operations - Gas
|
|
|
- Leslie Robertson
- 5 years ago
- Views:
Transcription

1 Network Capability & Operations - Gas Place your chosen image here. The four corners must just cover the arrow tips. For covers, the three pictures should be the same size and in a straight line. Andy Malins March 2017
2 Who we are and what we do.. Head of Network Capability & Operations, Gas Andy Malins Secretary Lucy Edginton Gas Network Control Manager Glenn Bryn- Jacobsen NTS Optimisation Manager Jonathan Davies Commercial Operations Manager Steve Fisher Gas Network Development Manager Craig Dyke Business Delivery Manager Stuart Hegarty Control Room GNCC Support System Support Operational Performance Emergency Planning Access Planning Network Control Operational Liaison Shrinkage & Emissions Energy Balancing Gas Incentives Development NTS Capacity Sales Contract Services Customer Connections Gas Network Strategy Gas Network Capability Operational Capability Development Business Planning & Resource Management
3 Gas National Transmission System (NTS) St. Fergus Key Assets >7600km pipeline Operating pressure 38-94bar 24 compressor stations Gas National Control Centre (GNCC) 530+ Above Ground installations Barrow Burton Point Milford Haven Teesside Easington Theddlethorpe Bacton Isle of Grain Entry Points 7 Beach Reception Terminals 2 LNG Importation Terminals 3 Interconnectors 9 storage sites Exit Points Distribution Offtakes (121) Power Stations (48) Large Industrial (21) Storage (10) Interconnectors (3) 3


4 Gas Distribution Distribution 4 Distribution Network Operators Operating Pressures 38bar to 22mbar Passive Networks DNs transports gas to domestic users, commercial properties and medium sized businesses Most gas through the DNs is for homes and small businesses A smaller proportion is for larger sites such as Power Stations and Large Industrial and Commercial Users


5 Who are the Gas Industry Players? Producers Shippers Delivery Facility Operators Storage Operators Public Gas Transporters End Consumers Suppliers 5
 Shippers Uniform Network Code Interconnectors Interconnector Agreements NTS Directly Connected Sites (PS, IND) Network Exit Agreement (NEXA) Gas Distribution")
6 Complex Governance Frameworks BEIS OFGEM Gas Transporters Licence Gas Act & GS(M)R Health & Safety Exec Uniform Network Code NTS Storage Operators Storage Connection Agreement (SCA) Delivery Facility Operators Network Entry Agreement (NEA) Shippers Uniform Network Code Interconnectors Interconnector Agreements NTS Directly Connected Sites (PS, IND) Network Exit Agreement (NEXA) Gas Distribution Networks (GDNs) Offtake Arrangements Document (OAD) 6
7 Responsibilities System Operator Safe, efficient and economic real-time operation of the National Transmission System in Great Britain Maintain pressures across the network Ensure security of supply and network balance Below safe maximum operating limits Above contractual limits at Exit Points Ensure gas quality meets specifications Meets safety criteria Legal requirement Suitable for GB appliances facilitate maintenance, provide data to the market, run capacity auctions, complete after the day reconciliation, undertake residual balancing, maintain the commercial trading systems, act as the Network Emergency Coordinator
8 Physical Characteristics of flow Supplies and demands profile over a Gas Day: 5am-5am Daily balancing regime total supplies and demands must balance at the end of the day No direct System Operator balancing mechanism (as opposed to electricity) Supply System stock (Linepack) Demand Gas Day 8
9 NTS Pressure Management High Pressure Maximum Pressure breach / Upstream Failure Maximum Operating Pressure (MOP) reached Limited ability for system to react Optimised Operation Network Flexibility Low Pressure Limited ability for system to react Contractual Minimum Offtake Pressure reached Minimum Pressure breach / Downstream Failure 05:00 05:00 As System Operator, National Grid aims to operate the system in the tight green band at every site on the NTS Supply / demand changes and asset issues change the operating environment resulting in linepack and pressure swings within the system In addition to normal operating strategies, National Grid has a range of rules and tools available to manage high and low pressure scenarios

10 Commercial Regime Energy and Capacity Gas Supply National Grid s Role Residual Balancer Ensure NTS balance is within safe operating limits NG balancing trade actions at times of forecast imbalance NG trades to move the System Marginal Buy/Sell prices to increase incentive on shippers to balance themselves Shippers Obliged to provide commercial input and output nominations to National Grid before the day (forecasts) Incentivised to ensure nominations / re-nominations are accurate Incentivised rather than obliged to physically balance portfolio Gas demand 10
11 Shipper Imbalance Cash-out (After the day) Shippers incentivised to balance through the Imbalance Cash-out process: Over-delivery Shipper sells the excess gas at SMP(S) Balanced Shipper penalised for over-delivery as the SMP(S) is a lower price. Shipper buys the deficit gas at SMP(B) Under-delivery Shipper penalised for under-delivery as the SMP(B) is a higher price. As Residual Balancer, National Grid sets SMP(B) & SMP(S) each time a title trade is taken thus increasing the Shipper incentive to balance 11
12 Electricity Energy How Much Energy Does the NTS Transport When compared to the Electricity transmission system, How much energy does the NTS transport in a year? A: Half B: The Same C: Twice As Much D: Three Times As Much
13 Electricity Energy How Much Energy Does the NTS Transport A: Half B: The Same C: Twice As Much D: Three Times As Much

14 Actual Supply Winter 16/17: TYPE 15/16 16/17 LNG IUK NORWAY
15 Gas Stats

 0.")

16 Gas Consumers typical relative scale Domestic mcm/day (= ~1.5 therms or 44kwh) mcm/day Industrial Equivalent to 125, ,000 houses Power Station (1GW) 4.5 mcm/day Equivalent to 1,125,000 houses
17 Demand Mix 450mcm Demand Day 180mcm Demand Day Storage Injection 4.8 Storage Injection 9.8 Moffat Export 26.2 Moffat Export 16.2 IUK Export 0.0 IUK Export 40.1 Power Station Total 84.8 Power Station Total 48.2 LDZ Total LDZ Total 55.7 Industrials Total 11.5 Industrials Total

18 Actual Demand Winter 16/17 - TYPE 15/16 16/17 LNG Moffat Powerstation


19 Our Changing World.. Place your chosen image here. The four corners must just cover the arrow tips. For covers, the three pictures should be the same size and in a straight line.

20 How The Network Has Evolved Over Time
21 Future of Gas FES (Future Energy Scenarios) 2016, imported gas ~55% of our needs. 2/3 domestic energy demand and remains a vital fuel source to generate electricity Since 2000, production from the UK Continental Shelf (UKCS) has fallen from 95 billion cubic metres (bcm) to 35bcm. Replaced by Norway supplies and continental Europe, as well as imports from the world market liquefied natural gas (LNG). Enough gas available worldwide to meet GB demand through to 2050 and beyond 21
22 Two Degrees Greenest Scenario with lowest gas Gas supply falls to 2050, from ~80bcm to ~45 bcm. (> current UKCS) Gas still supplies more energy than electricity in 2050! Today, 80% of us use gas to heat our homes ~22 million gas boilers. Heat pumps replace gas ~23 million heat pumps could be in operation Greater renewable power generation. Little support UKCS supplies from the UKCS run out by 2048 no support for shale gas in this scenario. 6bcm of green gas supplies by 2050 in (biomethane and biosng) Gas imports mainland Europe and Norway, although Norwegian gas supplies fall from 30bcm > 12bcm a year by 2050, Britain is 87% dependent on imported gas by
23 Consumer Power Highest gas demand case Both UKCS supply and shale development are at their highest. Gas demand in 2050 is only 20% lower than in Lowest reliance on imports, with ~50% gas coming from GB sources. The UKCS is still producing gas with 32bcm of shale gas comes on stream from In this scenario, there is limited green ambition (limited biomethane). It s easy to forget the importance of gas in Great Britain today and in the future. It is part of our daily lives and will continue to be so for decades to come. As new energy sources connect to the network, the role of gas may well change, but for the foreseeable future at least, gas is here to stay. 23

24 Thank you for listening & do come and speak to us 24
25 General Interest Slides Both UKCS supply and shale development are at their highest. Offshore pipeline laying - Whilst National Grid has not laid any offshore pipelines recently it did consider offshore options as alternatives to the new Humber Estuary Crossing currently underway (a future talk perhaps). Impact of pressure on gas velocity Slides are animated so some is lost however they were to show that when we talk of linepack and pipeline flows we refer to volumes as they would be at atmospheric pressure ~1barg. It explains why operating pipelines at higher pressures is more efficient as velocity and hence losses due to friction are reduced. The last slides show a gas compressor train and explains how large Variable Speed Electric Drives are more efficient and have better environmental performance than Gas Turbines even when taking into consideration electricity generation. Decision between GT and VSD is based on whole life costs, evnironmental performance and need to have for GTs as back up for Electric Drives. 25

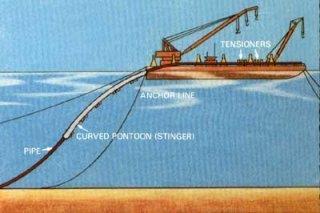
26 J Lay Lay Barge S Lay 26
27 Flow Imagine if pipes where made of glass and were square (and standard pressure = 1barg)! 1 barg 15 o C 1m 1m If the flow was 72 mscmd you would see 72 million one metre cubes of gas flowing past in a day If the gas was now compressed to 9 barg it would take up 1/9 th of the volume In other words 1m3 of gas at standard conditions would take up 1/9 th of a cubic metre If the flow remained at 72 mscmd you would now only see 8 million one metre cubes of gas (containing 9 standard metre cubes) flowing past each day 27
28 Velocity i.e. the velocity of the gas would be 9 times less In reality pipeline transporting this volume would be operating at 80 barg+ (velocity some 80 times less You wouldn t want to stand next to a pipe with a cross sectional area of 1x1m which was flowing 72mcmd volumetric flow. The velocity would be over 830 m/s! A concord = 603 m/s The muzzle velocity of an M16 rifle = 975m/s 28


29 Gas Turbine Driven Compression Train Gas Turbine Power Turbine Centrifugal Gas Compressor ~30% efficient in converting energy contained in fuel gas into rotating kinetic energy 25-35% efficient depending on the age of technology and operating conditions Compressor impeller is ~80% efficient in converting rotating kinetic energy into pressure Overall efficiency 0.3 x 0.8 = 24% 29


30 CCGT Electric Drive Compression Train System ~50% efficient in converting energy contained in fuel gas into electricity Electric Motor Centrifugal Gas Compressor ~6% Losses if connected to medium voltage NB Combined Cycle Gas Turbines are more efficient than Gas Turbines at compressor stations as they utilise the exhaust heat for secondary steam generation. ~98% efficient in converting electricity into rotating kinetic energy Compressor impeller is ~80% efficient in converting rotating kinetic energy into pressure Overall efficiency 0.5 x 0.94 x 0.98 x 0.8 = 37% 30