DOE Quadrennial Technology Review
|
|
|
- Opal Hardy
- 5 years ago
- Views:
Transcription

1 DOE Quadrennial Technology Review Steven E. Koonin Under Secretary for Science US Department of Energy May


2 Estimated U.S. Energy Use in 2009: ~94.6 Quads 2
3 Energy Essentials As a whole, energy is A big and expensive system In private hands Governed by economics, modulated by government policies Demand Many distributed players, shorter-lived assets User benefit (economics, convenience, personal preference) Determined by price, standards, behavior Little attention to system optimization for stationary use Supply Fewer, long-lived centralized facilities with distribution networks Change has required decades Power and fuels are commodities with thin margins Markets with government regulation and distortion Technology alone does not a transformation make Transport and Stationary are disjoint Transport is powered by oil Power Requires boiling large amounts of water Sized for extremes (storage is difficult) Numerous sources with differing CapEx and OpEx Emissions Base/Peak/Intermittency 3
4 Energy supply has changed on decadal scales 100% 90% US energy supply since % 70% 60% 50% 40% 30% 20% 10% 0% Renewables Nuclear Gas Oil Hydro Coal Wood Source: EIA 4


5 U.S. Energy Challenges Energy Security Competitiveness Environment Daily Spot Price OK WTI Global Lithium-ion Battery Manufacturing (2009) Share of Reserves Held by NOC/IOC Federal Deficit 5
6 Administration Goals Transport Reduce oil imports by 1/3 by 2025 (~3.7 M bbl/day) Put 1 million electric vehicles on the road by 2015 Stationary By 2035, generate 80% of electricity from a diverse set of clean energy sources Make non-residential buildings 20% more energy efficient by 2020 Environmental Cut greenhouse gas emissions in the range of 17% below 2005 levels by 2020, and 83% by
7 Six Strategies Supply Demand Stationary Deploy Clean Electricity Modernize the Grid Increase Building and Industrial Efficiency Transport Deploy Alternative Fuels Progressively Electrify the Fleet Increase Vehicle Efficiency 7
8 DOE-QTR Scope The DOE-QTR will provide a context and robust framework for the Department s energy programs, as well as principles by which to establish multiyear programs plans and budgets. It will also offer high-level views of the technical status and potential of various energy technologies. The primary focus of the DOE-QTR process and document will be on the following: Framing the energy challenges A discussion of the roles of government, industry, national laboratories, and universities in energy system transformation Summary roadmaps for advancing key energy technologies, systems, and sectors Principles by which the Department can judge the priority of various technology efforts A discussion of support for demonstration projects The connections of energy technology innovation to energy policy 8
9 DOE-QTR Timeline Nov 2010 PCAST made recommendations for DOE to do QER 3/14 4/15 Public comment period for DOE-QTR Framing Document 4/20 First batch of public comments released on project website Through mid-june Hold workshops and discussions of each of the Six Strategies End July/Aug Submit DOE-QTR to White House for approval Before Dec 2011 Release DOE-QTR
10 DOE-QTR Logic Flow Energy context Supply/demand Energy essentials Energy challenges Oil security US Competitiveness Environmental Impact Six strategies Players and Roles Private/Gov t Within gov t Econ/Policy/Tech Acad/Lab/Private DOE portfolio principles DOE priorities and portfolio Balanced within and across strategies Technology Assessments History Status Potential Technology Roadmaps Milestones Cost Schedule Performers Program plans and budgets 10
11 THE TECHNOLOGY STRATEGIES 11
12 Six Strategies Supply Demand Stationary Deploy Clean Electricity Modernize the Grid Increase Building and Industrial Efficiency Transport Deploy Alternative Fuels Progressively Electrify the Fleet Increase Vehicle Efficiency 12
13 Trends in Car and Light-Duty Truck Average Attributes showing changes in customer preferences, data from (EPA2010) 13
14 Cumulative retail price equivalent and fuel consumption reduction relative to 2007 for spark ignition powertrain without hybridization (NRC2010) 14
15 Six Strategies Supply Demand Stationary Deploy Clean Electricity Modernize the Grid Increase Building and Industrial Efficiency Transport Deploy Alternative Fuels Progressively Electrify the Fleet Increase Vehicle Efficiency 15

16 Progressively Electrify the Fleet Internal Combustion Engine (ICE) Hybrid Electric Vehicle (HEV) Plug-in Electric Hybrid Vehicle (PHEV) Battery Electric Vehicle (BEV) Batteries Challenges with Batteries and Motors Adequate supply chain Charging Cost Performance Physical Characteristics Rare-earth elements in permanent magnet motors Lithium in batteries OEM & component manufacturing capacity Infrastructure Standardization of chargers and grid interface Charging times Consumer behavior 16


 systems 10 and 40 mile Plug-in HEV systems")
17 Battery Evolution: R&D to Commercialization The energy storage effort is engaged in a wide range of topics, from fundamental materials work through battery development and testing Advanced Materials Research High Energy & High Power Cell R&D Full System Development And Testing Commercialization High energy cathodes Alloy, Lithium anodes High voltage electrolytes Lithium air couples Lab and University Focus High rate electrodes High energy couples Fabrication of high E cells Ultracapacitor carbons Industry Focus Hybrid Electric Vehicle (HEV) systems 10 and 40 mile Plug-in HEV systems Advanced lead acid Ultracapacitors 17
18 Hybrid Electric Systems Petroleum Displacement via Fuel Substitution and Improved Efficiency Types of Vehicles and Benefits HEV PHEV EV Administration Goal:1 Million EVs by 2015 Toyota Prius 50 MPG Chevy Volt >100 MPGe Nissan Leaf All Electric PHEV Battery Cost per kw h $1,000 - $1,200 $700 - $950 Goal = $500 Goal = $300 System Cost Power Electronics Cost per kw $22 $19 Goal = $17 Targets and Status 2015 Goal = $ PHEV: Battery that has 40-mile all-electric range and costs $3, Power Electronics: Cost for electric traction system no greater than $12/kW peak by 2015 Status: $8,000-$11,000 for PHEV 40-mile range battery Status: Current cost of electric traction system is $40/kW 18
19 Six Strategies Supply Demand Stationary Deploy Clean Electricity Modernize the Grid Increase Building and Industrial Efficiency Transport Deploy Alternative Fuels Progressively Electrify the Fleet Increase Vehicle Efficiency 19

 Platform Fermentation Upgrading Filtration & Clean-up")

20 Deploy Advanced/Alternative Fuels Feedstocks Feedstock Production & Logistics Energy crops Agricultural byproducts Waste Streams Algae Coal Natural Gas Platforms / Pathways Cellulosic Sugar Platform Enzymatic Hydrolysis Pyrolysis Oil Platform Fast Pyrolysis Syngas Platform Gasification Algal and other Bio-Oils Sugars Liquid Bio-oil Raw syngas Lipid (Oil) Platform Fermentation Upgrading Filtration & Clean-up Transesterification Catalytic Upgrading Other enzymatic/biochemical methods Products Co or By Products R E F I N I N G Power Ethanol Methanol Butanol Olefins Aromatics Gasoline Diesel Jet Dimethyl Ether Heat and Power 20
21 Biomass can provide significant carbon Annual US Carbon (Mt C) Fuel Fossil Agriculture Biomass % of Transportation Fuels 0 Gasoline Diesel Coal Natural gas Other petroleum NGLs Corn Paper Soy Woodpulp Wheat Edible fats/oils Meat/Poultry Cotton Biomass today Biomass potential 21
22 Six Strategies Supply Demand Stationary Deploy Clean Electricity Modernize the Grid Increase Building and Industrial Efficiency Transport Deploy Alternative Fuels Progressively Electrify the Fleet Increase Vehicle Efficiency 22

23 Categories of US Energy Consumption Buildings use about 40% of total US energy 23
24 U.S. Refrigerator Properties 24
25 Six Strategies Supply Demand Stationary Deploy Clean Electricity Modernize the Grid Increase Building and Industrial Efficiency Transport Deploy Alternative Fuels Progressively Electrify the Fleet Increase Vehicle Efficiency 25
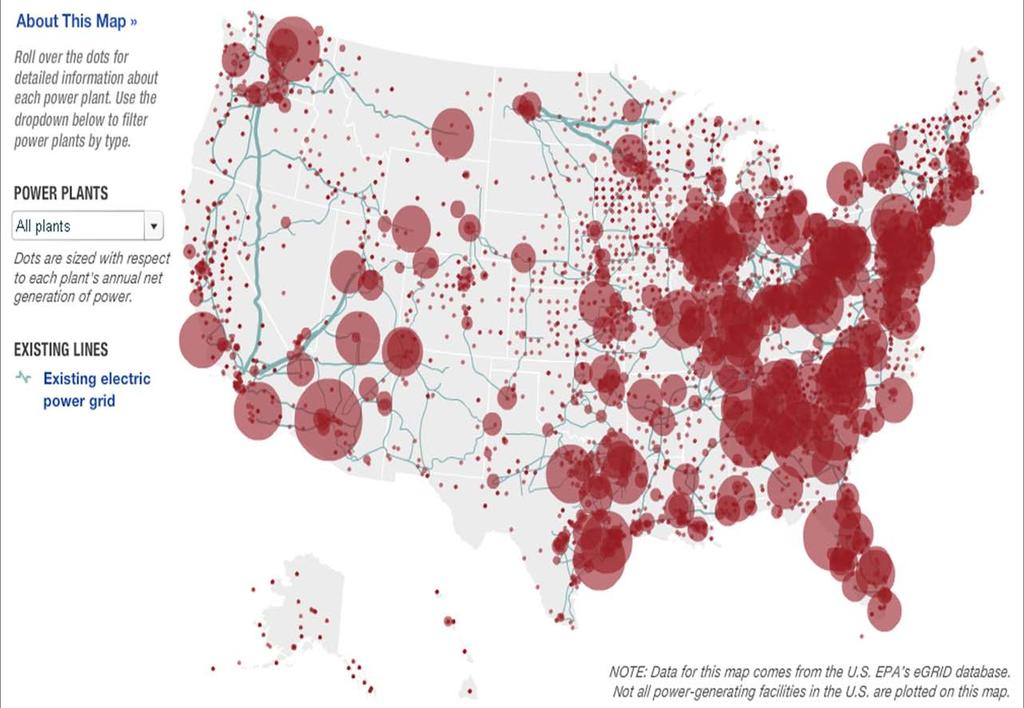
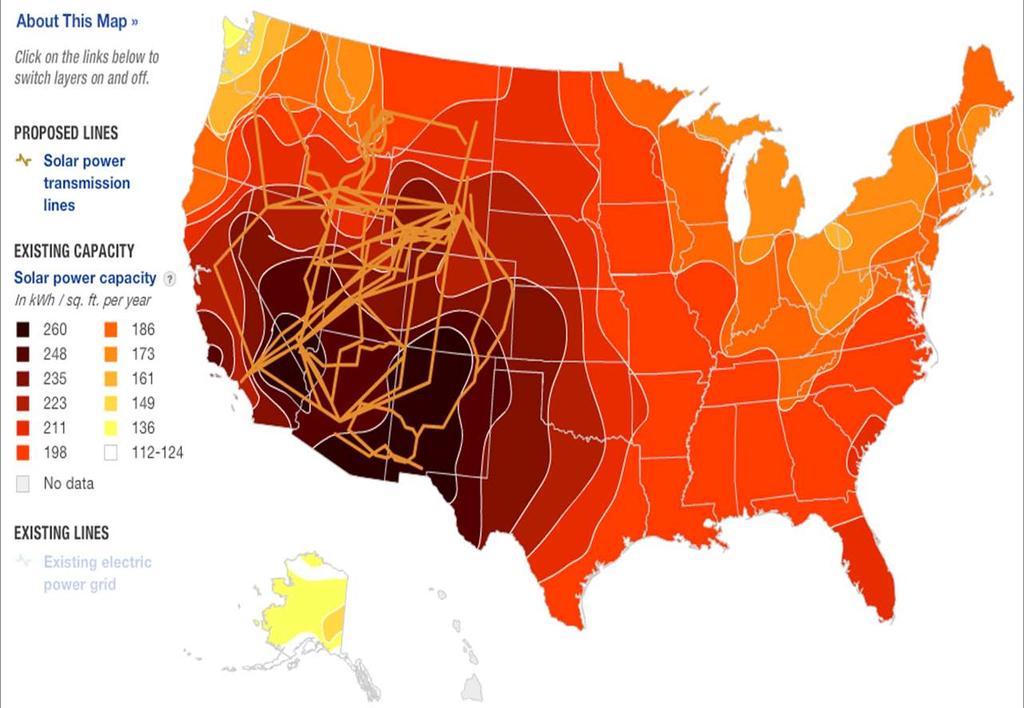
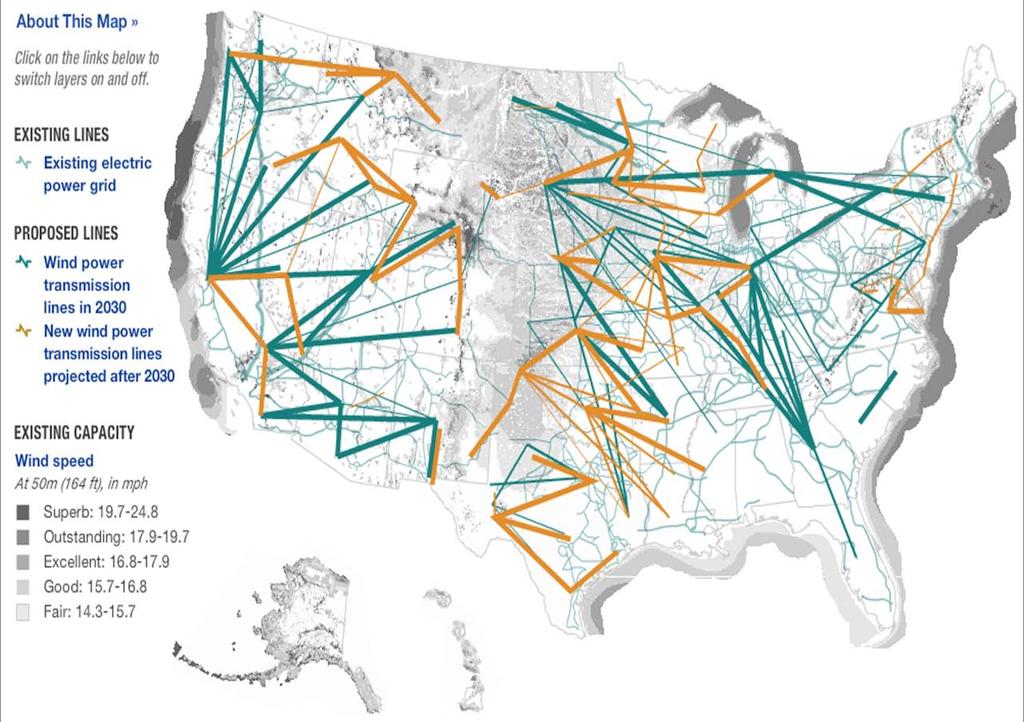
26 The U.S. Grid The numbers > 200,000 miles of transmission lines distribute approx. 1 TW of power Over 3,500 utility organizations Desiderata Reliability Efficiency Security Flexibility to integrate intermittent renewables Two-way flow of information and power Growth to handle growing demand Challenges Active management is required to balance generation, transmission, and demand at all times Excursion from ideal operation can be catastrophic 26
27 Source: 27
28 Source: 28
29 Source: 29
30 Source: 30
31 Source: 31
32 Source: 32
33 Six Strategies Supply Demand Stationary Deploy Clean Electricity Modernize the Grid Increase Building and Industrial Efficiency Transport Deploy Alternative Fuels Progressively Electrify the Fleet Increase Vehicle Efficiency 33


")
34 Deploy Clean Electricity Solar Photovoltaic (PV) Concentrating Solar Power Wind Nuclear Energy Other technologies Natural gas Hydro Solar thermal (parabolic troughs) Geothermal Carbon Capture and Storage 34

35 US Gas Supply by Source Unconventional gas sources will grow Source: EIA, Annual Energy Outlook 2011 Early Release 35

36 US Renewable Generation (GWh) Renewables are small, but growing rapidly, especially wind Source: EIA, Annual Energy Outlook 2011 Early Release 36
37 Renewable Electricity Costs (2009) Coal/gas-fired ~ 3-6 cents Nuclear ~ 7 cents Source: 2009 Renewable Energy Data Book (EERE) 37
 PV Module $0.80 $0.40 $1/W $0.10 $0.40 $0.")
38 DOE SunShot Program 8 $8.00 Power Electronics Installed Systems Price ($/W) $3.80/W $0.22 $1.88 $1.70 $0.12 $0.72 $0.76 Balance of Systems (BOS) PV Module $0.80 $0.40 $1/W $0.10 $0.40 $0.50 $1/W Target 38
39 Framing Energy in the Social Science/Behavioral Context Incentives Rebound effect Discount rates Energy awareness Leveraging social norms and networks Technology perception, acceptance and adoption Energy economic modeling to incorporate behavior patterns Value on intangibles (ex: human life) Must include business in these discussions!

40 QUESTIONS?/COMMENTS?
41 41