National and Global Ecosystem Assessments. Dr Mike Christie
|
|
|
- Evangeline Owen
- 5 years ago
- Views:
Transcription

1 National and Global Ecosystem Assessments Dr Mike Christie 1
2 Ecosystems approach to policy making TEEB UK NEA Overview 2
3 What is ecosystem valuation? An ecosystems approach to valuation provides a framework for looking at whole ecosystems in decision making, and for valuing the ecosystem services they provide, to ensure that we can maintain a healthy and resilient natural environment now and for future generations. 3
4 The logic underlying the ecosystem services paradigm. Biophysical structure or process (e.g. woodland habitat or net primary productivity ) Limit pressures via policy action? Σ Pressures Function (e.g. (e.g. slow slow passage of of water, water, or or biomass) Service Service (e.g. (e.g. flood flood protection, protection, or or harvestable harvestable products) products) Benefit (Value) Benefit (Value) (e.g. willingness to (e.g. willingness to pay for woodland pay for woodland protection or for protection or for more woodland, or more woodland, or harvestable harvestable products) products) Intermediate Products Final Products 4 Source: Haines-Young et al., (2006) 4
5 Ecosystems a functioning interdependent grouping of living things existing in equilibrium with their physical environment. In ecosystems (such as those in deserts, forests, wetlands, mountains, lakes, rivers, and agricultural landscapes), living creatures, including humans, form a community, interacting with one another and with the air, water, and soil around them. If one part is damaged or disappears, it can have an impact on everything else. 5
6 Ecosystems services Ecosystems provide valuable services for people; ecosystem services. There is no single way of categorising ecosystem services, but include the provision of : Resources for basic survival, such as clean air and water; A contribution to good physical and mental health, for example through access to green spaces, both urban and rural, and genetic resources for medicines; Natural processes, such as climate regulation and crop pollination; Support for a strong and healthy economy, through raw materials for industry and agriculture, or through tourism and recreation; and Social, cultural and educational benefits, and well-being and inspiration from interaction with nature. 6

7 MEA (2005): Linkages between Ecosystem services and Human wellbeing. 7
8 MEA categories Provisioning Regulating Cultural Supporting Source: MEA (2005) 8

9 Policy background - UK Provides a practical introduction to the key steps to be undertaken in valuing ecosystem services in a policy appraisal context. 9
10 Key steps in the valuation of ecosystem services: impact pathway. The impact pathway to policy change Helps to ensure a more systematic approach to accounting for impacts on ecosystems. It recognises that there is considerable complexity in understanding and assessing the causal links between a policy, its effects on ecosystems and relating services and then valuing these effects in economic terms. Requires integrated work with policy, science and economics disciplines. 10
11 TEEB


12 TEEB report The Economics of Ecosystems and Biodiversity (TEEB) study was launched in 2007 in response to a proposal by the G8+5 Environment Ministers. TEEB aims to: To draw attention to the global economic benefits of biodiversity, To highlight the growing economic and human welfare cost of biodiversity loss and ecosystem degradation, and To draw together expertise from the fields of science, economics and policy to enable practical actions to reduce biodiversity loss. 12


 TEEB for international")
 TEEB for local")
 TEEB")
13 TEEB reports TEEB has produced a series of reports, aimed at different audiences: Ecological and economic foundations (TEEB D0) TEEB for international and national policy makers (TEEB-D1) TEEB for local governments (TEEB-D2) TEEB for business (TEEB-D3) TEEB for citizens (TEEB-D4)
14 TEEB conceptual framework and valuation The TEEB framework used meta analysis to collate existing data on the costs of biodiversity loss and ecosystem degradation to estimate mean values for: 22 ESS across 12 biomes.
15 Ecosystems & Biodiversity (1 Ecological Services Human well-being (1 BENEFITS & VALUES structures & Economic Indicators processes (welfare) (photosynthesis, nutrient cycling, food-chain dynamics, etc.) Functions (2 Production -biomass Regulation -water regulat. Habitat - requirements Information -landscape TEEB conceptual framework Provisioning -Food Regulating -Flood prev. Habitat -Nursery Cultural -Recreation Social (wellbeing) Ecological (sustainability) Economic (eg. prices, GDP) Socio-cultural (eg. human wellbeing indices) Biophysical (eg. resilience) External Drivers (eg Climate change Direct drivers (1 Land-use (change) Habitat destruction Pollution & disturb. Resource use, etc Indirect drivers (1 : Demography, Technology, Economy, etc 1) The four bold-lined, brown filled boxes coincide with the overall MA-Framework Governance and Decision making Addressing needs of different actors TEEB-reports: (Inter)national policy makers (D1) Local policy makers/ administrators(d2) Producers/Businesses (D3) Consumers/Citizens (D4) Aggregation of values for decision support: -Trade-off analysis (incl. CBA, MCDA) - Accounting Systems (eg SEEA) 2) subset of ecosystem processes & components that is directly involved in providing the service
16 TEEB Biomes 1 Marine / Open Ocean 2 Coastal systems 3 Wetlands 4 Lakes/Rivers 5 Forests 6 Woodland & shrubland 7 Grass/Rangeland 8 Desert 9 Tundra 10 Ice/Rock/Polar 11 Cultivated 12 Urban These biomes were sub-divided in a much larger number of ecosystem types
17 Ecosystems & Biodiversity (1 Ecological Services Human well-being (1 BENEFITS & VALUES structures & Economic Indicators processes (welfare) (photosynthesis, nutrient cycling, food-chain dynamics, etc.) Functions (2 Production -biomass Regulation -water regulat. Habitat - requirements Information -landscape TEEB conceptual framework Provisioning -Food Regulating -Flood prev. Habitat -Nursery Cultural -Recreation Social (wellbeing) Ecological (sustainability) Economic (eg. prices, GDP) Socio-cultural (eg. human wellbeing indices) Biophysical (eg. resilience) External Drivers (eg Climate change Direct drivers (1 Land-use (change) Habitat destruction Pollution & disturb. Resource use, etc Indirect drivers (1 : Demography, Technology, Economy, etc 1) The four bold-lined, brown filled boxes coincide with the overall MA-Framework Governance and Decision making Addressing needs of different actors TEEB-reports: (Inter)national policy makers (D1) Local policy makers/ administrators(d2) Producers/Businesses (D3) Consumers/Citizens (D4) Aggregation of values for decision support: -Trade-off analysis (incl. CBA, MCDA) - Accounting Systems (eg SEEA) 2) subset of ecosystem processes & components that is directly involved in providing the service
18 ES Services in TEEB Provisioning 1 - Food 2 - Water 3 - Raw Materials 4 - Genetic resources 5 - Medicinal resources 6 - Ornamental resources Regulating 7 - Air quality regulation 8 - Climate regulation 9 - Moderation of extreme events 10 - Regulation of water flows 11 - Waste treatment 12 - Erosion prevention 13 Maint. soil fertility 14 - Pollination 15 - Biological control Habitat/Supporting 16 Maint. of migratory species (incl. nursery service) 17 Maint. of genetic diversity (incl. evolutionary processes) Cultural [provide opportunities for:] 18 - Aesthetic enjoyment 19 - Recreation & tourism 20 - Inspiration for culture, art & design 21 - Spiritual experience 22 - Cognitive development

19 Economic benefits: Captures total economic value. Use values: e.g. Direct use values and Indirect use Non-use values: Option, bequest, existence There are a ranges of economic methods to capture these values Social-cultural benefits: Includes mental health, historical, ethical, religious and spiritual values. Ecological values: Ecological measures such as integrity, health or resilience indicators Important to determine critical thresholds and minimum requirements for ESS provision Benefits and values
20 Valuation methods used in the TEEB value transfer 1 Direct Market Pricing 2 Avoided cost 3 Replacement cost 4 Factor income 5 Travel cost method 6 Hedonic pricing 7 Contingent Valuation 8 Group valuation

21 D1 D4 reports used to disseminate information TEEB-Framework Link with decision-making

22 TEEB-Framework Scenario analysis: Used to inform decision makers of the welfare gains and losses of alternative possible futures and different associated policy packages Drivers Direct drivers Indirect drivers External
23 UK NEA 23

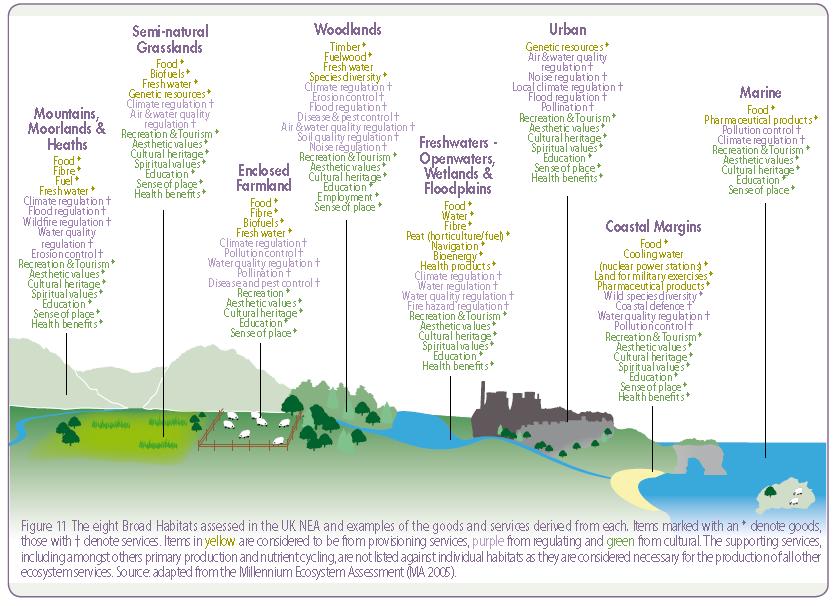
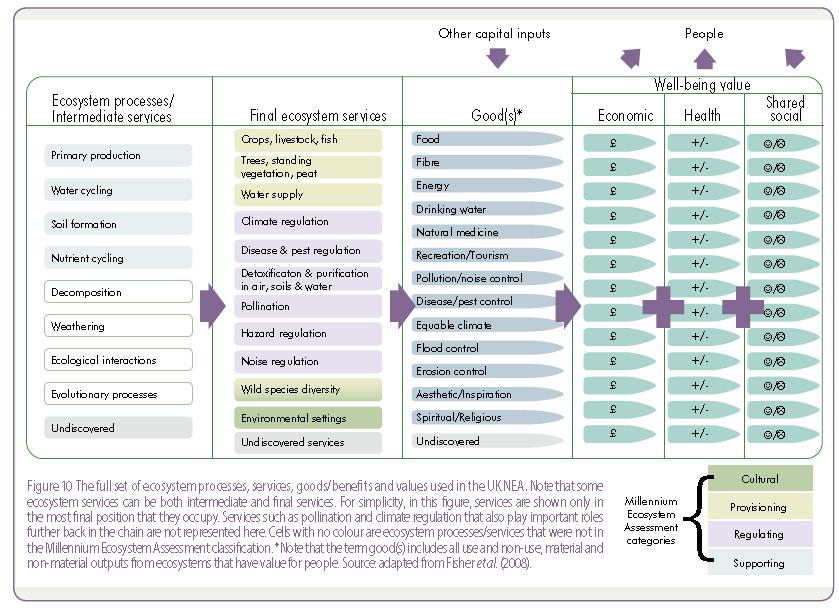
24 UK NEA NEA conceptual framework 24
25 UK NEA: Key questions 1. What are the status and trends of the UK s ecosystems and the services they provide to society? 2. What are the drivers causing changes in the UK s ecosystems and their services? 3. How do ecosystem services affect human well-being, who and where are the beneficiaries, and how does this affect how they are valued and managed? 4. Which vital UK provisioning services are not provided by UK ecosystems? 5. What is the current public understanding of ecosystem services and the benefits they provide? 6. Why should we incorporate the economic values of ecosystem services into decision making? 7. How might ecosystems and their services change in the UK under plausible future scenarios? 8. What are the economic implications of different plausible futures? 9. How can we secure and improve the continued delivery of ecosystem services? 10. How have we advanced our understanding of the influence of ecosystem services on human well-being and what are the knowledge constraints on more informed decision making?

26 TRENDS: Importance of, and trends in, the impact of drivers of change on UK habitats

27 Trends Importance of, and trends in, the impact of drivers of change on UK ecosystems services

28 UK NEA TRENDS: Importance of, and trends in, the capacity of UK habitats to deliver ecosystem services 28
29 What are the economic implications of different plausible futures? What was valued? 6 scenarios 8 habitats 5 ecosystem services How were values estimated? Values were estimated using spatially sensitive value functions from pan UK spatially referenced data GHG based on a process model which was adjusted for land use and soil characteristics.

30 UK NEA: Scenarios
31 UK NEA 31
32 UK NEA 32

33 Key findings
34 Summary: An ecosystems approach to policy making Provides a way of linking together a number of crosscutting environmental challenges into a single, coherent framework. It helps ensure that policy makers are able to deal with cumulative pressures on the natural environment and capture the true value of ecosystem services, so that they can design policies in a way which will enable us to live within environmental limits and mitigate and adapt to climate change and other pressures on the natural environment. 34