Cumberland Power Plant
|
|
|
- Aubrey Perkins
- 5 years ago
- Views:
Transcription


1 Reactive Plume Modeling with SCICHEM and CMAQ for Tennessee Valley Authority Cumberland Power Plant James T. Kelly and Kirk R. Baker Office of Air Quality Planning & Standards US Environmental Protection Agency 2012 Regional, State, and Local Modeler s Workshop April 30 th May 4 th, Chicago, IL Google earth
2 Motivation A need exists for single-source modeling that accurately simulates secondary PM and ozone formation The SCICHEM reactive plume model could potentially play a role in single-source applications for secondary pollutants However, to assess the applicability of SCICHEM Tools must be developed d for processing inputs/outputs t t Predictions must be evaluated for reg. relevant conditions This study is a preliminary evaluation of a pre-release release version of SCICHEM using in-plume observations 1
3 SCICHEM: Second-order Closure Integrated puff model with CHEMistry Plume represented by numerous puffs that are advected and dispersed independently according to local meteorology Second-order closure for integrating turbulent diffusion equation Dispersion rate is related to velocity fluctuation statistics Puff merging/splitting to represent inhomogeneous meteorology Puffs split when grow to value related to grid resolution Puffs merge when overlap is significant Simulates chemical processes in gas, aerosol, and aqueous phases 2


: Species 1999")

4 Source: Steven Greenwood (Feb 2004) TVA Cumberland Power Plant Located ~80 km NW of Nashville Lat: 36 23'29" N, Lon: 87 39'17" W Consumes ~20,000 tons of coal per day Two coal-fired generating units with summer net capability of 2,386 MW Observations available from helicopter plume transects in July 1999 Emissions (tons): Species NO x 80,900 4,890 SO 2 15,920 11,430 Source: 3
5 4 SCICHEM Modeling SCICHEMv2.1 configuration Carbon Bond-IV gas-phase chemistry MADRID aerosols w/ ISORROPIA inorganic thermodynamics Period 1999 Nashville/Middle Tennessee Southern Oxidants Study 6 July 1999 for hour 0-18 LST Cases 1) SCICHEM-WRF Meteorology: WRFv3.3 3 output converted to MEDOC format with MMIFv2.1 Background concentration: Time-varying based on CMAQ output 2) SCICHEM-DIAG Meteorology: Interpolated field based on observations from four stations provided in SCICHEM pre-release test-case files Background concentration: Constant values from SCICHEM pre-release test-case files with O 3 =60 ppb and SO 2 =0.5 ppb Emissions Hourly emissions of NO, NO 2, SO 2, etc. based on CEM data (see next slide)


6 CMAQ Modeling Community Multiscale Air Quality (CMAQ) model version National Emissions Inventory anthropogenic emissions 1999 hour-specific biogenic emissions estimated with BEIS model 1999 hour-specific CEM data for TVA Cumberland plant emissions Modeling Domains 12 km 4 km 5
7 Comparison of Absolute Concentrations: ti CMAQ and SCICHEM-WRF Overlay SCICHEM-WRF predictions at receptor rings onto CMAQ spatial concentration fields 6
8 NO x Concentration: CMAQ and SCICHEM-WRF 7
9 SO 2 Concentration: CMAQ and SCICHEM-WRF 8
10 Comparison of Plume Concentrations: CMAQ, SCICHEM-WRF, SCICHEM-DIAG Estimate plume concentrations for CMAQ and SCICHEM by subtracting zero-out predictions from base-case predictions Overlay y SCICHEM plume concentrations at receptor rings onto CMAQ plume-concentration fields 9
11 SO 2 Difference (Base - Zero out): CMAQ, SCICHEM-WRF WRF, SCICHEM-DIAG CMAQ and SCICHEM-WRF CMAQ and SCICHEM-DIAG 10
12 NO x Difference (Base - Zero out): CMAQ, SCICHEM-WRF WRF, SCICHEM-DIAG CMAQ and SCICHEM-WRF CMAQ and SCICHEM-DIAG 11
13 O 3 Difference (Base - Zero Out): CMAQ, SCICHEM-WRF WRF, SCICHEM-DIAG CMAQ and SCICHEM-WRF Ozone production Ozone destruction: NO + O 3 NO 2 + O CMAQ and SCICHEM-DIAG 12


14 TVA Bell 205 Helicopter Observations 12 traverses of plume downwind of the TVA power plant on 6 July 1999 at an average altitude of 500 m Clear day with light winds from west/northwest Observed species in include O 3, NO, NO 2, NO z, and SO 2 ~11 km ~31 km ~65 km ~90 km ~11 LST ~12 LST ~15 LST Google earth Nashville ~16 LST 13
15 14 SO 2 for Plume Transects on July 6 th
16 15 NO x for Plume Transects on July 6 th
17 NO z for Plume Transects on July 6 th NO Z : Sum of NO X oxidation products (e.g., HNO 3, PAN) 16
18 17 O 3 for Plume Transects on July 6 th
19 Comparison of Centered Plume-Increment Profiles: Observed, CMAQ, SCICHEM-WRF, SCICHEM-DIAG Find max/min in concentration along plume transect or receptor arc for model (Base Zero-out) and observations (Plume Background) Center concentrations to max/min value Compare centered profiles for model and observations 18
20 SO 2 Centered Plume-Increment Profiles 19
21 NO x Centered Plume-Increment Profiles 20
22 NO z Centered Plume-Increment Profiles 21
23 O 3 Centered Plume-Increment Profiles 22
24 O 3 Centered Plume-Increment Profiles: SCICHEM Runs w/ Increased Puff Resolution 23 Puff resolution increased by adjusting mgrd and hres settings SCICHEM-WRF: 8 km maximum horizontal size of puff SCICHEM-DIAG: 0.4 km maximum horizontal size of puff
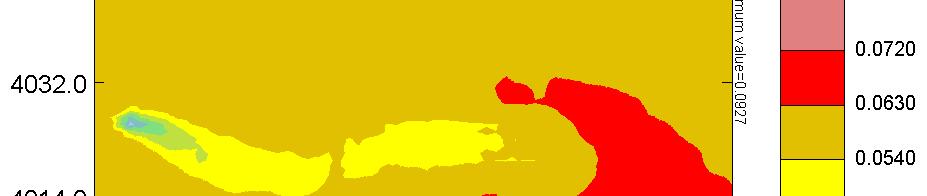
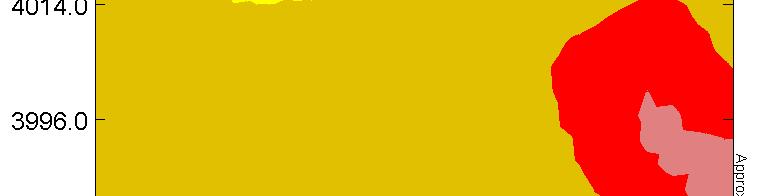
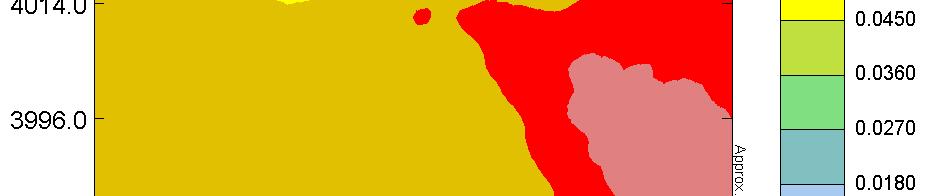

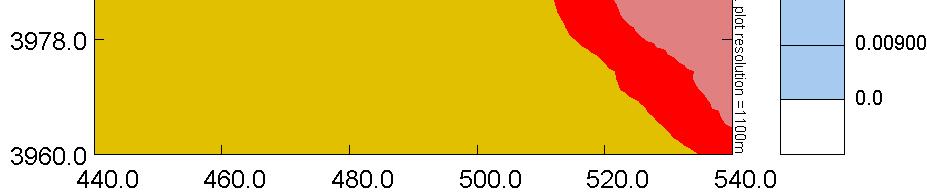
25 O 3 Concentration at 500 m Altitude SCICHEM-DIAG Max: 79.5 ppb SCICHEM-DIAG Max: 92.7 ppb Default Resolution High Resolution 24
26 Summary of Preliminary Work Preliminary tools were developed for using SCICHEM Process model inputs/outputs Compare SCICHEM results with CMAQ results and observations SCICHEMv2.1 and CMAQv4.7.1 simulations were conducted for 6 July 1999 TVA Cumberland Plant case Reasonable model behavior was observed, e.g., Elevated SO 2 and NO x concentration in plume SO 2 and NO x concentration profiles broaden and have lower peaks in afternoon and further from source due to dilution O 3 titration in NO x -rich, VOC-poor plume; O 3 production far from source 25
27 Next Steps Explore impact of SCICHEM model configurations on downwind ozone production Repeat study with new SCICHEM release version when available Consider additional plume observation studies Simulate longer periods and larger domains relevant for regulatory applications 26
28 Acknowledgments Biswanath Chowdhury of Sage Management Prakash Karamchandani and Shu-Yun Chen of ENVIRON Eladio Knipping of Electric Power Research Institute 27