AdOc 4060 / 5060 Seawater Salinity. CTD (Conductivity / Temperature / Depth) 2013 Spring Chris Jenkins
|
|
|
- Felicity Reynolds
- 5 years ago
- Views:
Transcription

1 AdOc 4060 / 5060 Seawater Salinity CTD (Conductivity / Temperature / Depth) 2013 Spring Chris Jenkins

2 Conductivity measurement Accuracy: 0.75 psu (practical salinity unit) Ocean water: 35 psu = 35,000 ppm (by weight) of salt in water Thermistor (Pt) Range: -1 to 40 deg C Accuracy: +/- 0.1deg C Temperature measurement


3 Profiling

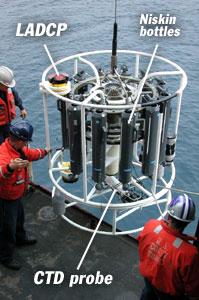
4 Niskin bottles Bottles can be closed when desired by researchers on the ship Water samples can be obtained to calibrate the CTD and to investigate properties not measured by the CTD such as dissolved nutrient content, carbon dioxide, chlorofluorocarbons, and others tracers.

5 Nansen bottles Approximately 12 to 24 Nansen bottles are attached in series at predetermined intervals along a cable Deployed with both ends open Closes as the bottles are reversed Used in conjunction with inverting or reversing thermometers
6 Inverting thermometers Has a constriction in the capillary that allows it to retain its reading upon being inverted Deployed in pairs, one protected and the other unprotected from high pressures. Combination of the two gives temperature and pressure at the depth where reversal took place
7 Salinity The total amount of solid material dissolved in water. Concentration, often described as parts per thousand Average ocean salinity is 35 parts per thousand (or about 3.5%) By evaporation of seawater (inaccurate) By chlorinity method (via titration) S = Cl By electrical conductivity conductivity is proportional to salinity
: anions (-ve ions) Chloride Sulphate (SO 4 2")
 Sodium (Na +, cation) Magnesium (Mg 2+ ) Calcium")
8 Main constituents of seawater (ions) Main constituents of seawater (> 1ppm): anions (-ve ions) Chloride Sulphate (SO 4 2 ) Bicarbonate Bromide, Borate & Fluoride cations (positive ions) Sodium (Na +, cation) Magnesium (Mg 2+ ) Calcium Potassium Strontium
9
10
11 Forchammer, Dittmar and the law of constant proportions Regardless of salinity, the major ions are found in the same proportions throughout the world ocean (chemical equilibrium) This means that if you measure one, you have them all. Oceanographic insights can be found in the exception to this rule.
12 Example: Law of constant proportions Suppose you are given a sea water sample and you are told that it has 12.1 ppt of Sodium. What is the overall salinity of this sample? Table 3.1 (p. 29) shows that standard seawater has: Sodium (ppt) / Salinity (ppt) = / = Our sample must have this same ratio, so we have: 12.1 (ppt) / Salinity = With a little algebra we find: Salinity = (ppt)

13 Practical Salinity Scale PSS
14 Salinity variations Location/type Normal open ocean Baltic Sea Red Sea Great Salt Lake Dead Sea Tap water Premium bottled water Human tears Salinity (brackish) 42 (hypersaline) or less 0.3 9
15
16 Processes affecting seawater salinity Processes that decrease seawater salinity: Precipitation Runoff Icebergs melting Sea ice melting Processes that increase seawater salinity: Sea ice forming Evaporation Precipitation and evaporation are most important overall.

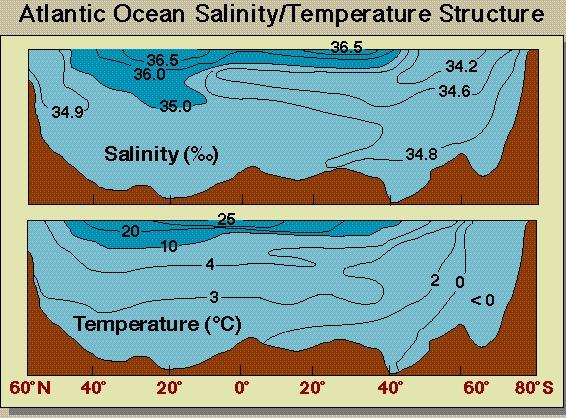
17 Surface salinity variation Pattern of surface salinity: Lowest in high latitudes Highest in the tropics Dips at the Equator Surface processes help explain pattern Figure 5-20
18 Surface salinity variation High latitudes have low surface salinity High precipitation and runoff Low evaporation Tropics have high surface salinity High evaporation Low precipitation Equator has a dip in surface salinity High precipitation partially offsets high evaporation
19 Global surface salinity
20 Salinity variation with depth Curves for high and low latitudes begin at different surface salinities Halocline = layer of rapidly changing salinity At depth, salinity is uniform
21
22 Summary SW salinity is on average 35 ppt by weight 11 major ions make up 99.9% of the dissolved constituents Constituents differ greatly from crustal rock due to differences in their solubilities Salinity varies with depth and latitude but the constituent ratios remain virtually constant: evaporation and precipitation change the total salinity but not the composition Minor departures are a result of biological processes affecting Ca ++ and HCO 3 - Major departures occur only locally (anoxic conditions, hydrothermal vents) Surface salinities are largest in the tropical and subtropical latitudes where evaporation is greater than precipitation; and smallest in higher latitudes where precipitation and runoff is greater than evaporation Electrical conductivity is the modern means of measurement

23 Salinity clock?