Fuels from Biomass via Supercritical Fluid Processes. Phillip E. Savage University of Michigan Chemical Engineering Department
|
|
|
- Lucas Booker
- 5 years ago
- Views:
Transcription
1 Fuels from Biomass via Supercritical Fluid Processes Phillip E. Savage University of Michigan Chemical Engineering Department
2 Running out of fossil fuels? We ve had 3-4 year s of oil in proven reserves for the last 5 years

3 Running out of energy? Geothermal provides another large source of energy
4 Drivers for Renewable Energy Several different problems are driving development of renewable energy Several different contributors will be needed to solve the problems, and the mix will change over time No single contributor can solve all of the problems - explore many options, develop portfolio No single contributor will be perfect Must not let the perfect be the enemy of the good
5 Research Theme: Chemistry in supercritical fluids for renewable energy
6 Why Supercritical Fluids? Solubility and phase behavior Multi-phase system can become one phase Solvothermal reactions occur Opportunities for new reaction pathways Manipulate solvent properties by tuning P
7 Water as a Medium for Chemical Transformations Chemical Synthesis (Green chemistry & engineering) Materials Synthesis (Nanoparticle quantum dots) Sustainable Energy (Liquid & gaseous fuels from biomass) Biodiesel synthesis Biomass gasification Hydrothermal liquefaction of microalgae
8 Biomass Gasification in Supercritical Water (SCW)
 Gasify above critical point (374 C, 218 atm) Reduces char/tar relative to conventional gasification Some dissolution and hydrolysis of biomass occurs")
9 Gasification in SCW Biomass contains moisture Dry it (put in energy, time) Process it wet Supercritical Water Gasification (SCWG) H 2 O Fuel Cell CO 2 H 2 SCW Gasification Add more water (more H atoms available) Gasify above critical point (374 C, 218 atm) Reduces char/tar relative to conventional gasification Some dissolution and hydrolysis of biomass occurs
10 SCWG Background Technical feasibility demonstrated for many different feedstocks Energy/economic feasibility studied SCWG preferred for feeds with > 3 wt % water barley straw (3%), bagasse (45-5%), poplar (45%), willow (6%) Energy efficiency ~ 75% EROEI ~ 4.5 energy in product gas/ unrecovered energy in SCWG process energy in product gas/ (energy in biomass + unrecovered energy in SCWG process)

11 Objectives Gasify biomass and components thereof lignin, cellulose SCWG at non-catalytic conditions metal free for the first time Systematic study of process variables Evaluate effects of metal catalysts SCWG of model compounds Kinetics, intermediate products, pathways Molecule-based reaction model


12 Experimental Quartz capillary tube batch reactors Separate homogeneous and metal-catalyzed reactions Load, flame seal, immerse in preheated sandbath Recover products Analyze by GC (-MS) or HPLC
13 Gas analysis validation Formic Acid decomposition in SCW 1 reactors run at long times (3+ hr.), various concentrations Equilibrium composition calculated using ASPEN Plus (RGIBBS) Equilibrium Mole Frac. Measured Mole Frac. H ±.3 CO ±.11 CH ±.17 CO.2.4 ±.1 GC analysis gives good mole fraction data
14 1 Effect of Time.8 g/ml, 9. wt % loading 1 8 CO CO CH 4 H 2 CO tim e (min) Cellulose (5 C) 4 2 CH 4 H 2 CO time (min) Lignin (6 C) Reactions: steam reforming, combustion, pyrolysis, water-gas shift, methanation from Resende et al., Energy & Fuels 21, 3637, 27; 22, 1328, 28
15 molar % Effect of Time on Molar Composition Lignin, 6 C,.8 g/ml, 9. wt % CO CH 4 CO 2 CO 2 (equilibrium) H 2 (equilibrium) CH 4 (equilibrium) H 2 CO 2 (equilibrium) CO 2 CH 4 H 2 (equilibrium) CO (equilibrium) CH 4 (equilibrium) 2 time (min) H 2 CO Lignin, 6 C CO (equilibrium) time (min)
16 gas yields (mmol/g) Effect of Temperature.8 g/ml, 9. wt% loading gas yields (mmol/g) H2 CO CH4 CO2 H2 CO CH4 CO2 Cellulose (5 min) Lignin (45 minutes) from Resende et al., Energy & Fuels 21, 3637, 27; 22, 1328, 28
17 yields (mmol/g) Effect of Water Density Biomass loading = 9. wt % yields (mmol/g) g/cm3.5 g/cm3.8 g/cm3.18 g/cm3 H2 CO CH4 CO2 Cellulose, 5 C, 7.5 min g/cm^3.5 g/cm^3.8 g/cm^3.18 g/cm^3 H2 CO CH4 CO2 Lignin, 6 C, 6 min Increasing water density increases H 2 yields and reduces CO yields from Resende et al., Energy & Fuels 21, 3637, 27; 22, 1328, 28

18 yields (mmol/g) gas yields (mmol/g) Effect of Metal Wire 5. wt % loading,.8 g/ml, catalyst surface area: 4 mm Non-Catalytic Ni Fe Cu Homogeneous Ni Fe Cu H2 CO CH4 CO2 H2 CO CH4 CO2 Cellulose, 5 C, 1 min Lignin, 6 C,15 min metal wire used, same length as quartz reactor all metals increase H 2 (more than 2X) and CO 2 yields accelerated steam reforming?
19 gas yields (mmol/g) Effect of Metal Catalysts 9. wt % loading,.8 g/ml, catalyst surface area: 4 mm 2 gas yields (mmol/g) Homogeneous Ni Fe Cu H2 CO CH4 CO Homogeneous Ni Fe Cu H2 CO CH4 CO2 Cellulose, 5 C, 1 min Lignin, 6 C,15 min all metals increase H 2 yields (less than 2X) less effect than at 5. wt % loading
20 gas yields (mmol/g) Effect of Metal Catalysts 33.3 wt % loading,.8 g/ml, catalyst surface area: 4 mm 2 gas yields (mmol/g) 1 7 Homogeneous Homogeneous Ni 6 Ni 8 Fe Fe Cu 5 Cu H2 CO CH4 CO2 Cellulose, 5 C, 1 min H2 CO CH4 CO2 Lignin, 6 C,15 min metals have little effect on gas yields too much biomass relative to amount of catalyst present
21 Effect of Ni Catalysts 1. wt % loading,.8 g/ml, catalyst surface area: 4 mm 2 /wire gas yields (mmol/g) 3 Non-Catalytic 25 1 w ire 2 w ires 2 3 w ires 15 Cellulose, 5 C, 1 min 1 5 H2 CO CH4 CO2
22 Effect of Ni Catalysts 1. wt % loading,.8 g/ml, catalyst surface area: 4 mm 2 /wire % Cellulose, 5 C, 1 min Non-Catalytic 1 w ire 2 w ires 3 w ires C yield Energy Content H yield
23 Non-catalytic SCWG Model Develop mathematical model based on governing chemical reactions Steam reforming Water-gas shift Methanation Hydrolysis Use experimental data to determine kinetics and rate equations for each reaction
24 Kinetic Model - Lignin k 1.) (C 1 H 1 O 3 ) n + n H 2 O 1 n C 1 H 12 O 4 Hydrolysis 2.) C 1 H 12 O 4 C x H y O z Intermediate Formation 3.) C x H y O z + (x-z) H 2 O x CO + (x- z + y/2) H 2 Steam-reforming I 4.) C x H y O z + (2x-z) H 2 O x CO 2 + (2x- z + y/2) H 2 Steam-reforming II k 5 5.) C x H y O z CO + C x H y O z CO from Intermediate k 6 6.) C x H y O z CO 2 + C x H y O z CO 2 from Intermediate k 7 k 2 k 3 k 4 7.) C x H y O z CH 4 + C x H y O z CH 4 from Intermediate k 8.) C x H y O 8 z H 2 + C x H y O z H 2 from Intermediate k 9 9.) C x H y O z w C + C x-w H y O z Char from Intermediate k 1 1.) CO + H 2 O CO 2 + H 2 Water-Gas Shift k 11.) CO + 3 H 11 2 CH 4 + H 2 O Methanation
25 Kinetic Model - Lignin Assume Rxn 1 (hydrolysis) is very fast, initial reactant is monomer Model Equations: dc CO dt xk 3 C I C W k 5 C I k 1 C CO C W k 1i C CO2 C H 2 k 11 C CO C H 2 k 11iCCH4CW dc CO dt 2 xk 4 C C I W k 6 C I k 1 C CO C W k 1i C CO2 C H2 dcch 4 dt k 7 C I k 11 C CO C H2 k 11i C CH4 C W
26 Kinetic Model - Lignin H 2 : dc H 2 dt (x y y /2)k 3 C I C W (2x z y /2)k 4 C I C W k 8 C I k 1 C CO C W k 1 i C CO2 C H2 3k 11 C CO H 2 3k 11i C CH4 C W Monomer: dc M dt k 2 C M Intermediate: dc I dt k 2 C M k 3 C I C W k 4 C I C W k 9 C I Water: dc W dt 6k 4 C I C W k 1 C CO C W k 1i C CO2 C H 2 k 11 C CO C H2 k 11i C CH4 C W
27 Parameter Estimation Experimental Data Used Lignin, base case: 6 C,.8 g/ml, 9. wt %, min Fitted Variables: Conc. of CH 4, CO 2, CO, H 2 (mol/l) vs. time Objective function minimized: Sum of squared errors Software: Scientist 3. (Micromath) Initial guesses for parameters found by trial-and-error method Reversible reactions: k r k f K
28 yield (mmol/g) yield (mmol/g) yields (mmol/g) yield (mmol/g) Kinetic Model - Results (Lignin) CO H time (min) time (min) Rate constants: k 2 = 1.67 min -1 k 3 = 5.x1-4 min -1 k 4 = 2.73x1-3 min -1 k 5 =.539 min -1 k 6 =.767 min -1 k 7 =.942 min -1 k 8 = min -1 k 9 =.938 min -1 k 1 = 2.8x1-3 l/(mol.min) k 1i = 1.5x1-3 l/(mol.min) k 11 = 7.71x1-2 l/(mol.min) k 11i = 7.52x1-6 l/(mol.min) CO time (min) CH time (min)
29 Experimental yields (mmol/g) Testing the Model Experimental Yields vs. Predicted Yields 5. wt % 33.3 wt %.5 g/ml CH 4 CO 2.18 g/ml 1. wt % CO 2 5 CH 4 CO CO H 2 CO CH 4 CO CO H 2 H 2 H Predicted yields (mmol/g)
30 molar % Equilibrium Predictions Equilibrium Yields - Lignin, Base Case ASPEN Model H2 CO2 CH4 CO
31 Rates of H 2 Formation/Consumption Rate (mol/l.min) 4.E-3 6 C, 9. wt %,.8 g/ml 3.E-3 Steam-Reforming II 2.E-3 1.E-3 Steam-Reforming I Water-Gas Shift Forward Methanation Reverse.E+ -1.E-3 Methanation Forward time (min)
32 Sensitivity Analysis Sensitivity Coefficient: S i, j lnc i ln k j C i Ci k j k j k.5k j i is one the gas species j is one of the reactions C i calculated by running the model with the altered k j S i,j calculated for short times (1 min) and long times (75 min)
33 Sensitivity Coefficients - 1 min 6 C, 9. wt %,.8 g/ml CO CO 2 CH 4 H 2 Intermediate Formation 4.96E-1 5.1E E-1 5.3E-1 Steam-reforming I 1.72E E E E-2 Steam-reforming II -2.77E-2 9.9E E E-1 CO from Intermediate 9.63E E E E-2 CO 2 from intermediate E CH 4 from Intermediate -1.19E E E E-4 H 2 from Intermediate Char from Intermediate -6.35E E E E-1 Water-Gas Shift -9.34E E E E-2 Methanation -2.96E-4-9.3E E E-3
34 Sensitivity Coefficients - 75 min 6 C, 9. wt %,.8 g/ml 75 min CO CO 2 CH 4 H 2 Intermediate Formation -7.56E E E E-3 Steam-reforming I 2.89E E E-3 5.2E-2 Steam-reforming II -5.59E E E E-1 CO from Intermediate 9.3E E E E-1 CO 2 from intermediate 3.2E E E-3 CH 4 from Intermediate 5.4E E E E-2 H 2 from Intermediate Char from Intermediate -8.84E-1-9.3E E-1-7.6E-1 Water-Gas Shift -8.44E-1 1.6E E-3 4.1E-1 Methanation -7.64E E E E-1
35 Sensitivity Analysis - Lignin - 1 min k 1.) (C 1 H 1 O 3 ) n + n H 2 O 1 n C 1 H 12 O 4 Hydrolysis 2.) C 1 H 12 O 4 C x H y O z Intermediate Form 3.) C x H y O z + (x-z) H 2 O x CO + (x- z + y/2) H 2 Steam-reforming I 4.) C x H y O z + (2x-z) H 2 O x CO 2 + (2x- z + y/2) H 2 Steam-reforming II k 5 5.) C x H y O z CO + C x H y O z CO from Intermediate k 6 6.) C x H y O z CO 2 + C x H y O z CO 2 from Intermediate k 7 k 2 k 3 k 4 7.) C x H y O z CH 4 + C x H y O z CH 4 from Intermediate k 8.) C x H y O 8 z H 2 + C x H y O z H 2 from Intermediate k 9 9.) C x H y O z w C + C x-w H y O z Char from Intermediate k 1 1.) CO + H 2 O CO 2 + H 2 Water-Gas Shift k 11.) CO + 3 H 11 2 CH 4 + H 2 O Methanation
36 Sensitivity Analysis - Lignin - 75 min k 1.) (C 1 H 1 O 3 ) n + n H 2 O 1 n C 1 H 12 O 4 Hydrolysis 2.) C 1 H 12 O 4 C x H y O z Intermediate Formation 3.) C x H y O z + (x-z) H 2 O x CO + (x- z + y/2) H 2 Steam-reforming I 4.) C x H y O z + (2x-z) H 2 O x CO 2 + (2x- z + y/2) H 2 Steam-reforming II k 5 5.) C x H y O z CO + C x H y O z CO from Intermediate k 6 6.) C x H y O z CO 2 + C x H y O z CO 2 from Intermediate k 7 k 2 k 3 k 4 7.) C x H y O z CH 4 + C x H y O z CH 4 from Intermediate k 8.) C x H y O 8 z H 2 + C x H y O z H 2 from Intermediate k 9 9.) C x H y O z w C + C x-w H y O z Char from Intermediate k 1 1.) CO + H 2 O CO 2 + H 2 Water-Gas Shift k 11.) CO + 3 H 11 2 CH 4 + H 2 O Methanation
37 Kinetic Model Summary of Results We developed the first kinetic model for non-catalytic SCWG The model is able to predict experimental results for different biomass loadings and water densities up to.8 g/ml There are high rates for the formation of CH 4, CO and CO 2 from the intermediate Water-gas shift becomes the main source of H 2 after 5 minutes
38 Lignin Model Compounds Lignin Guaiacol Phenol Guaiacol
39 Guaiacol SCWG at 5 C liquid products time (min) o-cresol w /Ni o-cresol w /out Ni Phenol w / Ni Phenol w /out Ni First report on liquid phase products from SCWG from DiLeo et al., Energy & Fuels 21, 234, 27
40 Mole % Guaiacol SCWG at 5 C gas products, 5 min 6 5 w/out Ni w/ Ni H2 CO CO2 CH4 from DiLeo et al., Energy & Fuels 21, 234, 27
 After reaction")
41 Guaiacol SCWG - char Unidentified solid product from reactions Ni altered the appearance of the char Before reaction (with Ni wire) After reaction (charring)
42 Guaiacol SCWG Summary Guaiacol conversion complete in < 2 min at 5 o C Little effect of Ni on liquid-phase products Homogeneous decomposition of guaiacol in SCW Not catalyzed by Ni Strong effect of Ni on gas-phase products More H 2 and less CH 4 in the presence of Ni Large amount of char Try SCWG with simpler molecule - Phenol

43 Homogeneous SCWG of Phenol 6 o C, 5 wt%, w =.79 g/ml

44 Homogeneous SCWG of Phenol 6 o C, 5 wt%, w =.79 g/ml

45 Homogeneous SCWG of Phenol 6 o C, 5 wt%, w =.79 g/ml

46 Phenol SCWG at 6 C
47 Phenol SCWG Gas Yields (6 o C) 5 wt. %, w =.79 g/ml, Ni-catalyzed CH time (min) CO CO 2 H 2 CO formed early, then reacts away in WGS and methanation Equilibrium composition reached in 3 min from DiLeo et al., Energy & Fuels 21, 234, 27; 22, 871, 28
48 Effect of Catalyst Amount 6 o C, 5 wt%, w =.79 g/ml wires 1 wire k homogeneous 3. ± s Homogeneous time (min) k Ni catalyzed 4.8 ± s ± cm/s from DiLeo et al., Energy & Fuels 21, 234, 27; 22, 871, 28
49 Water Density Effect 6 o C, 5 wt% Mid Low High Water Densities (g/ml) Low =.64 Mid =.79 High = time (min) Rate Constant k (cm/s) Low k = 1.3 ± Mid k = 1.1 ± High k =.14 ± from DiLeo et al., Energy & Fuels 21, 234, 27; 22, 871, 28
50 Biodiesel Synthesis in Supercritical Alcohol
 Problems with cheap feedstocks (waste cooking")
51 Biodiesel Synthesis Convert plant oils or fats into alkyl esters diesel fuel Current processes use catalysts Work well for pure feedstocks ($$) Problems with cheap feedstocks (waste cooking oil)
52 Catalyzed Biodiesel Synthesis Feedstocks with impurities (free fatty acids, water) need to be pretreated before processing Adds to processing cost Separation steps needed to remove catalyst from fuel product and glycerol Adds to processing cost Adds to energy requirements Consider uncatalyzed process Easier to use low cost feedstock Simpler process
53 Transesterification in SC MeOH No catalyst, supercritical fluid processing Single-phase reaction medium Need high alcohol:oil ratio (~ 4:1) Need high temperatures (~ 3 C) Technological feasibility demonstrated Economic feasibility demonstrated for waste cooking oil Noncatalytic SCF process more economical than homogeneous base- or acid-catalyzed process But is an even simpler noncatalytic route available? See review by Pinnarat & Savage., Ind. Eng. Chem. Res. 28.
54 Two-step Noncatalytic Synthesis 1st step: hydrolysis in high-temperature water Trioleate 3 Water 3 Oleic acid Glycerol 2nd step: esterification in alcohol Oleic acid EtOH Ethyl Oleate Water Two-step synthesis may proceed at milder reaction conditions than single step (transesterification) approach

55 Esterification Step Determine effect of reactor loading (pressure/phase) Determine effect of temperature Determine effect of ethanol to oleic acid ratio Determine effect of water content in feed Determine kinetics for ethyl esterification Esterification: Oleic acid EtOH Ethyl Oleate Water All in a metal-free reactor - first reaction study with no unintentional metal catalysis effects (from reactor walls)
56 High Conversions at Mild Conditions - no catalyst, liquid phase C 2 C 18 C Time (min) Lower energy required for biodiesel production
57 Ethanol:Oleic Acid Ratio Has Small Effect Conversion at 4 min :1 3:1 5:1 7:1 1:1 1:1 3:1 5:1 7:1 1:1 1:1 3:1 5:1 7:1 1: o C, f = o C, f = o C, f =.4 23oC f= oC f= oC f=.47 Large excess amounts of alcohol not needed
58 Conversions in Different Fluid Phases - no catalyst :1 (Liquid) :1 (Supercritical) At 25 o C, f = Time (minutes) Phase present in reactor influences conversion Liquid phase gave higher conversion than gas phase
59 Kinetics Analysis Assume single fluid phase present throughout reaction First order with respect to each reactant For batch reactor with 1:1 alcohol:oil molar ratio: dx dt C A k X (1 k 1 k 1 )X 2 Analytical solution X p(1 exp Z) (1 p exp Z) q Use non-linear regression to fit model to experimental data F (X expt X model ) 2 p, q ( k 1 4( k Z C A ( t k1 k 1 )( p q) k 1 1 ) / k k 1 1 ) / k 1
60 Kinetics Analysis o C, f =.4 25 o C, f = o C, f =.56.1 at EtOH:Oleic=1: Time (min)
 decompressor are needed to see this picture.")

61 Hydrothermal Liquefaction Microalgae contain moisture De-water, dry, extract oils put in energy, time Process it wet CO 2 H 2 O QuickTime and a TIFF (Uncompressed) decompressor are needed to see this picture. Bio Fuel Hydrothermal Processing Renewable, Carbon-Free Fuels from Biomass Hydrothermal liquefaction Hydrolyze protein, triglycerides, and carbohydrates Liquefy around 3 C Oil yield exceeds triglyceride content Catalytic upgrading needed to make hydrocarbons
62 Hydrothermal Liquefaction TIC of bio-oil from liquefaction 35 C, 6 min, 15 wt% algae, Neochloris oleabundans
63 Acknowledgements Hydro. Liquefaction Esterification SCWG QuickTime and a TIFF (Uncompressed) decompressor are needed to see this picture. QuickTime and a TIFF (Uncompressed) decompressor are needed to see this picture. Quick Time and a TIFF (Uncompress ed) decompressor are needed to s ee this pic ture.
64
65
66
67 Expertise & Interests Hydrothermal processing Supercritical fluid processing Biomass, fossil fuels, materials, Reaction kinetics Reaction modeling Sustainability evaluations Process comparisons Life cycle assessments
68 High Conversions at Mild Conditions - no catalyst o C, f =.4 25 o C, f = o C, f =.56.1 at EtOH:Oleic=1: Time (minutes) 25 o C f =.47 has highest conversion (lowest pressure!) Lower energy required for biodiesel production
69 Conversion at 3 min Esterification Inhibited by Water % 1% 3% 5% 1% 15% % 1% 3% 5% 1% 15% % 1% 3% 5% 1% 15%.1 23oC o C, f f=.56 = 25oC o C, f=.26 f = 25oC o C, f=.4f = Water in feed is a bigger problem for catalytic processes
70 Comparison with Literature Cellulose SCWG - 5 C, 2 min This work Hao et al. W (g/cm3 ).5.8.7*.7 wt % 9. % 9.1% Material quartz 316 SS CO CO H CH Sum Gas yields are higher in steel reactor Could be unintentional catalysis by metal reactor wall from Resende et al., Energy & Fuels 21, 3637, 27; 22, 1328, 28
71 Conversion Increases with Temperature o C 27 o C o C f.5 EtOH:Oleic Acid =1: Time (min)
72 yields (mmol/g) Effect of Loading Water density =.8 g/ml yields (mmol/g) wt.% 9. wt.% 33.3 wt % 1 5. wt. % 8 9. wt.% wt.% 4 2 H2 CO CH4 CO2 H2 CO CH4 CO2 Cellulose (5 C, 1 min) Lignin (6 C, 75 minutes) from Resende et al., Energy & Fuels 21, 3637, 27; 22, 1328, 28
73 yields (mmol/g) yields (mmol/g) yields (mmol/g) yields (mmol/g) Making Predictions Effect of lignin loading (6 C, 9. wt %, 75 min): CO 2 4 wt % H wt % CO wt % CH wt %
74 yields (mmol/g) yields (mmol/g) yields (mmol/g) yields (mmol/g) Making Predictions Effect of water density (6 C, 9. wt %, 7.5 min): Water Density (g/ml) CO Water Density (g/ml) H Water Density (g/ml) Water Density (g/ml) CO 2 CH 4
75 molar % molar % molar % molar % Equilibrium Predictions Effect of lignin loading Equilibrium Predictions - CO ASPEN Model Equilibrium Predictions - H2 ASPEN Model lignin loading (w t %) 2 4 lignin loading (w t %) 6 Equilibrium Predictions - CO2 6 Equilibrium Predictions - CH ASPEN Model lignin loading (w t %) 2 1 ASPEN Model lignin loading (w t %)
76 molar % molar % molar % molar % Equilibrium Predictions Effect of water density Equilibrium yields - CO ASPEN Model Equilibrium yields - H w ater density (g/ml) 2 1 ASPEN Model w ater density (g/ml) 5 Equilibrium yields - CO2 5 Equilibrium yields - CH ASPEN 1 Model w ater density (g/ml) ASPEN Model w ater density (g/ml)
77 Drivers for Renewable Energy Energy supply - meet growing global demand Data from Energy Information Administration
78 Drivers for Renewable Energy Energy security - less reliance on imports Data from Energy Information Administration

79 Drivers for Renewable Energy Energy cost - keep prices low

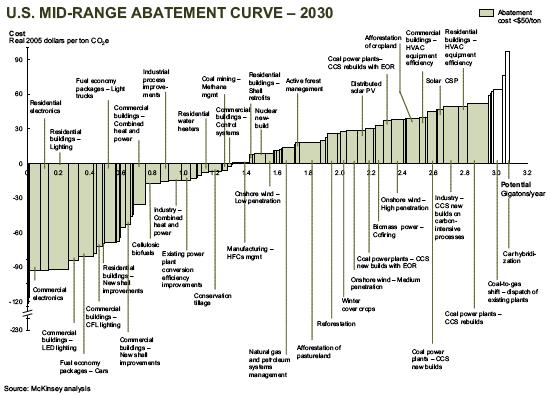
80 Drivers for Renewable Energy Climate change - reduce CO 2 emissions Slide from A. Yokochi - Oregon State Univ