Holistic Approach to Plant Optimization for Biosolids Management
|
|
|
- Susanna Fields
- 5 years ago
- Views:
Transcription


1 NC-AWWA_WE 2013 Holistic Approach to Plant Optimization for Biosolids Management April 30, 2015 Presenter: Ron Latimer, PE Co Author: Scott Hardy, PE

2 The F. Wayne Hill WRC is an advanced treatment facility located in Buford, Georgia.
3 Background F. Wayne Hill WRC Gwinnett County DWR 60 mgd capacity current average flow 33 mgd Also receives PS and WAS from Yellow River (22 mgd) Primary Treatment Biological Nutrient Removal High Level Tertiary Treatment Five 1 MG mesophillic anaerobic digesters Primary sludge and TWAS feed Parameter Units Monthly Avg. Limits Flow mgd 60 TSS mg/l 3 COD mg/l 18 Ammonia-N mg/l 0.4 Total Phosphorus mg/l 0.08 Turbidity ntu 0.5 Fecal #/100 2


4 FWHWRC Process Flow Diagram


5 Project Overview Holistic approach required to address multiple whole plant issues Capacity Issues: Influent loadings far exceeding design conditions PS and WAS from Yellow River (22 mgd) to be received New CHP system installed Digester gas was not where expected Poor primary clarifier performance High P recycle loadings and struvite problems
6 Capacity Crisis Consultant Your 60 mgd Plant is Really Only a 30 mgd Plant Capacity (mgd) Primary Clarifiers Individual Unit Process Capacity - Maximum Month With Yellow River Sludge Influent 44.0 Sampling Questioned Primary Clarifiers Not Working why? Can Optimization regain capacity? Bioreactors Secondary Clarifiers Blowers Unit Process / Scenario 50% PC Eff. 20% PC Eff TWAS Centrifuges Anaerobic Digesters
7 Annual Average Influent Characteristics Year BOD 5, mg/l Raw Influent Concentrations COD, mg/l TSS, mg/l NH3-N, mg/l , ,170 1, ,211 1,


8 Poor sample location and impacts from FOG/Grease buildup sloughing into sampler Raw Influent Flow Composite & Grab Sampling

9 Dynamic BioWin Calibration MLSS and WAS Model MLVSS/MLSS = 72.3% Actual MLVSS/MLSS = 72.4%
10 Modified sampling and whole plant BioWin calibration verified true influent loadings Parameter Original Design Historical Avg. (2005 to 2010) Recommended Values (After Data Reconciliation) Recommended Values Including YRWRF Sludge Actual 2014/2015 COD, mg/l 476 1, BOD 5, mg/l TSS, mg/l 230 1, If primaries work properly (50% TSS removal), liquids capacity maintained at 60 mgd Thickening and digestion still had short falls
11 Energy Recovery - BCE New 2,100 kw Combined Heat and Power System Meet 40% of Total Plant Electrical Demand Business Case Evaluation Annual Savings >$600,000 at Full Load (523 SCFM) Without NGS Blending: Break Even at 350 SCFM No NGS Blending

12 Digester Gas Production (SCFM) Where s The Digester Gas?!? MW Generator 523 SCFM Current Gas Production 175 scfm ,000 CF/MG 12,000 CF/MG Influent Flow (mgd)

13 Plant-Wide Optimization Focus Areas: Primary Clarifier Performance Solids from Yellow River WRF Primary sludge drives digester gas production Anaerobic Digesters Increase SRT for greater volatile solids destruction Co-Digestion FOG and high strength wastes
14 Primary Clarifier Performance was poor and highly variable % Removal Year Average Pri TSS % Removal 100% 80% Primary TSS Removal % % % 60% 40% 20% 0% % -20% -40% -60% -80% -100% Pri TSS Removal from Pri Inf (Load) 30 per. Mov. Avg. (Pri TSS Removal from Pri Inf (Load))

15 Poor primary clarifier performance was major concern for capacity and gas production Poor removals led to much higher loadings to the secondary system Major reduction in secondary treatment capacity Poor removals led to low digester gas production Major issue for new 2.1 MW CHP system for energy recovery


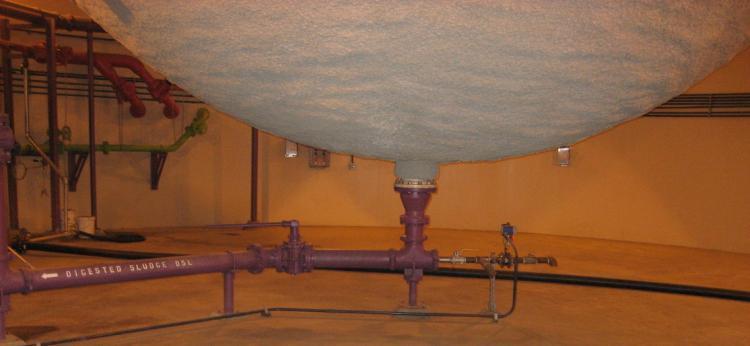
16 Reasons for PC Poor Performance Scum collectors had been reversed. Septic conditions Inlet hydraulics Scum baffle was removed

17 Requirement for in-tank thickening also led to non-optimal performance No separate thickening of primary sludge before digestion Design called for 4.5 to 5% primary sludge Attempts to achieve this led to high blankets, septic conditions and poor removal efficiencies Modified operations to limit thickness to < 3%


18 Canopy Baffle Further Improves PC Performance Primary Clarifier Primary 9 Baffle Installed % TSS Removal 48% Before Primary 10 As Is 31% After
19 New baffling and operational modifications resulted in substantial improvements % TSS Removal 100% End Phase 1 Sampling Event 75% 50% 25% 0% -25% -50% 7/8/09 8/7/09 9/6/09 10/6/09 11/5/09 12/5/09 1/4/10 2/3/10 Primary % TSS Removal 7 per. Mov. Avg. (Primary % TSS Removal)
20 Aug-08 Sep-08 Oct-08 Nov-08 Dec-08 Jan-09 Feb-09 Mar-09 Apr-09 May-09 Jun-09 Jul-09 Aug-09 Sep-09 Oct-09 Nov-09 Dec-09 Jan-10 Feb-10 Gas Flow (scfm) Loading (ppd) Increased Digester Gas Current Production ~ 300 to 400 scfm Digester Gas Production and Primary Sludge Loading ,000 45,000 40,000 35,000 30,000 25,000 20,000 15,000 10,000 5, Digester Gas Flow Digester Gas Flow - 30 Day Moving Average Primary Sludge Loading Primary Sludge Loading - 30 Day Moving Average

21 Co-thickening of primary sludge and WAS recommended to resolve short falls Co-thickening of primary sludge and WAS on rotary drum thickeners (RDTs) to 5.5%-6.5% Replaced high energy WAS only thickening centrifuges Synergy with optimizing primary clarifiers No more in tank thickening - dilute primary sludge Reduces septicity in primary clarifiers Deferred new digesters for 10+ yrs Increased Digester SRT > 15 Days


22 FOG and Food Waste for additional gas Bench Scale Digestion Performance Testing Teamed with Georgia Tech to assess critical elements of the proposed co-digestion Optimum FOG/high strength waste source Ultimate digestability Digestion rate Optimum wastewater VS:FOG VS ratio Gas production potential


23 FOG/HSW receiving was added to allow codigestion of select streams for gas production.

24 Co-Digestion with FOG and High Strength Organic Wastes Increase Digester Gas Production TPS and TWAS: 1.4 CF CH 4 /Gallon FOG: 2 CF CH 4 /Gallon HSW: 2 11 CF CH 4 /Gallon Tipping fee revenues Up to $500,000/yr Most recent 30kgal/d, $300,000/yr
25 Net Benefit ($/year) Increased Digester Gas Pays $1,400,000 $1,300,000 $1,200,000 $1,100,000 $1,000,000 $900,000 $800,000 $700,000 $600,000 $500,000 Assumptions: Power Cost = $0.05 /KWH NG Cost = $5.00 /MBTU DG Heat Content = 600 BTU/CF Electrical Output = MW Service = 8,000 hours/year Maintenance Cost = $22/hour REC = $10 / MWH w/ Digester Gas Initial Improve Primaries Yellow River WRF FOG/HSW $400,000 $300,000 $200,000 $100,000 $- $(100,000) $(200,000) Digester Gas Flow (SCFM) Gas Blend Without REC Gas Blend With REC Peak Cycle Without REC Peak Cycle - With REC

26 Actual Savings: 4 X BCE 5,552,745 kwhr Self Generated Power $2,000,000 Savings in Purchased Power with Real Time Power Structure and Engine Generator Average Power Cost: F. Wayne Hill WRC: $0.038 / kwh Yellow River WRF: $0.071 / kwhr Crooked Creek WRF: $0.069 / kwhr

27 Plant also struggled with struvite problems and high dewatering P recycle loads Enhanced biological P removal providing most of P removal Influent TP ~ 9 mg/l; effluent TP limit = 0.08 mg/l 5 mg/l alum dose, 10 mg/l tertiary ferric dose P released in anaerobic digestion Struvite and High P recycle
 2 in collection system")


28 Background Struvite & Phosphorus Issues 2009 Replaced Bioxide with Mg(OH) 2 in collection system Resulted in struvite formation in centrate lines, centrifuges, digester complex Accepting sludge from 22 mgd Yellow River Bio-P plant Substantial increase in P load Substantial risk for increased struvite formation
 Sludge cake (precipitated complex, biomass, struvite) ~ 40% of Influent P in sludge cake as struvite now If struvite formation stopped (stop")

29 Phosphorus in solids handling is the key issue Phosphorus outlets: Effluent (Limit TP = 0.08 mg/l) Sludge cake (precipitated complex, biomass, struvite) ~ 40% of Influent P in sludge cake as struvite now If struvite formation stopped (stop Mg), significant consequence from P recycle load; YR sludge Struvite taken from centrifuge Can Nutrient Recovery provide equivalent, controlled outlet for P? Alternative is metal salt Study goal: determine best solution for struvite issue (Mg continues) or P recycle issue (Mg stops) Nutrient Recovery OR metal salts Struvite crystals in dewatered cake sample


30 Six options were considered for sidestream P removal/struvite control Do Nothing Ferric addition with and without Mag addition in collection system Struvite recovery with and without WASStrip TM with and without Mag in collection system
31 Implementation of WASSTRIP concept at FWH takes advantage of co-thickening Release P and Mg from sludge using VFA rich stream Send P, Mg rich sidestream to recovery process Low P and Mg content of sludge minimizes nuisance struvite formation from digester onwards Send NH3 rich sidestream to recovery process


32 Bench scale testing of the WASSTRIP process was performed mg PO4-P/mg WAS VSS Determine levels and rates of PO 4 release from WAS Optimize parameters to maximize PO 4 release in pilot studies o Anaerobic retention time and WAS:PS blend ratio 2.0% 1.8% 1.6% 1.4% 1.2% 1.0% 0.8% 0.6% 0.4% 0.2% 0.0% Hours WAS ACE60 ACE400 BLEND25 BLEND50 BLEND100

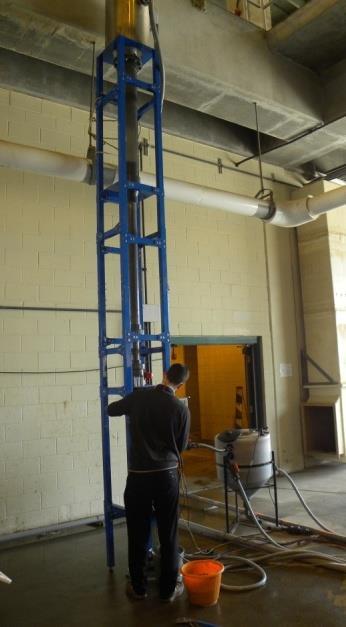
33 Ostara WASSTRIP Pilot

34 Ostara vs. Multiform product Ostara Pearl Multiform Harvest
35 Using the pilot data, Biowin process modeling was used to simulate each alternative 1. Use calibrated whole plant model to simulate alternatives at each flow scenario 2. Do Nothing scenario is modeled for comparison of struvite formation 3. The modeling results were used to assess effectiveness of the nutrient control strategy and also to estimate costs for the BCE. Raw INF Grit tank YR Sludge Grit BRB A1 BRB A2 BRB B1 BRB B2 BRB C1+C2 BRB C3+C4 BRB C5+C6BRB C7 BRB C8 Tertiary Clarifier Metal Salt Tertiary Caustic Influent (SV)7 P release Sec Scum Influent (SV)17 Combined Filter Effluen Anaerobic Digesters Bioreactor21 Dewatered Sludge Influent (SV)51 Bioreactor33 OSTARA struvite
36 PPD of Struvite in Sludge Cake P recovery provides equivalent struvite reduction compared with the ferric addition option 14,000 12, mgd 40 mgd 50 mgd 10,000 8,000 6,000 4,000 2,000 0 Do Nothing Ostara + WASSTRIP + Mag Ostara + WASSTRIP + No Mag Ostara Centrate No Mag Ferric Digesters Mag Ferric Centrate No Mag Scenario
 = $1.")
37 Nutrient Recovery + WASSTRIP Best option from BCE with < 8 year payback 2,200 gpd Ferric (39 lbfe/ Dry Ton sludge) = $1.1M/YR Sludge Savings = $160K/YR Blower Power Savings = $20K/YR Net revenue from sales = $147K/YR

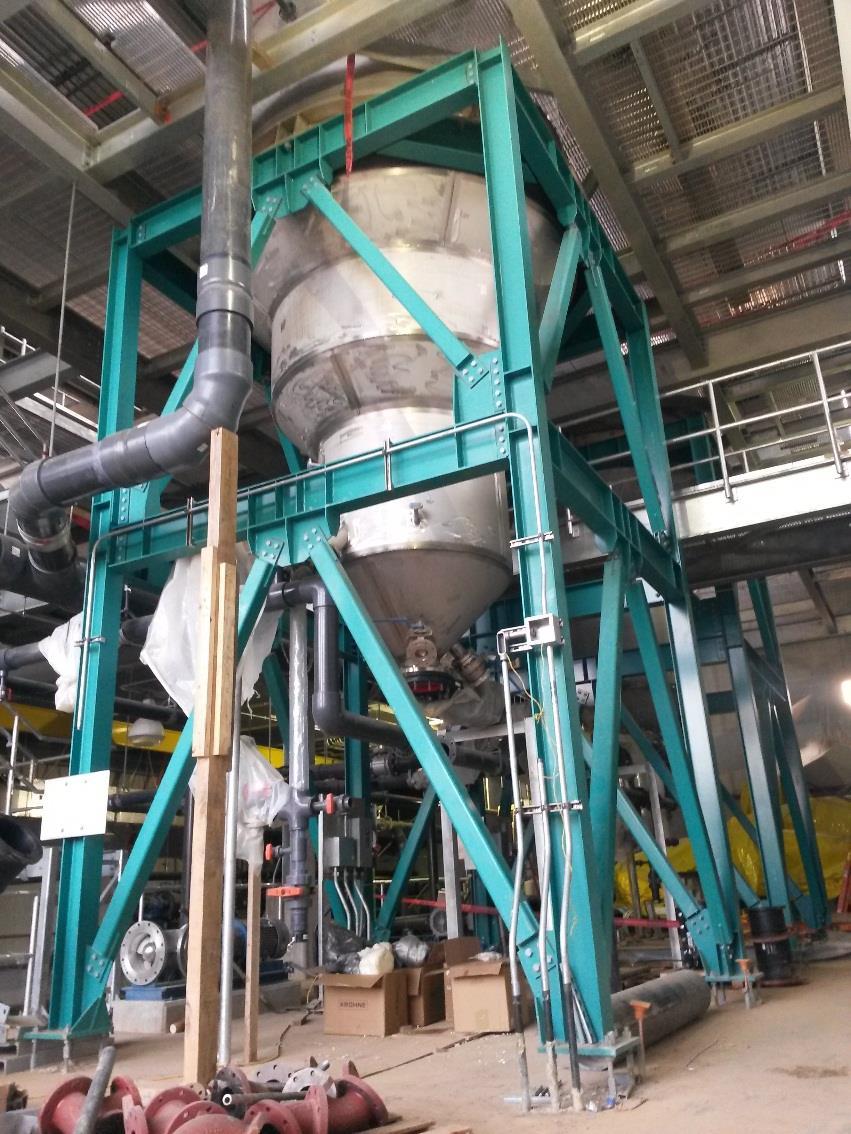
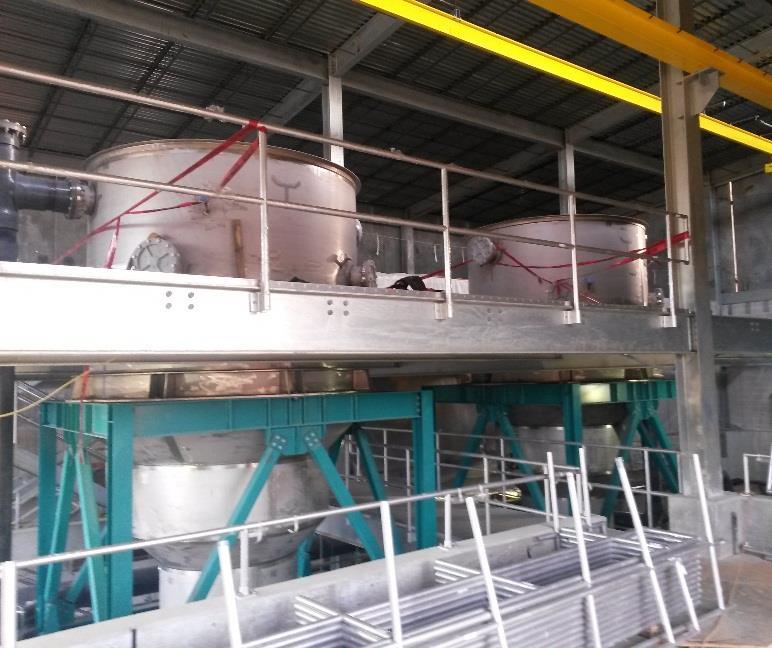
38 FWH Nutrient Recovery Facilities Startup June 2015


39 PD-Sw179 Water JAM 2010 Questions? Thank You! Ron Latimer 39