Joe Ewing Vice President, Investor Relations
|
|
|
- Elfreda White
- 5 years ago
- Views:
Transcription

1 Nitrogen s Role in U.S. Agriculture Presented by: Wall Street Access Ag Day New York, NY Joe Ewing Vice President, Investor Relations
2 Forward-Looking Statements This presentation may contain forward-looking statements, which involve inherent risks and uncertainties. Statements that are not historical facts, including statements about Terra Industries Inc. s beliefs, plans or expectations, are forward-looking statements. These statements are based on current plans, estimates and expectations. Actual results may differ materially from those projected in such forward-looking statements and therefore you should not place undue reliance on them. A non-exclusive list of the important factors that could cause actual results to differ materially from those in such forward-looking statements is set forth in Terra Industries Inc. s most recent report on Form 10-K and Terra Industries Inc. s other documents on file with the Securities and Exchange Commission. Terra Industries Inc. undertakes no obligation to publicly update or revise any forward-looking statement, whether as a result of new information, future developments or otherwise. 2
3 Today s Discussion Nitrogen basics: Manufacturing Markets and uses Transportation Natural gas: Global costs Outlook Global nitrogen supply/demand The trend from ammonia to UAN Non-ag nitrogen uses: Environmental Industrial 3
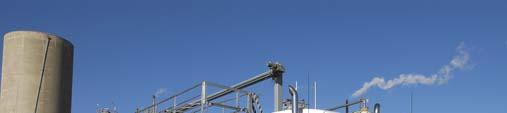
4 Nitrogen Manufacturing For ammonia production, three ingredients are processed under high temps and pressures in the presence of catalysts: Air Steam Natural gas Ammonia is sold as a finished product (merchant ammonia) or upgraded into other products (UAN, urea and AN) 4
5 Upgrading Process Merchant Ammonia (82% N) ANS Air Nitric Acid Ammonium Nitrate Solution AN (34% N) Natural Gas (33-34 MMBtu per ton of ammonia) Ammonia Production Vented/ Merchant CO 2 Nitric Acid Urea Liquor Urea Liquor Ammonium Nitrate Solution UAN 32 (32% N) Merchant Urea Liquor Granular Urea (46% N) 5
6 Nitrogen Markets and Uses Markets and uses: Agricultural Essential nutrient for corn, wheat, cotton and other crops Must be replenished each year Industrial Feedstock in chemical processes Used with catalysts to scrub emissions from power plants and in other processes Ingredient in cattle feeds ('000 nutrient tons) U.S. Nitrogen Use by Crop ,000 Corn Wheat Cotton Other 12,000 9,000 6,000 3, Fertilizer Year Ending June Source: USDA 6

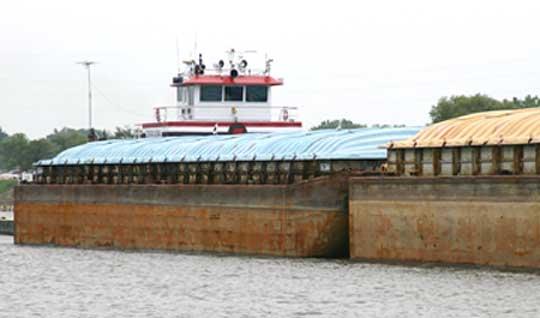
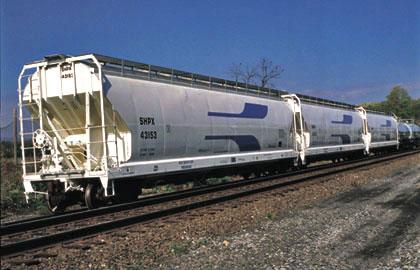
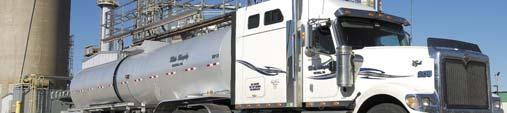


7 Nitrogen Product Distribution Pipeline Barge Mode used depends on the product, quantity moved, and distance traveled. Rail Truck 7


8 Global Overview of Natural Gas Along with other commodities, world natural gas prices have declined Beginning in Q2/09, Western Europe prices will begin to close on parity with North American prices Global LNG production will increase significantly in 2009, but projects are being delayed as demand has weakened due to the global recession U.S. natural gas production will continue to increase through Q2/09, then potentially flatten until the economy improves Natural Gas Costs from Around the World Ukraine 1 $6.25 Russia 1 Eastern Europe 1 $2.50 Western Europe 1 $7.00 United Kingdom 2 $7.40 $5.10 United States 2 $ average prices at current values and at respective pricing points. 1. Delivered 2. FOB 8
9 Domestic Outlook for Natural Gas Q1 2009: Onshore production up 2% YOY Storage levels started winter ~140 BCF above 5-year average Electrical generation and industrial demand weaker due to economy Entire energy sector trading lower Supply: Onshore production forecasted to increase 0.8 to 1.2 BCF YOY Offshore production up.8 BCFD as infrastructure damage is repaired LNG imports could pick up due to global economic outlook late Q1 Canadian imports flat to down as much as.5 BCFD YOY Effect of greenhouse gas reduction efforts: Could significantly increase demand as users switch from coal to gas Some effects are being felt as new coal facilities are being canceled or placed on hold Experts forecast moderating prices, less volatility in 2009 vs As prices remain below $7.00 Henry Hub base, production plans will continue to deteriorate, which will affect 2010 more than
10 World Ammonia Supply/Demand Balance % Global Demand and Capacity (Million Metric Tons) Demand Capacity Operating Rate 86% 85% 84% 83% 82% 81% 80% Operating Rates Source: Fertecon Ammonia Outlook

11 Global Nitrogen Fertilizer Consumption Source: Blue, Johnson 11
12 New Global Ammonia Capacity Source: Fertecon Location of New Ammonia Capacity Million TPY Ammonia China Middle East North Africa Caribbean U.S. Others China will account for almost 50% of all new Ammonia capacity between , adding 13.5 million tonnes per year. 12
13 Urea Supply/Demand Balance High Case World Urea Position with Likely Projects World Capacity '000t % Op Rate % Op Rate % pa Capacity Cons Source: Profercy 13
14 U.S. Agricultural Ammonia Use is Declining U.S. rail carriers continue to raise shipping rates for ammonia due to insurance carrier concerns Environmental backlash against nitrate levels in watershed areas is leading to pressure to restrict ammonia use 14
15 Why UAN is Gaining Market Share from Ammonia Fewer growers are planting more corn Old: 75 million acres New: 87 million acres Growers like to have their crop in the ground before mid-may to achieve optimal yields Application window is compressed, favoring UAN over ammonia Weather and soil conditions must be just right for ammonia UAN is faster and more flexible Custom applicator can cover more ground Can also be applied with other crop inputs 15
16 UAN Commands a Premium over Ammonia Nitrogen Price Spread to Present $0.24 $0.22 $0.20 $0.18 $0.16 $0.14 $0.12 $0.10 $0.08 $ Jan-06 Feb-06 Mar-06 Apr-06 May-06 Jun-06 Jul-06 Aug-06 Sep-06 Oct-06 Nov-06 Dec-06 Jan-07 Feb-07 Mar-07 Apr-07 May-07 Jun-07 Jul-07 Aug-07 Sep-07 Oct-07 Nov-07 Dec-07 Jan-08 Feb-08 Mar-08 Apr-08 May-08 Jun-08 Jul-08 Aug-08 Sep-08 Oct-08 Nov-08 Dec-08 Jan-09 Feb-09 Green Markets' published mid-cornbelt prices Price difference per pound of N
17 The UAN Challenge Fall ammonia application was significantly lower than normal in key Cornbelt states. 800,000 tons of missed ammonia application = 2 million tons of UAN needed this spring Moving even an additional 1 million tons of UAN would require full utilization of distribution systems beginning in January This is approximately a 10% increase in demand for UAN Delayed product placement will hinder the ability to move needed tons of UAN this spring 17
18 U.S. Nitrogen Demand Segments Total U.S. nitrogen demand ranges between 19.5 and 21.0 million tons annually Agricultural demand averages approximately 12.1 million tons Industrial demand averages approximately 6 million tons Agricultural Industrial 18
19 Industrial and Environmental Nitrogen Demand The economic slowdown will result in lower nitrogen demand for industrial use: In 2009, global industrial ammonia demand is forecasted to be down 10-15% Industrial demand accounts for approximately 25% of total U.S. nitrogen demand This reduction will come from chemical intermediate industries (nylons, acrylics and metal mining) Environmental demand will increase 19


20 Environmental Nitrogen Demand Year-round demand to stationary power plants Emerging diesel exhaust fluid (DEF) markets 20
21 Nitrogen Demand Remains Strong During Biofuels Boom After Biofuels Boom 29% 71% 31% 69% Ag Industrial Ag Industrial If the Energy Independence and Security Act (EISA) and federal biofuel tax credits were rescinded, it would only reduce agricultural demand for nitrogen by 2% annually between * Terra estimates that over the same time period industrial demand for nitrogen will grow by a minimum of 2% annually, effectively mitigating any negative impacts felt by the reduced biofuel production. * Based on FAPRI s 2008 Agricultural Outlook, 2007 Study on the effects of EISA, and Terra s Internal Modeling 21
22 Nitrogen s Role in U.S. Agriculture Presented by: Wall Street Access Ag Day New York, NY Joe Ewing Vice President, Investor Relations