WATER QUALITY ISSUES in SWM. By Sudhakar M. Rao. IISc Bangalore
|
|
|
- Bertha Day
- 5 years ago
- Views:
Transcription
1 WATER QUALITY ISSUES in SWM By Sudhakar M. Rao IISc Bangalore
2 Introduction Two third of Our planet earth is water. But 97% is saline.out of the balance 3%, 2.1% is trapped into Glaciers and deep sea. Only 0.7% fresh water is available for human consumption Why Water is so Important? Universal solvent so essential component for - Domestic Applications - Agricultural Applications - Industrial Applications - Propagation of life particularly aquatic life and plants For the each application water requires a defined quality.
3 Water Resources In India Total Water Availability 1869 BCM Surface Water Availability 690 BCM 14 Major River Basins Ground Water Availability 432 BCM 68% remains untapped Sudhakar Rao-IISc
4 Replenishable Ground Water Resource 432 BCM Domestic & Industrial use 70 BCM Agriculture 330 BCM Sudhakar Rao-IISc
5 Water Quality Issues Water Quality stresses: - Natural sources - Anthropogenic Sources Fluoride, arsenic, iron are examples of contamination from natural sources Anthropogenic sources causes much more stress in a very wide range of parameters and to a large magnitude
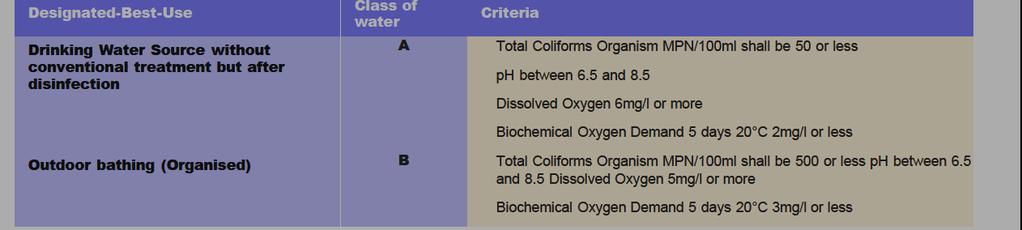
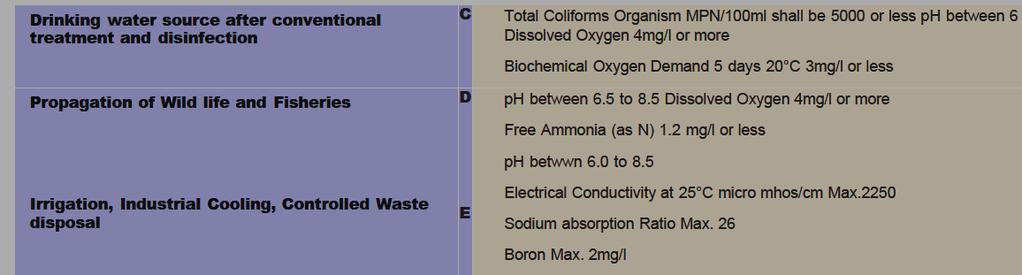
6 Water quality issues: Domestic Applications: In domestic applications water is used for - drinking, - bathing, - washing, - waste disposal etc. Quality Norms have been prescribed for each application. Why Not to maintain Best Quality? Lot of efforts and cost is involved in maintaining the water quality for each application
7 Water quality issues: Industrial Applications: In Process as solvent or as additive For fermentation As steam for heating applications in Boilers For cooling For cleaning operations For waste transport & disposal There is a scope for recycling the water for many downstream quality applications and finally for reuse for horticulture etc.
8 Water quality issues: Agricutural/ Rural Applications: - For land preparation - Irrigation - For applying fertilizers and pesticides - Livestock rearing The important water quality parameters are salinity (TDS), SAR. Also pesticides and heavy metals if accumulate may go to food chain
9 Water Quality Issues Life Propagation: For aquatic life for respiration For Plants for transport of food materials For microbial population for growth Dissolved Oxygen is the most important parameter for life propagation Toxic materials could also be fatal for survival
10 Threats to water Quality Microbiological pollution, Organic pollution, salinity, Heavy metal pollution, Pollution by toxic inorganic compounds (Nitrate, Nitrite, Fluoride, Phosphates, Sulphides) Pollution by Toxic organics like phenols, AOx, PAH Thermal pollution
11 Quality deterioration Domestic pollution Agricultural pollution Industrial pollution Geogenic contamination Arsenic Disposal of wastes, leaching of sewer materials,e Leaching of nutrients, pesticides, fertilisers, etc. Disposal of effluents in streams or on land Fluoride Iron Nitrate Salinity Sudhakar Rao-IISc

12 Issues Impacting SWM in Indian Context: Water Quality Issues Catchment-Degradation Gender and Class Surface water Groundwater
13 Most important causes of Water Pollution are: (a) Unplanned development without adequate attention to sewage and waste disposal. (b) Industrialization without provision of proper treatment and disposal wastes and affluent. (c) Excessive application of fertilizers for agricultural development. (d) Over-irrigation intrusion due to excessive pumping of fresh water in coastal aquifers. This overexploitation mainly accounts for seawater intrusion.
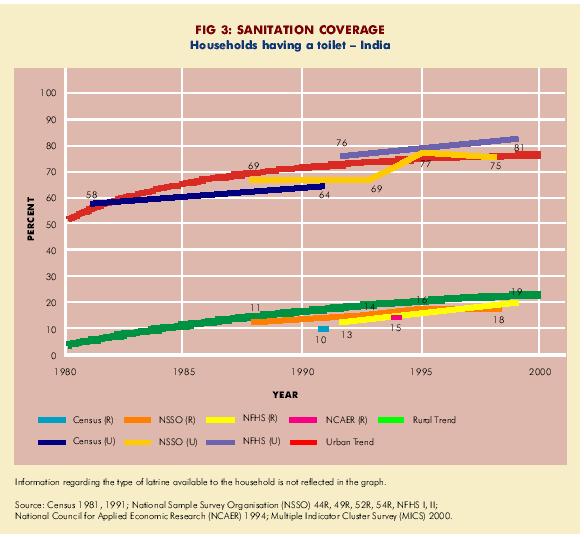
14 Domestic Pollution % of rural and % of urban inhabitants have access to adequate sanitation facilities (WRI 2000). Organized sewerage systems range from 35 % in class IV cities to 75 % in class I cities Of the total wastewater generated in metro cities, barely 30 % is treated before disposal. Significant increase in MSW generation. Per capita MSW generation ranges from 100 g in small towns to 500 g in large towns Annual production of solid waste in India has been estimated at 2,000 million tons (MOWR 2000).
15 Industrial Pollution Industrial sector accounts for 3% of the annual water withdrawals in India- contribution to water pollution, particularly in urban areas, is considerable. Wastewater generation from this sector estimated at 55,000 million m 3 per day, of which 68.5 million m 3 are dumped directly into local rivers and streams without prior treatment (MOWR 2000). Agro based industries, Distilleries, Sugar mills and Paper mills - Organic pollution Chemical industries, steel plants, pharmaceuticals and tanneries etc TDS and Toxic chemicals Lack of cost-effective technologies to treat certain wastewater types - containing high organic load/dissolved solids and chemicals like lignin, phenols, cyanides, pesticides, PAH, PCB etc. or toxic substances which are not easily degradable is impacting their treatment
16 Groundwater Overuse and Contamination Groundwater accounts for over 80% of the rural domestic water supply and 45% of the irrigation water supply in India (World Bank 1999, MOWR 2000). Currently over 10% of blocks classified by the Central Groundwater Board have been identified as being overexploited and blocks where exploitation is beyond the critical level have been increasing at a rate of 5.5% each year (World Bank 1999).
17 Nature of quality problem Number of affected habitations Approximate population at risk (million) Affected regions Excess Arsenic ( mg/l) Excess Fluoride ( mg/l) Excess Iron (1-20mg/L) Excess Nitrate ( mg/l) Excess Salinity (Inland and coastal) ( mg/l) Other reasons (Heavy metals, Pesticides, Fertilizers, etc.) 5, blocks of 8 districts (Bardhaman, Hoogli, Howrah, Malda, Murshidabad, Nadia, North and South 24 Parganas) of West Bengal, parts of Bhojpur and Patna districts of Bihar and Ballia district of Uttar Pradesh, parts of Rajnandgaon district of Chhattisgarh and parts of Assam 36, (a) Kerala, Jammu & Kashmir, West Bengal, Orissa, Assam, Bihar and Delhi with less than 30 per cent of the districts affected. (b) Punjab, Haryana, Madhya Pradesh, Karnataka, Uttar Pradesh, Tamil Nadu, Chattisgarh and Maharashtra with per cent of the districts affected. (c) Rajasthan, Gujarat and Andhra Pradesh with per cent of the districts affected. 1,38,670 - Prevalent mostly in hilly regions, parts of Assam, Agartala, Bihar, Orissa, Rajasthan, Tripura, West Bengal, Uttar Pradesh, Punjab, Maharashtra, Madhya Pradesh, Chhattisgarh, Jharkhand, Tamilnadu and Kerala. 13, Parts of Uttar Pradesh, West Bengal, Rajasthan, Madhya Pradesh, Chandigarh, Punjab, Haryana, Delhi, Bihar, Maharashtra, Karnataka, Kerala, Orissa, Jammu & Kashmir, Himachal Pradesh, Gujarat, Tamil Nadu and Andhra Pradesh 32,597 - Inland salinity: Inland salinity in ground water is caused due to geogenic sources. The problem of inland salinity has been observed in arid and semi arid regions of Rajasthan, Haryana, Punjab, and Gujarat with limited extent in the states of Uttar Pradesh, Delhi, Karnataka, Maharashtra, Madhya Pradesh and Tamilnadu. Electrical conductivity in these areas exceeds 4000 micro Siemens/ cm. Coastal salinity: Problem of coastal salinity in ground water that is caused due to excessive exploitation of ground water has been observed in Mangrol - Chorwad areas and Coastal Saurashtra of Gujarat, Minjur area in Tamilnadu, Pondicherry coast, parts of Orissa, Andhra Pradesh and Kerala coast. 25,092 - Parts of Andhra Pradesh, Assam, Bihar, Goa, Gujarat, Haryana, Himachal Pradesh, Karnataka, Kerala, Madhya Pradesh, Maharashtra, Meghalaya, Orissa, Punjab, Rajasthan, Tamil Nadu, Uttar Pradesh, West Bengal and NCT of Delhi
18 Surface water issues (river, pond, tanks, lakes etc) Change in physical characteristics (turbidity, TSS, temperature) Toxic pollutants (organics, recalcitrant materials, heavy metals) Point sources Diffuse sources Atmospheric transport and deposition
19 BOD :Unpolluted natural waters < 5 mg/l BOD. Dissolved Oxygen DO levels < 3 ppm are stressful to most aquatic organisms. DO levels < 2 ppm will not support fish. DO = 5-6 ppm is required for growth and activity of most aquatic organisms. Faecal Coliforms: Drinking water-must be absent
20
21
22 PATHOGENIC MICRO-ORGANISMS Analysis: Coliform bacteria is an indicator of faecal pollution Present in large numbers in faeces of healthy & sick individuals Easily determined in laboratories Expressed as most probable number: MPN/100mL

23 GROUNDWATER POLLUTION Fluoride pollution Nitrate pollution Indiscriminate disposal of sewage and garbage Salt water intrusion Arsenic pollution
24 CRITICAL PARAMETERS Nitrate > 45 mg/l - Leads to cancer, and Blue Baby Syndrome Fluoride> 1.5 mg/l - Leads to Dental fluorosis, skeletal fluorosis T H > 600 mg/l - Effects on domestic use T D S > 2000 mg/l - Causes gastro intestinal irritation Iron > 1.0 mg/l - Promotes iron bacteria
25 Impacts of Urbanization High organic pollution from huge quantity of treated/untreated Sewage depletes oxygen from water bodies. Microbial pollution- water becomes unfit for human consumption particularly potable use Indiscriminate dumping of domestic solid wastesgenerates a) leachate- affects ground water quality b) run off - affects surface water quality. Biomedical waste from hospitals causes microbial pollution Increasing urbanization have induced extraction of more quantity of ground water and may be one of the reasons for earth quake.
26 Impacts of Industrialization Water bodies are getting contaminated with toxic organics/ inorganics Toxic metals gets bioaccumulation and enters into food chain Persistent organic matter causes severe diseases. Many of them are carcinogenic High organic matter causes depletion of oxygen from water bodies High TDS causes salinity of soil and make it unfit for agriculture
27 Industrial activities as issues Pharmaceuticals High COD and TDS Pesticides Persistent Organic compounds, High COD and TDS Chemical Manufacturing Industries High TDS, COD, Toxic metals Textile industries Toxic dyes and high TDS Tanneries Chromium, BOD, COD, TDS Paper and Pulp Industries Colour, BOD and AOX Distilleries Color, BOD and TDS Petroleum refineries Oil and Grease Chlor- alkali industry Hg, Chlorine and high TDS
28 Impact of Agricultural activities Utilization of Chemical Fertilizers (like urea, DAP, potash salts)- High N and P contents lead to eutropication followed by turbidity in lake and waterbodies Utilization of Pesticides(organo-chlorine and organo-phosphorous compounds) contaminate the aquatic system. The pesticides, herbicides and insecticides applied are highly persistent in nature.
29 Areas of Focus Water Quality Impact of geogenic stresses on groundwater bodies Impact of anthropogenic stresses on ground water bodies Groundwater Contamination (Drinking water) Geogenic sources; Arsenic, Fluoride, Iron & Salinity Anthropogenic sources:nitrates, Pesticides, Organics, Heavy metals, Microbial contamination
30 Why is fluoride in drinking water an environmental problem? Introduction High levels of fluoride in drinking water ( > 1.5 mg/l ) leads to dental and skeletal fluorosis. Problem is severe where ground water is the major source of drinking water. Indian standard specifies ( IS 10500: 1991) desirable and permissible limits of fluoride in drinking water as 1.0 and 1.5 mg/l. Sudhakar Rao-IISc
31 Toxicity of fluoride compared to lead and arsenic Introduction Relative toxicity Lead Fluoride Arsenic Fluorine is a colorless and odorless natural pollutant 5 Extremely toxic 4 Very toxic 3 Moderately toxic 2 Slightly toxic 1 Practically nontoxic Based on LD50 data from Robert E. Gosselin et al, Clinical Toxicology of Commercial Products 5th ed., 1984 Sudhakar Rao-IISc
32 Sudhakar Rao-IISc Health Effects
33 Health Effects Health impacts from long term use of fluoride bearing water : 1.5 to 4.0 mg/l Dental Fluorosis > 4.0 mg/l Dental and skeletal fluorosis > 10 mg/l crippling fluorosis Sudhakar Rao-IISc

34 Sudhakar Rao-IISc Health Effects

35 Sudhakar Rao-IISc Health Effects

36 Sudhakar Rao-IISc Health Effects

37 Health Effects Sudhakar Rao-IISc
38 Occurrence in Ground Water Sudhakar Rao-IISc
39 Occurrence in GW Fluorides in ground water derives mainly from dissolution of natural minerals in the rocks and soils with which water interacts. Most common fluoride bearing minerals are Fluorspar / Calcium fluoride (CaF 2 ) Apatite / Rock phosphate [Ca 5 F (PO 4 ) 3 ] Cryolite / Sodium aluminum fluoride (Na 3 AlF 6 ) Dominant factors influencing fluoride build up in water are : Geology, contact time with fluoride minerals, ground water chemical composition and climate. Sudhakar Rao-IISc
40 Occurrence in GW Areas endemic to fluorosis in India Endemic fluorosis is a public problem in India Almost million people drink fluoridecontaminated groundwater. The number affected by fluorosis is estimated at million % affected % affected % affected Sudhakar Rao-IISc
41 Occurrence in GW According to latest information at least 20 states of India, including the new creations Uttaranchal, Jharkhand and Chattisgarh are endemic to fluorosis. Andhra Pradesh, Gujarat, Rajasthan % districts are affected Bihar, Punjab, Haryana, Karnataka, Maharashtra, Madhya Pradesh, Tamil Nadu, Uttar Pradesh, some parts of Delhi % districts are affected Assam, Kerala, Orissa, West Bengal, Jammu & Kashmir % districts are affected Sudhakar Rao-IISc

42 Percent Occurrence in GW Fluoride concentration in 15 districts of Karnataka Fluoride concentration (mg/l) Sudhakar Rao-IISc
43 GW Chemistry
44 GW Chemistry
45 GW Chemistry
46 Mamatha & Rao, 2009, Env. Earth Sci Tumkur
47 Kolar
48 Anthropogenic Contamination of GW resources
49 Unplanned urban development without adequate attention to sewage and waste disposal. (b) Industrialization without provision of proper treatment and disposal wastes and affluent. (c) Excessive application of fertilizers for agricultural development. (d) Over-irrigation intrusion due to excessive pumping of fresh water in coastal aquifers. This over-exploitation mainly accounts for seawater intrusion.
50 General Background Pollution-Sewage % of rural and % of urban inhabitants have access to adequate sanitation facilities (WRI 2000). Organized sewerage systems range from 35 % in class IV cities to 75 % in class I cities Of the total wastewater generated in metro cities, barely 30 % is treated before disposal.
51 General Background
52
53
54
55
56 Nitrate, ppm Drinking water classification Inner town series, Nitrate Permissible limit = 45 ppm M-114 M-115 M-116 M-117 M-118 M M M-121 M-122 M-123 M-124 M M-226 M-227 M-228 M-229 M-230 M-231 M- 233 M-234 M-235 M-236 M-244 M-245 M-300 Location M-312 M-313 M-314 M-400 M-401 M-402 M M-404 M-405 M-406 M-407 M-408 M-410 M-411 M-412 M-413 M-414 M- 415 M-417 M-419 M-421 M-422
57
58
59
60
61
62 Remedies for the issues Sustainable development Adopting waste minimization (Conserve, Recycle and Reuse) Cleaner technologies in industrial sectors Biofarming i.e. Applications of bio-fertilizers and biopestcides) in place of chemical fertilizers and pesticides. Scientific management of hazardous wastes and following environmentally sound recycling like lead from Batteries, Oil from Used/waste Oil.

63