EPANET. Ivan Solinas
|
|
|
- Malcolm Allison
- 5 years ago
- Views:
Transcription

1 EPANET Ivan Solinas
2 The Irrigation Questions How to irrigate How much to irrigate When to Irrigate Pressurized pipe network
3 What is EPANET EPANET is a computer program that performs extended period simulation of hydraulic and water quality behavior within pressurized pipe networks. A network consists of pipes, nodes (pipe junctions), pumps, valves and storage tanks or reservoirs. EPANET tracks the flow of water in each pipe, the pressure at each node, the height of water in each tank, Also EPANET track the concentration of a chemical species throughout the network during a simulation period comprised of multiple time steps
4 WHO DEVELOPED IT?
5 Hydraulic Modeling Capabilities EPANET contains a state-of-the-art hydraulic analysis engine that includes the following capabilities: places no limit on the size of the network that can be analyzed computes friction headloss using the Hazen- Williams, Darcy-Weisbach, or Chezy-Manning formulas includes minor head losses for bends, fittings, etc. models constant or variable speed pumps computes pumping energy and cost
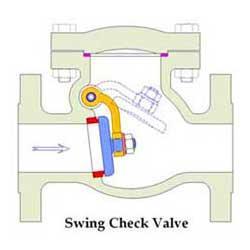
6 Hydraulic Modeling Capabilities models various types of valves including shutoff, check, pressure regulating, and flow control valves allows storage tanks to have any shape (diameter can vary with height) models pressure-dependent flow issuing from emitters (sprinkler heads) can base system operation on both simple tank level or timer controls and on complex rule-based controls.
7 Steps in Using EPANET One typically carries out the following steps when using EPANET to model a water distribution system: 1. Preliminary setting 2. Draw a network representation of your distribution system 3. Edit the properties of the objects that make up the system 4. Describe how the system is operated 5. Select a set of analysis options 6. Run a hydraulic analysis 7. View the results of the analysis

8 Preliminary setting select File >> New to create a new project Project >> Defaults

9 Preliminary setting Select View >> Options

10 Preliminary setting Select View >> Dimensions to bring up the Map Dimensions dialog
11 STEP 2 - Drawing the Network 1. First we will add the reservoir. Click the Reservoir button 1. Next we will add the junction nodes.
12 Drawing the Network
13 Drawing the Network add the pipes add the pump.
14 Drawing the Network Label the reservoir, pump Type in the word SOURCE; PUMP;
15 Setting Object Properties Double click on the object

16 Setting reservoir Properties Total head: 0

17 Setting pump Properties Pump curve: 2

18 Pump curve
19 Flow unit

20 Setting Junction Properties

21 Setting pipe Properties
22
23
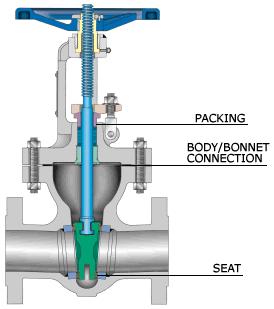
24 View the nodes pressure Select Node Pressure from the Browser s Map page and observe how pressure values at the nodes become color-coded. To view the legend for the color-coding, select View >> Legends >> Node (or rightclick on an empty portion of the map and select Node Legend
25 Flow of the pipe Note that flows with negative signs means that the flow is in the opposite direction to the direction in which the pipe was drawn initially
26 Emitters Emitters are devices associated with junctions that model the flow through a nozzle or orifice that discharges to the atmosphere. The flow rate through the emitter varies as a function of the pressure available at the node: q = C H^g where q = flow rate, H = pressure, C = discharge coefficient, and g = pressure exponent. For nozzles and sprinkler heads g equals 0.5 and the manufacturer usually provides the value of the
27 The Hazen-Williams formula is the most commonly used headloss formula in the US. It cannot be used for liquids other than water and was originally developed for turbulent flow only. The Darcy-Weisbach formula is the most theoretically correct. It applies over all flow regimes and to all liquids. The Chezy-Manning formula is more commonly used for open channel flow.
28
29 Minor Losses (also called local losses) Minor head losses are caused by the added turbulence that occurs at bends and fittings. The importance of including such losses depends on the layout of the network and the degree of accuracy required.

30
31 Valves Valves are links that limit the pressure or flow at a specific point in the network. Their principal input parameters include: start and end nodes diameter setting status. The computed outputs for a valve are flow rate and headloss. The different types of valves included in EPANET are: Pressure Reducing Valve (PRV) Pressure Sustaining Valve (PSV) Pressure Breaker Valve (PBV) Flow Control Valve (FCV) Throttle Control Valve (TCV) General Purpose Valve (GPV).