California League of Cities Briefing on Water Supply Issues
|
|
|
- Allan Joseph
- 5 years ago
- Views:
Transcription
1 California League of Cities Briefing on Water Supply Issues Stephen N. Arakawa Manager, Bay-Delta Initiatives The Metropolitan Water District of Southern California May 5, 2016
2 California WaterFix: Securing Water Supplies for California Enhances supply reliability and Delta ecosystem Supports Southern California s local resources Modernizes the State Water Project and addresses flaws since its creation Protects billions of dollars of past investments made by Southern California 2

3 Metropolitan Water District Regional water wholesaler 26 Member Agencies 6 counties Serving ~19 million residents 5,200 square mile service area $1 trillion economy 3 3

4 Bay-Delta: Critical Component of Metropolitan s Diverse Water Supplies Some regions 100% dependent on Bay-Delta supplies Bay Area 33% State Water Project Central Coast 37% Metropolitan 30% Conservation, Local Groundwater, Recycling and Desalination Bay-Delta Los Angeles Aqueduct Central Valley 23 to 90% Colorado River Aqueduct Southern California Water Portfolio 25% Colorado River 30% State Water Project (through the Delta) 45% Local Supplies Los Angeles Aqueduct Conservation Groundwater Recycling Desalination 4
 State Water Project (33%) Colorado River Aqueduct (26%) Conservation &")
 2035 64% Local Emphasis on")
5 MWD Water Resource Strategy Supply/Demand Management 1990 vs Conservation & Recycling (7%) State Water Project (33%) Colorado River Aqueduct (26%) Conservation & Recycling (33%) State Water Project (22%) Colorado River Aqueduct (14%) Local Surface/Groundwater (34%) % Local Heavy dependence on imported supplies Local Surface/Groundwater (31%) % Local Emphasis on conservation, recycling, desalination and local supplies 5


6 State Water Project: Supports Development of Local Supplies Southern California s local supplies depend on water quality benefits of State Project water: Blending impaired supplies Maximizing recycled water opportunities Groundwater replenishment and recovery Conservation Garden Recycled Water Groundwater Recharge 6


7 Northern Sierra April Snow Survey April 2015: 5% April 2016: 94%


8 North Fairing Better than South OCTOBER 2015 April 2016 Improvement Some Improvement No Improvement ABNORMAL MODERATE SEVERE EXTREME EXCEPTIONAL

9 6.0 Million Acre-Feet x Increase in Capacity

10 Storage Reserves Buffer Drought Impacts End of Year Balances 5 4 Million Acre-Feet ? Emergency Storage Dry-Year Storage


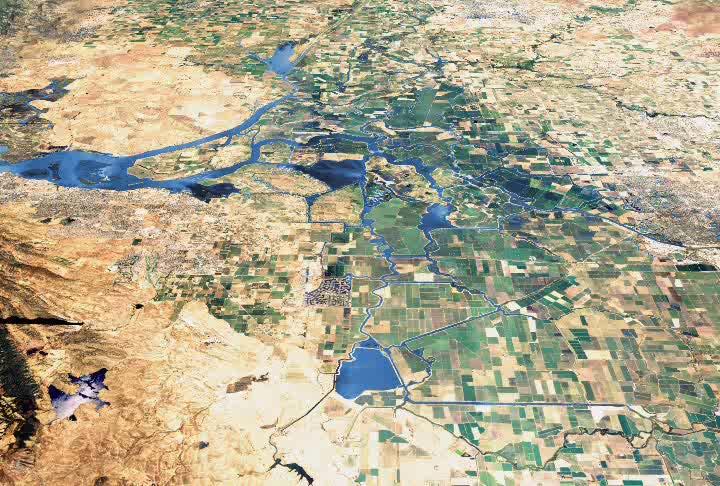
11 Sacramento/San Joaquin Bay-Delta Sacramento River/ West Delta Sacramento River Sacramento Stockton SWP Pumps San Joaquin River CVP Pumps 11

 Time Period: 1990-2005 Estimated total annual runoff")
12 Water Flowing from the Delta Watershed In-Delta Consumptive Use 4% Upstream Consumptive Use 31% Pacific Ocean 48% Delta Exports 17% Metropolitan 4% Source: Delta Vision Report (2007) Time Period: Estimated total annual runoff maf 12
13 State s Proposal Another Step Forward Protects State s water supplies through Delta system upgrades Dual tunnel facilities and mitigation Water user funded Supports long-term health of native fish & wildlife Habitat restoration ~ 30,000 acres in 5 years Requires broader public funding 13 13


14 California WaterFix: Improved Water Delivery North Delta Modern intake screens allow fish to bypass without diversion Flexibility to divert excess flood flows & reduce fish impacts during low flow periods Additional Intakes Tunnels SWP Pumps CVP Pumps South Delta Reduces reverse flows in river Less fish diversion at pumps 14 14


15 2016 Storm Events 80,000 70,000 60,000 50,000 40,000 30,000 20,000 Sacramento River Storm #1 (21-day analysis) 1,622,000 AF Sacramento River 78,000 AF to State Water Project 10,000 Flow (cfs) - SWP Pumping ~ 1,500 2,000 cfs 1/6 1/13 1/20 1/27 2/3 2/10 2/17 2/24 3/2 January February March
16 Metropolitan Water Sales* 2.5 Actual Sales Long Term Average Sales Projection Million Acre-Feet * Includes Exchange Fiscal Year Ending


")
 San")


17 Sacramento River 100 mg/l California WaterFix Improved Water Quality Would Help Local Supply and Management SWP (Existing) 302 mg/l SWP (CA Water Fix) 221 mg/l (27% improvement) San Joaquin River 320 mg/l Colorado River 650 mg/l Sacramento, San Joaquin & Colorado River water quality represents historical average annual recorded data State Water Project water quality is comparison of modeled data from the Recirculated Draft EIR/EIS 17

18 Modernizing the State Water Project Water security Improved reliability Seismic safety Environmental protection Climate change adaptation Designed to meet the state s mandated co-equal policy goals Improved reliability Ecosystem restoration 18
19 19
20 California WaterFix Updated Cost Analysis Tunnels/Pipeline Capital $15.0 billion Operations/Maintenance/Mitigation /Monitoring $2.5 billion (50 years) Total $17.5 billion Cost Paid by water users ~$5/month/house (urban) Estimated costs from DWR; in undiscounted 2014 dollars with a 36% contingency Metropolitan s share is approximately 25%-30% 20

21 Future Resource Development Costs Supply Cost ($/AF) $8,000 $7,000 $6,000 $5,000 $4,000 $3,000 $2,000 $12,000/AF MWD 2016 Tier 1 Treated (with California Water Fix) ~$1,089 to $1,118/acre-feet $1,000 $0 Stormwater Centralized Stormwater Distributed Groundwater Recovery Recycled Water Seawater Desalination * 2015 IRP Update local supply cost analysis as of November 2015, in 2015 dollars


22 Time for Action Need to modernize Unsustainable system Infrastructure Ecosystem Changing regulations Changing environment Protect Investments SWP Storage DVL/Inland Feeder Treatment Processes Local supplies Can t afford to delay Stephen N. Arakawa sarakawa@mwdh2o.com mwdh2o.com 22


23 Delta: Hub of California s Water Supply Supplies 25 million Californians with State Project water Provides irrigation for much of the produce grown domestically 57 Islands and Tracts 700 miles of sloughs and channels 1,100 miles of levees 23
24 Water Investment Projects Project Cost Population Served Per capita cost SFPUC s Hetch Hetchy Project $4,600,000,000 2,500,000 $1,840 SWP Coastal Aqueduct and CCWA Project $575,000, ,000 $1,337 CCWD Los Vaqueros Project $570,000, ,000 $1,036 BDCP Conveyance Tunnels (BDCP August 2015) 14,900,000,000 25,000,000 $596 SDCWA Emergency Storage Project $1,500,000,000 2,800,000 $536 EBMUD Freeport Project $517,000,000 1,300,000 $398 Diamond Valley Lake/Inland Feeder $3,100,000,000 18,000,000 $172 BDCP Economic Benefits and Financial Strategies, SCWC/The PFM Group, February


25 Metropolitan Board 2016: Anticipated Decisions Supported planning process-no formal action taken yet Reviewing Technical, legal and financial analysis Overall Process Fall 2016 Final EIR/S Review Endangered Species Permits 25
26 2016 Storm Events 80,000 70,000 60,000 50,000 40,000 30,000 20,000 Sacramento River Storm #1 (21-day analysis) 1,622,000 AF Sacramento River 78,000 AF to State Water Project 10,000 Flow (cfs) - SWP Pumping ~ 1,500 2,000 cfs 1/6 1/13 1/20 1/27 2/3 2/10 2/17 2/24 3/2 January February March