Use of MSC in Sanitary Wastewater System Assessments of Canadian Shellfish Areas
|
|
|
- Warren Woods
- 5 years ago
- Views:
Transcription


1 Use of MSC in Sanitary Wastewater System Assessments of Canadian Shellfish Areas Chris Roberts Environment Canada Dartmouth, Nova Scotia Interstate Shellfish Sanitation Conference MSC Informational Meeting Charlotte, NC August 18 19, 2014
2 Canadian Shellfish Sanitation Program 101 Food safety assurance for Canadian domestic and export markets Supports 1948 Canada US Agreement on Shellfish Sanitation Delivered at federal level: Canadian Food Inspection Agency (Plant Sanitation, Biotoxins, Vibrio) Environment Canada (Growing Area Classification, Sanitary Surveys) Fisheries and Oceans Canada (Patrol, Resource Management) The CSSP shares same principles, approaches and key criteria as the NSSP Page 2


3 Wastewater Systems in Canada Approximately 3800 sanitary systems in Canada Some 320 discharge in the vicinity of shellfish growing areas on Pacific and Atlantic coasts Operation and effluent quality traditionally regulated by Provincial ministries Federal regulations promulgated in 2012, compliance of priority systems by 2020 Summary of systems near shellfish areas: Treatment Level Treatment Type Primary 7% Mechanical 41% Secondary 84% Lagoon 45% Tertiary 1% Other 14% Other 8% Page 3
4 MSC Sampling Sampling EC: 2012 present(cfia HC: ) 685 samples collected raw influent post treatment/pre disinfection final effluent 17 systems 2 primary (1 UV, 1 Cl) ,200 m 3 /d mgd 7 secondary mechanical (2 UV, 5 Cl) m 3 /d mgd 7secondary lagoon (3 UV, 1 Nat. UV, 3 Cl) m 3 /d mgd 1 tertiary mechanical (UV) 10,200 m 3 /d 2.7 mgd Mechanical: extended aeration, activated sludge, SBR, RBC, oxidation ditch Lagoons: all multi cell aerated (retention time: days; avg. 23) One sampled lagoon uses natural UV disinfection shallow pond Page 4
5 MSC Results n Log [95% CI] Raw Influent ( mgd) [4.83, 4.99] Treatment n (pairs) LRV [95% CI] Primary [ 0.59, 1.61] Secondary (Mechanical) [ 2.08, 2.48] Secondary (Lagoon) [ 2.92, 3.38] Tertiary Disinfection (where final conc. > LoQ) n (pairs) LRV [95% CI] Chlorine [ 0.25, 0.71] UV [ 1.48, 1.72] Natural UV Page 5
6 MSC Results vs FC Results MSC Fecal Coliform Treatment n LRV [95% CI] n LRV [95% CI] Primary [ 0.59, 1.61] [ 2.54, 3.82] Secondary (Mechanical) [ 2.08, 2.48] [ 2.08, 2.30] Secondary (Lagoon) [ 2.92, 3.38] [ 3.53, 3.71] Tertiary Page 6
7 Assessing Wastewater Impacts Canada Under CSSP, all wastewater system outfalls (WWTP, lift stations, CSOs) have minimum 300m (1000 ft) prohibited area Normal operation at WWTP: prohibited area expanded to achieve viral reduction performance objective at outer boundary Wastewater system failure scenarios (P 90 or max. flow): Conditional zone meets viral PO at outer boundary WWTP by pass, inadequate treatment Lift Stations, CSOs overflow or raw or diluted sewage Cond. Approved or Cond. Restricted meets 14 or 88 FC/100mL at boundary Use NoV data for WWTP LRV (if available), MSC (more likely), LRV credit Prohibited zone sized based on hydrologic modelling (DHI MIKE and others) complemented by dye and drogue studies Page 7
8 Log Reduction Value (LRV) LRV total = LRV treatment + LRV disinfection + LRV inactivation + LRV dilution Set LRV disinfection = 0 (safety factor) If t 90 = 500 hrs then LRV inactivation is <0.05 for 24hr 0 LRV total = LRV treatment + LRV dilution LRV dilution = LRV total LRV treatment Example: LRV total (performance objective) = 5.0 LRV treatment (normal operation) = 2.25 LRV dilution = LRV dilution = 2.7 : normal ops. prohibited area achieves min. 2.7 reduction For failure (raw discharge) LRV dilution conditional area would be 5.0 Page 8
9 LRV Treatment Credit Treatment LRV credit MSC LRV [95% CI] Primary [ 0.59, 1.61] Secondary (Mechanical) [ 2.08, 2.48] Secondary (Lagoon) [ 2.92, 3.38] Used for systems where neither MSC nor NoV has been measured Credit is at least one log lower than mean and below lower 95% CI Page 9


10 Modelling output LEGEND Impact zone not achieving Approved area standard Impact zone not achieving Viral performance objective

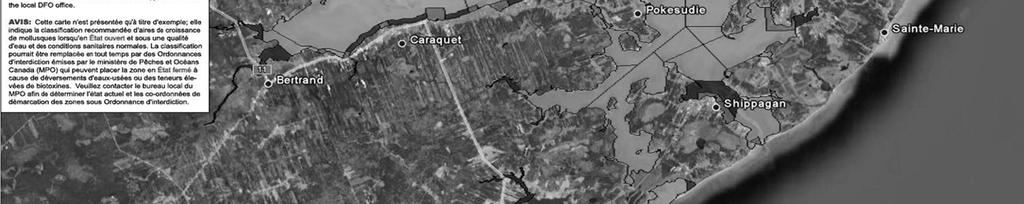


11 Growing Area Classification New Brunswick Page 11
12 Seasonality Raw Influent 6 5 MSC Raw influent (Log 10 PFU/100ml) Jan (n=21) Feb (n=25) Mar (n=41) Apr (n=11) May (n=19) Jun (n=14) Jul (n=22) Aug (n=22) Sep (n=19) Oct (n=20) Nov (n=17) Dec (n=8) Page 12
13 Seasonality LRV Treatment Stage 0.0 Jan (n=18) Feb (n=19) Mar (n=36) Apr (n=9) May (n=18) Jun (n=14) Jul (n=18) Aug (n=21) Sep (n=19) Oct (n=19) Nov (n=17) Dec (n=6) -0.5 Log Reduction Value (treatment phase) Page 13
14 Seasonality LRV Treatment Treatment Warm (Jun Sep) Cold (Jan Apr) Primary 1.7 Secondary (Mechanical) Secondary (Lagoon) All Water temperatures: Warm season: C(60 82 F) Cold season: 0 8 C(32 45 F) Page 14
15 Summary MSC appears to be a useful indicator of log reduction, particularly in WWTP treatment stage More conservative than estimating reduction via fecal coliforms (Primary and lagoon systems) Limit of Detection/Quantification/Enumeration is often limiting for determining reduction through disinfection LoQ also limiting for MSC results in overlay waters Some seasonality in raw influent and in treatment efficacy Performance objective and credit values are current [interim] Canadian Approach pending conclusions of US Canada Joint Health Risk Assessment on Noroviruses in Shellfish MSC has not yet been incorporated in CSSP for water or shellstock. Some Provinces are including LRV based on MSC into regulatory permits 2014: NoV + MSC sampling to bolster data for correlation Page 15

16 National CSSP Wastewater Assessment Team Engineers Paul Klaamas Charles Leblanc Jeffrey Stobo Technical Support Sarah Bartnik Robert Gaudet Lisa Pérusse Joe Pomeroy Don Walter Stewart Yee Program Management Chris Roberts Walter Hajen Jacques Sénéchal Page 16

17 Thank you for your attention Merci de votre attention Page 17