by Phatcharasak Arlai 1*, Manfred Koch 1, Sucharit Koontanakulvong 2
|
|
|
- Alexandrina Simpson
- 5 years ago
- Views:
Transcription
1 Embedding an Optimization Module within a 3D Density Dependent Groundwater and Solute Transport Model to determine an effective Groundwater Management Scheme in the Bangkok Aquifers System by Phatcharasak Arlai 1*, Manfred Koch 1, Sucharit Koontanakulvong 2 1 Department of Geohydraulics and Engineering Hydrology Faculty of Civil Engineering, University of Kassel, Germany; *Program* of Construction Industrial Technology, Faculty of Sciences and Technology, Nakhon Pathom Rajabhat University, Nakhon Pathom,, Thailand, and 2 Department of Water Resorces Engineerng, Faculty of Engineering, Chulalongkorn University, Bangkok, Thailand


2 Introduction The groundwater exploitation from the aquifers has increased tremendously > natural yield, without any governmental control until 1983 As a consequences, saline water has been drawn from its sources towards the producing aquifers
 clarified two cradles of contamination with MODFLOW96&MT3DMS and proposed the reasonable mitigation plans to remediate dissolved salinity pollution.")
3 Introduction Simulated Saline Intrusion with time from 1993 to 1997 (Calibrated Period) Saltplume is driven down progressively from the upper layer to lower aquifers with time. Arlai et al. (2006 a;b;c) clarified two cradles of contamination with MODFLOW96&MT3DMS and proposed the reasonable mitigation plans to remediate dissolved salinity pollution. The mitigation plans were done by trial&error method and density independent model.
4 Objective Apply an embedded groundwater management optimization model (GWM) ( (Ahlfeld et al., 2005) ) within the groundwater model MODFLOW-2000 ( (Harbaugh et al., 2000) ) to optimize the setup and number of recharge and clean-up wells for a best integrating policies & constructive measures (Arlai et al, 2006b) in quantity, quality and costs of the groundwater extracted. Using the 3D density dependent groundwater flow and solute transport model SEAWAT-2000 ( (Langevin et al., 2003) ) to simulate more realistically the effects of (a) the trial & error - and, (b) the optimized wells scheme in transient state, 2003 to Compare scheme results which obtained from a trial&error and optimization.


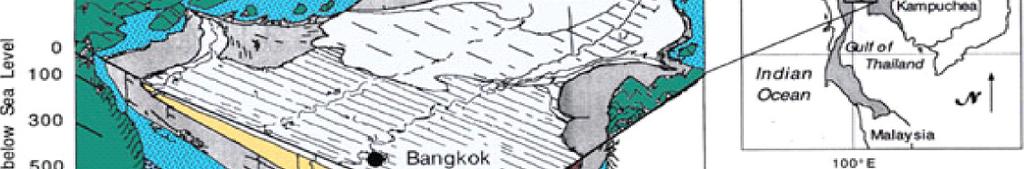
5 Study Area and Model Implementation Study Area Study Area 3D Geological Map
 Profile of Bangkok Aquifers System Conceptual")
6 Study Area and Model Implementation (Cont Cont.) Profile of Bangkok Aquifers System Conceptual Model
 Bangkok Model domain and Finite Different grid")

7 Study Area and Model Implementation (Cont Cont.) Bangkok Model domain and Finite Different grid of layer 5 Model Area: = 208*256 km 2 = km 2 Model Grid: One layer =52*55 = layers = 25740
 3D finite different grid of 9 multilayered")
8 Study Area and Model Implementation (Cont Cont.) 3D finite different grid of 9 multilayered aquifers model
9 Study Area and Model Implementation (Cont Cont.) Steady State Calibration Data from 179 monitoring wells are applied to calibrate Transmissivity and Vertical Leakance for steady state in 1999 by trial-error-method, as water levels in 1999 are more or less constant. The main 3 methods are conducted for evaluating reliable parameters (Arlai et al., 2006c), namely Conventional Misfit Composite Scaled Sensitivity and Correlation Coefficient Matrix Stochastic Assessment The Calibration for Reliable Parameters
10 Groundwater management optimization formulation Maximize (minimize) Z = ctx (1) subject to and Ax = b (2) 0<x < u (3) where Z is the value of the objective function; c is a transposed column vector of objective-function coefficients associated with the decision variables; x is a column vector of decision variables with upper bounds u; A is a matrix of coefficients defining the form of the constraints; and b is a column vector of right-hand-side coefficients associated with the constraints.
11 Groundwater management optimization formulation (Cont.) In the present saltwater intrusion GWM-problem the optimization objective is to minimize the rates Q (or costs) of possibly 93 recharge and 93 clean-up well-candidates, subject to the constraints that (a) the maximum recharge and extraction well rates Q are less than CMD, (b) the total recharge rate cannot be greater than the extraction rate and, (c) the computed heads h at 42 spatially- fixed locations along the two lines of the proposed recharge wells and clean-up well barrier in layers 3 to 5 are not dropping below specified values H---- obtained from an earlier MODFLOW calibration of the non-optimized well scheme within the Bangkok Aquifers system (Arlai et al., 2006b)--- and that appears to be appropriate to repel future seawater intrusion (cf. Reichard et al., 2003). With these goals the GWM-problem is mathematically stated as follows: (a) R kn is the recharge rate, (b) Q kn, the clean-up (discharge) rate in layer k and well site n (n = 31 is max. number of flux decision variables for layer k); (c) βn is the cost or benefit per unit volume of water withdrawn or recharged at well site n, (if only flow-rate is optimized, (d) βn is set to a dimensionless value of 1.0); (e) T Qwn is the total active duration of the flow-rate that is taken here as identical with TQwn = 7665 days (for the stress period 2 between year 2012 and 2032) at all well sites; (f) h i,j,k,2 is the modeled head at the 42 head constraint locations at col.= i, row = j, layer = k and stress period 2; and (g) H i,j,k,2 is the named head constraint acting as a flow barrier.
12 Groundwater management optimization formulation (Cont.) Simplified flow chart illustrating the groundwater flow model (GWF) and ground water management model (GWM) processes (Ahlfeld et al., 2005)
13 Density dependent model of groundwater flow and solute transport Variable density of groundwater flow formulation The solute transport equation

14 Hydraulic and water quality optimization benefits: Hydraulic optimization benefits layer3 layer4 layer5 Trial-and error well scheme: Orange area shows the distribution of the present day pumps, blue area the line of recharge wells, with the clean-up wells located 4 cells northward of the former. The integrated non- and constructive measures and is by design in terms of aquifer restoration, since it includes an active recharge and clean-up component. (1) Here all pump rates are kept at the values of 2002, with the pumps in the deep layer 6 completely shut off in year 2012 (2) Recharge wells are set up along the seawater intrusion front, (c > 4000 mg/l), and a clean-up well penetrating to the depth of the saltwater front (c< 1000 mg/l) that extracts saline water which, after treatment, is recharged back into the aquifer.
 layer3 layer4 layer5 (1) For the trial&error which combines recharge, clean-up wells and a cease of groundwater pumping in the 6th modeled layer,31 recharge wells and 31 clean wells along the")

15 Hydraulic and water quality optimization benefits (Cont.) layer3 layer4 layer5 (1) For the trial&error which combines recharge, clean-up wells and a cease of groundwater pumping in the 6th modeled layer,31 recharge wells and 31 clean wells along the tongue of seawater intrusion in each layer are specified resulting in a total of 93 recharge- and 93 clean-up wells. Each of these wells is operated at a rate of 7000 CMD. Hence the total water circulation rate in this scenario is 6.51*105 CMD. (2) Using the MODFLOW-GWM optimization code to solve the GMW-problem (4-7), results in a total of only 37 recharge-(15, 10, 12 wells in layer 3, 4 and 5) and 27 clean-up (16, 6, 5 wells in layer 3, 4 and 5) wells to control the heads at the 42 head constraint locations. And the water circulation rate is merely 3.17*105 CMD.

16 Hydraulic and water quality optimization benefits (Cont.)


 well scheme for year 2032 in layer 3(a), 4")
17 Hydraulic and water quality optimization benefits: Effects of the two well schemes on future saline contamination layer3 layer4 layer5 Comparison of computed saline pollution of the trial & error - (solid black lines) and the optimized (dashed red lines) well scheme for year 2032 in layer 3(a), 4 (b) and 5(c).

18 Thank you very much indeed for you attention Danke schön n für f r Ihre Aufmerksamkeit