Green Infrastructure. Jesse Schomberg University of Minnesota Sea Grant Program
|
|
|
- Richard Arnold
- 5 years ago
- Views:
Transcription


1 Green Infrastructure Jesse Schomberg University of Minnesota Sea Grant Program

2

3 Forest Cover


4 Storage (Wetlands)


5

6 What alters this process?

7


8

9 Altered runoff patterns
10 North Shore Streams: Miles of Stream channel vs. miles of ditches Sucker River Stream miles Knife River Poplar River Ditch miles


11 How can we prevent these problems? Planning Policies Zoning Ordinances Practices (BMP s!) German Association of Cities

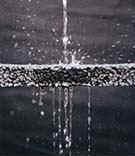
12 What is Green Infrastructure? Green infrastructure is a type of stormwater control measure. The goal of green infrastructure is to slow or retain stormwater runoff where it originates, encourage infiltration and evaporation, decrease or remove pollutants carried by stormwater, and reduce or delay the amount of runoff entering stormwater or sewer systems.


13 Grass parking Rain gardens Pervious pavement Native Plantings Parking lot infiltration islands Grass swales

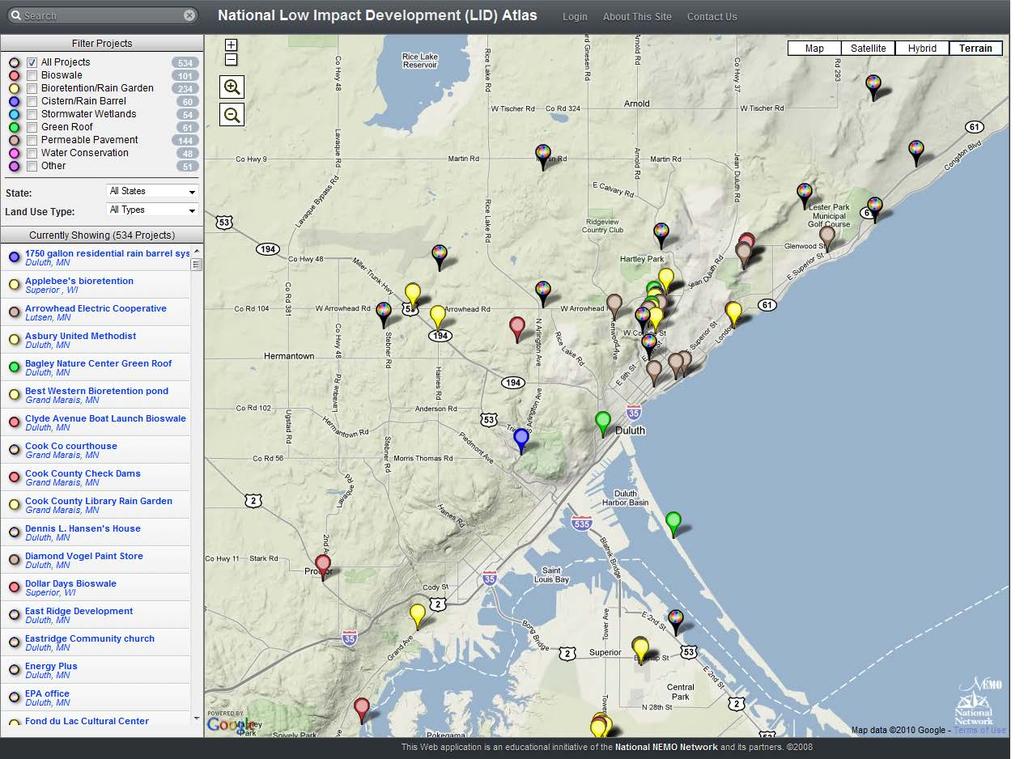
14 National LID Atlas
15

16


17 Protecting Resource on-site

18 Lakewood Zoning Scenario Follows zoning requirements if road was allowed to interior of parcel 15 additional lots, averaging about 19 acres each Essentially no open space

19 Lakewood Conservation Design Scenario 15 lots averaging nearly 6 acres each Public road necessary Greater than 50% open space Sensitive resources avoided
20 Lakewood Township Scenarios Modeled total runoff for each scenario, and the % runoff increase from undeveloped for each scenario. 1 Acre Cleared data represents runoff if only a max of 1 acre of forest is cleared for home and yard (driveway is separate). The All Cleared represents all forestland on entire lot cleared. Difference between these two indicates the range of potential runoff increase. % Runoff Increase Total Runoff (acre-ft) 100% 90% 80% 70% 60% 50% 40% 30% 20% 10% 0% Zoning Cons Des Undeveloped 1 Acre Cleared All Cleared No Clearing Zoning Cons Des 1 Acre Cleared All Cleared
 700 600 500 400 300 200 100 0 Annual Runoff Zoning Cons Des 1 Acre Cleared All")
21 Lester-Amity 50-Year Buildout Runoff depends largely on forest clearing on individual lots Difference of 95 million gallons of runoff at 1 acre cleared and almost 400 million gallons at full clearing Total Runoff Increase (millions of gallons) Annual Runoff Zoning Cons Des 1 Acre Cleared All Cleared


22 Costs and Benefits of Green Infrastructure in the Chester Creek Project Sponsors Watershed Jesse Schomberg University of Minnesota Sea Grant ERG


23 Damage in Chester Creek from June 2012 Flood


24 Looking Forward? TP 40 Atlas 14 Infrastructure Built Today 1890 s ? Unprecedented rainfall events expected * *Kenneth Blumenfeld, MN State Climatologist

25 Mega-rain defined as 6 or greater rains covering at least 1,000 square miles and a peak amount of 8 or greater. Image Source: 2017 MN Environment and Energy Report Card DRAFT

26 Chester Creek Watershed 26


27 What Flooding Should We Expect? Future Flood Events

28 GOAL: 20% Reduction in Peak Discharge How much storage is needed to reach this target? 76 acre-feet (current conditions) 86 acre-feet (future conditions)
29 Frequency Increase of Peak Discharges Scenario: % Chance 2 yr Peak Discharge* % Chance 10 yr Peak Discharge % Chance 100 yr Peak Discharge Past Land use & Precipitation 50.00% 10.00% 1.00% 2035 Land Use & Precipitation 74.87% 14.95% 1.84% Past Land Use & Precip with Storage** 34.00% 3.95% 0.24% 2035 Land Use & Precip with Storage** 52.49% 7.00% 0.51% * % Chance peak discharge based on current discharge ** Storage assumed to be 20% of flow from current conditions Final Report, Table 20


30 Damages: What We Estimated Damage to Structures (Hazus) Loss of Recreational Use Post Storm Land Restoration Costs Storm Sewer Infrastructure Costs
31 Change in Flooding How does flooding change if the desired GI storage is implemented? How We Did It Reduce previously calculated peak discharges by 20 % (USGS Regression equations) Input the new peak discharges into HEC-RAS to obtain flood depth grids Re-run Hazus with the new flood depth grids to see how damage changes The Results Current Precipitation, Current Land Use, 20% Flood Storage 38% fewer buildings damaged 27% monetary reduction in building damages Future Precipitation, Future Land Use, 20% Flood Storage 27% fewer buildings damaged 16% monetary reduction in building damages
32 What would it cost to get 76 Acre-feet using GI? Factors influencing cost: Site Hydrology Available open space Community preference Presence of underground obstructions Presence of natural features $4,303,728 to $136,726,128 GI Practice Capital Cost / Cubic foot storage Bioswale Blue Roof Permeable Pavement Underground Storage 16.8 N/A Retention Pond Detention Wetland 1.3 N/A Annual O&M / cubic foot storage 32

33 Does the cost of green infrastructure pay for itself in reduced damages? 5,000,000 4,000,000 3,000,000 2,000,000 1,000, year 50-year Costs Benefits 2012 Flood Damages: $1.78 Million


34 Co-Benefits of Green Infrastructure Reduced damages to roads, bridges, sidewalks, water and sewage treatment facilities Recreational, educational, and other use Increased property values Ecological benefits Improved water and air quality Improved neighborhood aesthetics


35 Green Infrastructure/LID Current Chester Creek Watershed: 19.2% wetland 35.1% forest

36
37 If we keep doing what we've been doing, we won't get what we used to get - Participant at the Northeast Regional Climate Science Center meeting, Minneapolis, MN, Jesse Schomberg jschombe@d.umn.edu