Unit 2: Geomorphologic and Hydrologic Characteristics of Watersheds. ENVS 435: Watershed Management INSTR.: Dr. R.M. Bajracharya
|
|
|
- Vanessa Cobb
- 5 years ago
- Views:
Transcription

1 Unit 2: Geomorphologic and Hydrologic Characteristics of Watersheds ENVS 435: Watershed Management INSTR.: Dr. R.M. Bajracharya
2 Watersheds are hydro-geologic units Water flow and cycling are basic and essential features of watersheds, hence understanding of hydrology is important. Any discourse on hydrology must begin with the hydrologic cycle. The water cycle in a watershed is shown in the figure (next slide). The drainage pattern and ordering of streams in a W/S are the determinants of surface water flow. The smallest streams (having no tributaries) are called first order streams. The order of a stream increases successively as the number of branching tributaries increases (see figure)
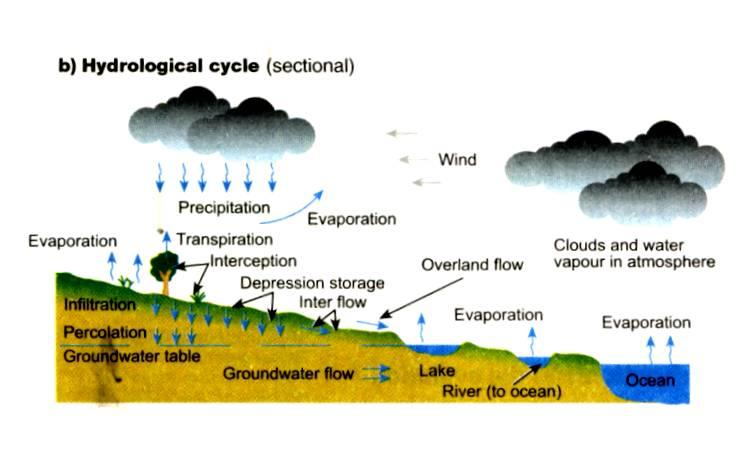
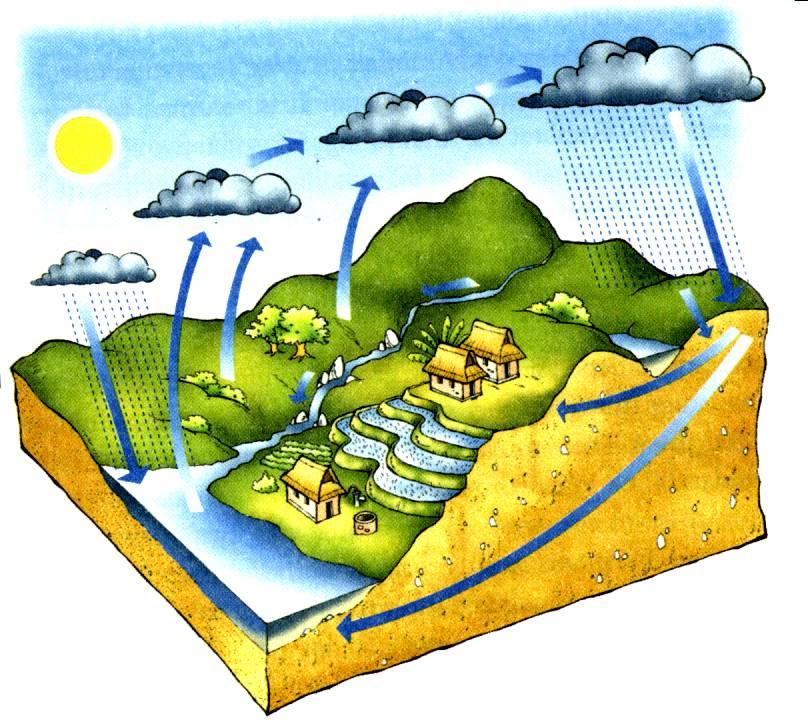
3 The hydrologic cycle
4 Stream order 1 st Order streams 2 nd Order streams Drainage divide 3 rd Order stream 3 rd Order catchment Drainage map of Ansi Khola watershed
5 Watershed Hydrology Precipitation and Evaporation Runoff and stream flow Variable source area concept Storm flow response Factors affecting storm flow response Stream flow Measurements Introduction Measuring Discharge Pre calibrated structures for stream measurements Weirs Flumes Considerations for using pre calibrated structures Empirical estimation of stream flow
6 Precipitation Precipitation may take numerous forms: rain, snow, sleet, hail. Rainfall is categorized into: light (<2.5 mm/hr), moderate ( mm/hr), or heavy (>7.6 mm/hr). Types of precipitation according to inducing factor: Cyclonic: caused by air converging in low pressure area Frontal: lifting of warm air over colder, denser air Convective: rising of warm air due to unequal surface heating Orographic: lifting of warm air over mountain barriers Measurement of precipitation: Manual rain gauge (standard 8 inch diameter) Weighing-type contiuous recording rain gauge (drum & chart) Automatic, tipping-bucket rain gauge with data-logger
7 Estimation of rainfall over an area Three methods commonly used: 1. Simple arithmetic mean of adjacent rainfall stations. 2. Thiessen polygon method sides of polygons form midway perpendicular bisectors of lines connecting two stations. 3. Isohyetal method delineate areas between iso-rainfall (equal) lines extrapolated using some numerical analysis method (usually by computer).
8 Evaporation and Transpiration Hydrologically, evaporation is restricted to the net rate of vapour transport to the atmosphere. Meteorological (sunlight, temperature, rel. humidity, wind) and nature of surface (soil, pavement, vegetated areas, etc.) are responsible for determining rate of evaporation. Water-budget determinations of reservoir evaporation (E): E = (S 1 S 2 ) + I + P O O g where, S = storage, I = inflow, P = precip., O = surface outflow and O g = subsurface seepage. Standard method for evaporation determination is pan method Transpiration is the discharge of vapour to the atmosphere via plants (leaves). Field-plot determination of evapo-transpiration: E T = {Q n G M} / {H v (1 + R)} where, Q n = net radiation exchange, G = soil heat flux, M = rate of heat storage above soil, H v = latent heat of vaporization Bowen s ratio, R = rate of heat loss by conduction to heat loss by evap.
9 What is Runoff? Runoff is water that flows over the soil surface and occurs from areas that are impervious, locally saturated, or areas where the rainfall rate exceeds the infiltration capacity of the soil (B in figure) Runoff is also termed Surface runoff, or overland flow. Surface runoff is relatively large for impervious urban areas, but typically it is insignificant for forested areas with well-drained deep soils.


10 Sub-surface water zones & flow in hilly terrain
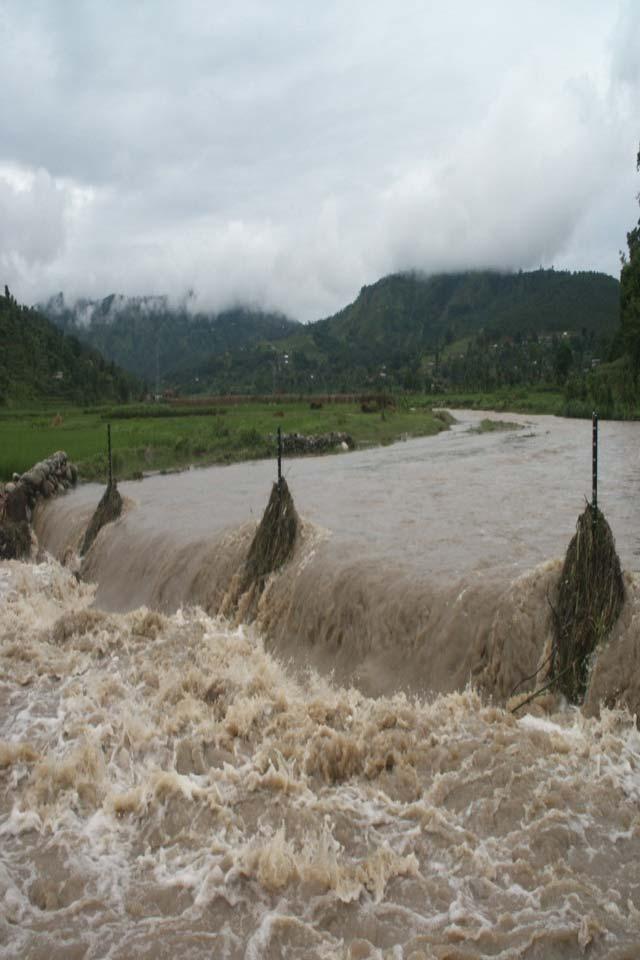
11 What is Stream flow? Stream flow represents the portion of total precipitation that runs off the land surface plus that drains from the soil and thus is neither consumed by ET nor leaked into deep groundwater. Some water flows directly into a channel and quickly produces stream flow. Other pathways have detention storage time, which can take weeks or months before excess precipitation enters a stream channel. A stream flow hydrograph is the graphical relationship of stream flow discharge (m3/sec) plotted against time


12 Stream flow regimes and season distribution Typical stream flow regime in an area of relatively uniform seasonal rainfall. Seasonal distribution of stream flow increases following forest cutting.
13 Variable Source Area Concept The VSAC explains the mechanisms of storm flow generation from watersheds that exhibit little surface runoff. Early storm flow concepts suggested that the only mechanism capable of producing quickresponding peak discharge was surface runoff. The VSAC suggests 2 mechanisms to be primarily responsible for quick flow response: an expanding source (saturated) area that contributes flow directly to a channel, and a rapid subsurface flow response from upland to lowland areas that is principally the result of soil water displacement.
14 Storm flow response The unit hydrograph (UHG) is the most widely used method of characterizing the storm flow response of a watershed and is defined as the storm flow, or direct runoff that occurs uniformly over the area and over a given time increment. Simple approaches such as Hydrologic response after Woodruff and Hewlett 1970 can be used: R 5 = (Annual storm flow / Annual precipitation) x 100 Where, R 5 = hydrologic response (%) The hydrologic response gives some indication of the storm flow response or flashiness of a particular watershed to rainstorms. For individual storms the hydrologic response can vary considerably (< 1% to > 75%) depending on antecedent moisture conditions.
15 Storm flow response Development of a Unit Hydrograph: The UHG concept can be best understood by examining the method for developing a UG from an isolated storm. Determination of stream flow volume is illustrated in the figure adjacent.
16 Storm flow response Each ordinate of the storm flow hydrograph then is divided by the total storm flow depth resulting in a normalized hydrograph of unit value under the curve
17 Storm flow response The area-weighted hourly precipitation distribution that caused the storm flow hydrograph is the next factor to be determined (Figure C) Effective rainfall is defined as being equal to stormflow, therefore, the total interception, storage, and deep seepage loss is determined as the difference between total rainfall or snowmelt and total stormflow (Figure D). C
18 Calculation of a Unit Hydrograph from a storm hydrograph


19 Infiltration index and elemental hydrograph Derivation of the infiltration index (φ) from rainfall and storm discharge records. Elemental hydrograph
20 Factors affecting storm flow response Size and Shape: The larger the watershed, the greater the volume and peak of streamflow for rainfall or snowmelt events. Watershed shape affects how quickly surface and subsurface flow reaches the outlet of watershed. The higher the drainage density, the quicker the flow response and higher the peak. Time: The higher the intensity and longer the duration, the higher the magnitude of peakflow. Vegetation type and extent, soil surface conditions, and a variety of human caused changes, such as roads, reservoirs, drainage systems, waterways, and stream channel alterations:


21 Influence of rainfall type/pattern on stream flow Stream flow hydrograph for period of short intense rainfall. Complex stream flow hydrograph
22 Stream flow measurements Measuring Discharge: One of the simplest ways of measuring discharge is to observe the time it takes a floating object tossed into the stream to travel a given distance. Q = VA: where, Q = discharge (m 3 /sec0;v = velocity (m/s); and A = cross section (m 2 ) Pre calibrated structure for stream flow measurement: On small watersheds, less than 800 ha in size, structures like weirs and flumes are used.

23 Weirs & Flumes A weir includes all components of a stream- gauzing station that incorporates a notch control. A flume is an artificial open channel built to contain flow within a designed cross section and length.
; R h = the hydraulic radius (ft), s = energy slope (ft/ft), and n = a roughness coefficient (adapted from Gray")
24 Empirical estimations of Stream flow The Manning equation: V = 1.49 R h 2/3 s 1/2 n Where, V = the average velocity in the stream cross section (ft/sec); R h = the hydraulic radius (ft), s = energy slope (ft/ft), and n = a roughness coefficient (adapted from Gray 1973) The Chezy Equation is: V = C R h s Where, C = Chezy roughness coefficient. C = 1.49 R h 1/6 n The slope of the stream channel can be estimated by the slope of the stream channel along the reach. The wetted (WP) can be measured by laying a tape on the channel bottom and sides between the high watermarks
25 Manual method of stream flow and discharge measurement Measure the depth of stream at numerous intervals across the width of steam and calculate cross-sectional area of the stream segment (A) Measure the flow velocity of water using current meter or float technique Calculate avg. flow velocity for stream (V) Then, discharge, Q = A*V (m 3 /s)


26 Current Meters