Net Zero Bay Area: Getting There Through Public/Private Networks of Innovation
|
|
|
- Gervase Gardner
- 5 years ago
- Views:
Transcription


1 Net Zero Bay Area: Getting There Through Public/Private Networks of Innovation Moderator: Yoriko Kishimoto, Former Mayor of Palo Alto Panelists: Catherine Sandoval, California Public Utilities Commission Phil Williams, Webcor Marianna Grossman, Sustainable Silicon Valley Rafael Reyes, Bay Area Climate Collaborative Jim Keene, City of Palo Alto #SVEnergy2011

2 California Public Utilities Commission Commissioner Catherine J.K. Sandoval California Public Utilities Commission Silicon Valley Energy Summit Net Zero Bay Area: Getting There Through Public/Private Networks of Innovations 2 June 24, 2011
3 California s GHG Reductions in 2020 AB 32 GHG Reductions from Electricity Generation (in MMTCO 2 E) Measure Name Total Electricity Sector 2020 BAU Emissions ARB Measur e ARB Scoping Plan Goal Reductions Energy Efficiency (EE), Electricity E Increased Combined Heat and Power (CHP) 33% Renewable Portfolio Standard (RPS) Million Solar Roofs (California Solar Initiative) E E E Solar Water Heaters CR Source: ARB Total Complementary Policy Reductions 45.4 Net 2020 Electricity Sector Emissions
4 IOU Portfolios $3.1B portfolio: forecasted to save 7,000 GWh, 1,500 MW,150 MMTherms (equivalent of 3 major power plants) 12 statewide programs implemented consistently across investor owned utility service territories - same program name, design, incentive levels. Program Budget Program Budget Residential $718 M Emerging Technologies $68 M Commercial $863 M Codes & Standards $30 M Industrial $405 M Integrated DSM $11 M Agricultural $128 M Workforce Education & Training $102 M New Construction $ 137 M Marketing Education & Outreach $ 80 M HVAC $128 M Lighting Market Transformation $1.5 M Local government partnerships ($233 M) & institutional partnerships ($95 M) Many new strategic programs: whole-house retrofit, zero net energy pilots, on-bill financing, C&I energy management 4

5 Zero Net Energy Programs PG&E ZNE Pilot Program - $13.65 M Design and technical assistance Monitoring and performance of demonstration projects Best practices SCE & Sempra Sustainable Communities - $9.7 M Commercial and Residential Master Planned Communities Integrated Design SCE ZNE Technology Center - $2.2 M Overvie w Strategic Plan Savings Goals RRIM On-site electricity demand EM& V WHAT IS ZERO NET ENERGY? Zero net energy Distributed renewable generation Post Plannin Key Issues Slide 5
6 Innovative Structural Arrangements to Reach GHG Reductions Outsourcing of utility procurement transactions CPUC Requests for Offers (RFOs) Renewable Auction Mechanism Large scale solar Photovoltaic (PV) installations Third party EE program providers in utility portfolios Direct business retail transactions with energy users California Solar Initiative (CSI) (PV, Solar Thermal, Water Heating) Self Generation Incentive Program (SGIP) (Eligible Technologies, Incentive Mechanism) $1.3 billion/year authorized in utility EE program expenditures (Technical and Financial Assistance to Homes and Businesses) Advanced Metering Infrastructure (Private Delivery of Home Energy Network, Energy Management Solutions) New partnerships to deliver new solutions Renewable Feed In Tariff (Up to 1.5 MW) EE Emerging Technologies Program ($60 million in 3-year cycle) Plug in Vehicle Public/Private Collaborative Utility Scale Lithium Ion Storage Project ($25 million DOE ARRA funding)


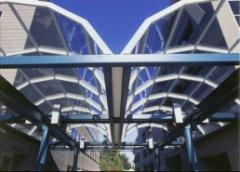

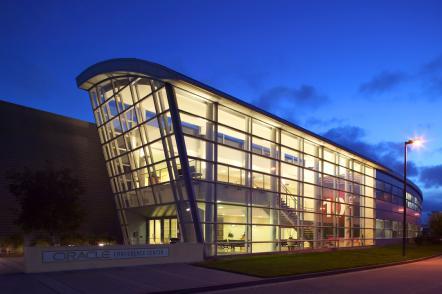

7 Webcor Builders Founded in 1971 in San Mateo. Other offices in San Francisco, Los Angeles, San Diego, Alameda and Anaheim. Annual Contracts over $1 billion. Consistently listed among the ENR Top 30 Contractors in the Country.

8 Percentage of Webcor Revenue from LEED projects 26.1 Million square feet of LEED Projects $6.5 Billion of LEED Projects
 1400 1200 1399 1000 800 600 771 900 400 192 200 115 34 57 0 2005")
9 GREEN BUILDING: Global Trend U.S. total sqft of LEED Registered Commercial buildings (in Millions of sqft) Today * 25% of all U.S. New Construction buildings are LEED Registered/Certified
10 Webcor Builders Operational Emissions California Climate Action Registry (CCAR) Webcor s Operational Emissions (Scope 1, 2) = 6,400 metric tons of CO 2eq
 = 560,000 Metric Tons CO2eq Downstream Scope 3 (use phase and end of life) = 1,700,000 Metric Tons CO2eq")
11 Total Scope 3 Webcor Builders Supply Chain & Operational Emissions California Climate Action Registry (CCAR) Scope 1 = 400 Metric Tons CO2eq Employee Commute 0.2% Scope 1 0% Scope 2 0.3% Upstream Scope 3 25% Scope 2 = 6,000 Metric Tons CO2eq Upstream Scope 3 (supply chain) = 560,000 Metric Tons CO2eq Downstream Scope 3 (use phase and end of life) = 1,700,000 Metric Tons CO2eq Downstream Scope 3 75% Other Scope 3 (employee commute) = 5,000 Metric Tons CO2eq
 = 2,265,000 metric tons of CO 2eq Operational Emissions (Scope 1, 2) = 0.")
12 Webcor Builders Supply Chain & Operational Emissions California Climate Action Registry (CCAR) Supply Chain Emissions = 99.63% (Scope 3) = 2,265,000 metric tons of CO 2eq Operational Emissions (Scope 1, 2) = 0.44% = 6,400 metric tons of CO 2eq Scope 3 Supply Chain includes all materials, supplies and subcontractors


13 Energy Summit: Net Zero Carbon Future 2011
14 CO2 Emissions (millions of tons) CO 2 e Emissions Silicon Valley CO2 Emissions in the Silicon Valley, Gasoline Natural Gas Electricity


15 EcoCloud: Collaborative Innovation Increase Profits Reduce Costs Collaborate Water, Energy Materials Sustainability Share info Marketplace for Solutions Build regional resilience 15


16 Rafael Reyes Executive Director Bay Area Climate Collaborative A project of the 16 Silicon Valley Leadership Group

17 World oil production by type 17
18 CA EV Sales Projections 18
19 The City is a partnership for living well... The City comes into existence out of the bare necessities of life but continues in existence for the sake of a good life Aristotle 19


20 Climate Protection Plan Clean and Renewable Resources Energy Efficiency and Conservation Smart Grid 20

21 HARA Energy and Environmental Management Dashboard 21

22 Partnering with Business WaveOne Working with local businesses to make the whole community more sustainable. Interest free loans from the City s electric utility for small businesses that upgrade to more efficient equipment. 22


23 Smart Grid Pilot Projects and Grants VA Palo Alto Health Care System 23
24 Community Environmental Action Partnership - CEAP Neighborhoods/Homes Businesses Faith Groups CEAP Government Stanford Schools/Youth Nonprofits Medical 24