Maintaining Water Supply Resilience in Extreme Times
|
|
|
- Geraldine Simon
- 5 years ago
- Views:
Transcription

1 Maintaining Water Supply Resilience in Extreme Times Presented to the Western Coalition of Arid States June 20, 2018
2 Presentation Outline: Snapshot of Reclamation Offices West-wide Precipitation and Storage Colorado River Basin Hydrology Lower Basin Colorado River Management Objectives Lake Mead Projections Risk of Lake Mead Reaching Critically Low Elevations (1,025 ) Drought Contingency Plan Pilot System Conservation Program Implementation of Minute 323 Federal Participation in the Salton Sea Fix WaterSMART Programs
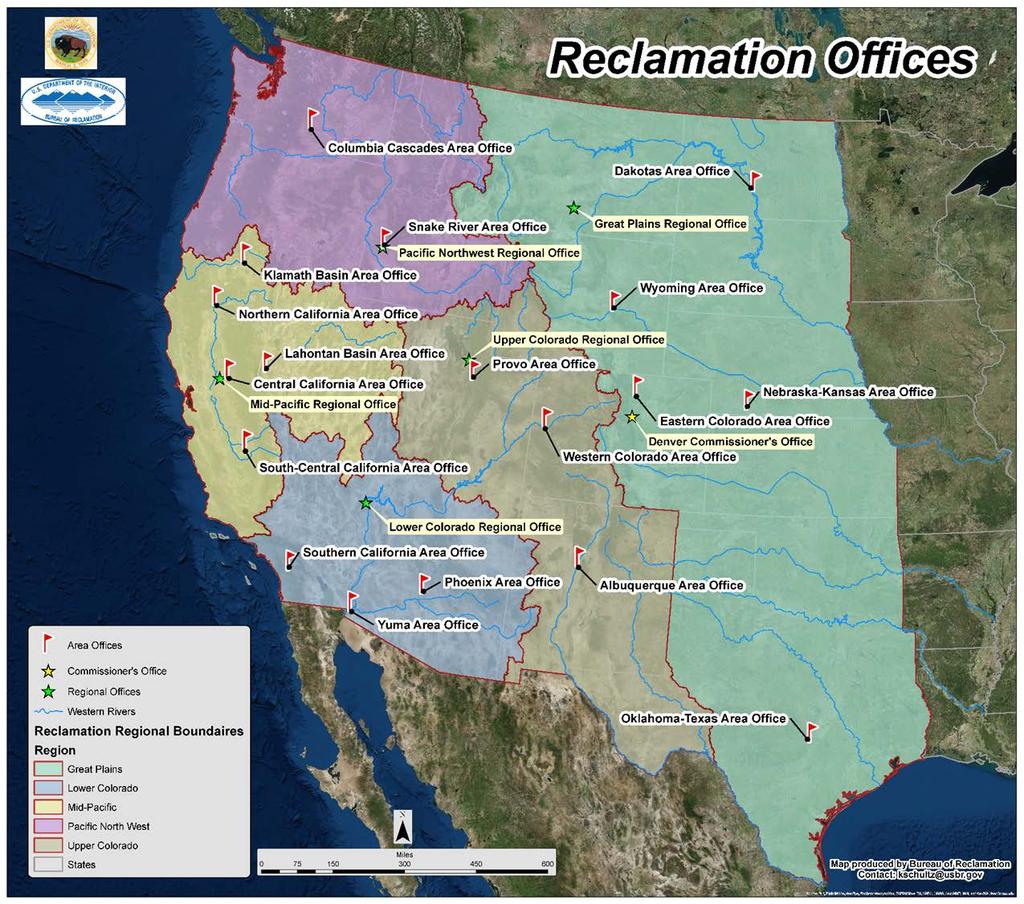
3

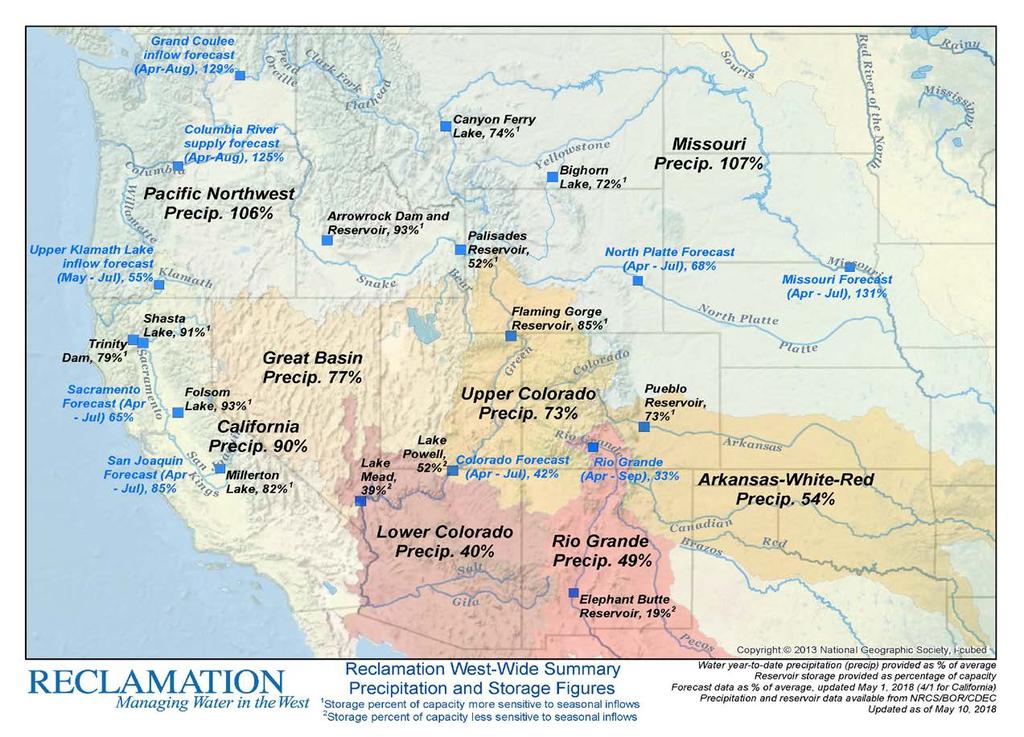
4 West-wide Precipitation and Storage

5 Colorado River Basin Hydrology 16.5 million acre-feet (maf) allocated annually 13 to 14.5 maf of consumptive use annually 60 maf of storage 14.8 maf average annual natural inflow into Lake Powell over past 110 years Inflows are highly variable year-to-year


6 Lower Basin Colorado River Management Objectives Provide flood control and river regulation Meet water demands Generate hydropower Enhance and maintain ecosystem habitat Recover and protect endangered species Provide recreation
7 Natural Flow Colorado River at Lees Ferry Gaging Station, Arizona Water Year 1906 to 2018 Colorado River at Lees Ferry, AZ - Natural Flow Average 10-yr Moving Average Annual Flow (MAF) Water Year Provisional data, subject to change Estimated values for
8 State of the System (Water Years ) 1, Unregulated Inflow into Lake Powell Powell-Mead Storage and Percent Capacity 100% 90% 80% 70% Volume in MAF % 60% 50% 40% 30% Percent Capacity % 64% 65% 24% 118% 57% 55% 80% 81% 112% 94% 78% 45% 47% 110% 96% 94% 89% 51% 20% 10% 0% End of Water Year Powell and Mead Storage (MAF) Unregulated Inflow into Powell (MAF) Powell and Mead Percent Capacity 1 Values for Water Year 2018 are projected. Unregulated inflow is based on the latest CBRFC forecast dated May 2, Storage and percent capacity are based on the April Month Study. 2 Percentages at the top of the light blue bars represent percent of average unregulated inflow into Lake Powell for a given water year. The percent of average is based on the period of record from
 70% of average Snow Water Equivalent (inches) 24 22 20 18 16 14 12 10 8 6 SWE peaked at 73% of the peak seasonal median on 3/30/2018 PAST FUTURE 150 125")

9 Water Year Snowpack and Precipitation 1 as of June 18, 2018 Colorado River Basin Above Lake Powell Colorado River Basin above Lake Powell Water Year 2018 Precipitation (year-to-date) 70% of average Snow Water Equivalent (inches) SWE peaked at 73% of the peak seasonal median on 3/30/2018 PAST FUTURE Percent of Seasonal Median Oct 1-Nov 1-Dec 1-Jan 1-Feb 1-Mar 1-Apr 1-May 1-Jun 1-Jul 1-Aug 1-Sep Median: WY Previous Water Year: 2017 Current Water Year: Percent of normal precipitation is based on an arithmetic mean, or average; percent of normal snowpack is based on the median value for a given date.
10 Colorado River Drought is the driest 18-year period in over 100 years of historical records ( are estimated) Tree-ring reconstructions show more severe droughts have occurred over the past 1200 years (e.g., drought in the mid 1100s) The 2018 April through July runoff forecast is 37% of average 1 as of June 18, Not unusual to have a few years of above average inflow during longer-term droughts (e.g., the 1950s) 1 Percent of average is based on the period of record from

11 Colorado River Basin Storage (as of June 17, 2017) Reservoir Percent Full Storage (maf) Elevation (Feet) Lake Powell 53% ,612 Lake Mead 38% ,078 Total System Storage* 51% NA *Total system storage was at 55% or maf this time last year

12 Pilot System Conservation Program In 2014, the Bureau of Reclamation, the Colorado River Basin States and Colorado River water users explored ideas that could mitigate the impacts of the ongoing drought in the Colorado River Basin. One idea that received broad support was funding projects that would test a wide range of measures to conserve Colorado River water in Lake Powell or Lake Mead as Colorado River System water for the benefit of all users to help offset declining reservoir elevations.

13 Drought Contingency Plan
14 Total Contemplated Lower Basin Volumes (in KAF) 2007 Interim Guidelines, Minute 323, Lower Basin Drought Contingency Plan & Binational Water Scarcity Contingency Plan Lake Mead Elevation (ft msl) 2007 Interim Guidelines Shortages Minute 323 Delivery Reductions AZ NV Mexico Total Combined Reductions Lower Basin States + Mexico DCP Contributions Binational Water Scarcity Contingency Plan Savings AZ NV CA Mexico Combined Volumes by Country US: (2007 Interim Guidelines Shortages + DCP Contributions) Mexico: (Minute 323 Delivery Reductions + Binational Water Scarcity Contingency Plan Savings) AZ Total NV Total CA Total Lower Basin States Total Mexico Total Total Combined Volumes Lower Basin States + Mexico 1,090 - >1, ,075 - > ,050 - >1, ,045 - >1, ,040 - >1, ,035 - >1, ,030 1, , ,017 <1, , ,375 The US will work to create or conserve 100,000 af or more of Colorado River system water on an annual basis to contribute to conservation of water supplies in Lake Mead and other Colorado River reservoirs. All actions taken by the United States shall be subject to applicable federal law, including availability of appropriations.

15 Implementation of Minute Treaty with Mexico 2014 Minute 319 Pulse Flow Celebration Algodones, Baja California, Mexico

16 Federal Participation in the Salton Sea Fix

17 WaterSMART Program Supports Reclamation s mission through collaboration with stakeholders to improve water management, increase conservation, and stretch scarce water resources


18 Drought Response Program Drought Contingency Planning Drought Resiliency Projects Emergency Response Actions
19 Drought Response Program Program Requirements Eligible Applicants States, Indian Tribes, Irrigation Districts, Water Districts, and other organizations with water or power delivery authority Cost Share 50% non-federal cost-share required Drought Plans Up to $200,000 per plan, completed within 2 years Drought Projects Funding Group I: Up to $300k and completed within 2 years Funding Group II: Up to $750k and completed within 3 years


20 Drought Response Program Drought Contingency Plans The East Bay Municipal Utility District and other regional water management agencies within the Bay Area in California will develop a drought contingency plan The Washington State Department of Ecology will update its drought contingency plan, last published in The Dolores Water Conservancy District in Colorado will develop a drought contingency plan with the Ute Mountain Ute Tribe Farm and Ranch Enterprise, and the Montezuma Valley Irrigation Company.
21 Drought Response Program Drought Resiliency Projects Eligible Projects Include: Infrastructure Improvements Modifying surface water intakes New conveyance system components Additional water storage Aquifer Storage and Recovery Capture and treat alternative supplies Decision Support Tools & Modeling Tools to support water marketing Tools to convey water supply information Measurement Environmental Protection Improve habitat Install fish screens and ladders Projects build resilience to drought Projects supported by a drought plan are more competitive Funding Level I: $300k Funding Level II: $750k
22 WaterSMART Title XVI

23 WaterSMART Data Visualization Tool Data visualization site is an interactive companion to this report: Interactive maps Featured project tours Program growth over time Data Visualization Tool: arcg.is/1tct68s


24 Thank You! Jack Simes Ph

25