Renewable Energy ~ A Utility Perspective
|
|
|
- Philippa Price
- 5 years ago
- Views:
Transcription
1 28 th USAEE/IAEE North American Conference Unveiling the Future of Energy Frontiers Renewable Energy ~ A Utility Perspective Thomas MacLean, Manager Customer Renewable Energy Programs December 5, 2008


2 Renewable Energy for Utilities - Overview
3 Introduction to Puget Sound Energy Pacific Northwest Bellevue W. MONTANA WASHINGTON OREGON IDAHO PSE Headquarters Bellevue, Washington Service Area 6,000+ square miles Electric Customers 1.05 million Rate Base $3.1 billion Natural gas Customers 725,000 Rate Base $1.2 billion Seattle Bellevue San Francisco Los Angeles New Orleans New York Washington, DC


4 PSE-Owned Utility Scale Wind Projects Hopkins Ridge: 150 MW Wild Horse: 229 MW

5 PSE Renewable Acquisition Strategy 85 amw 240 amw 10% PSE 10% Goal RPS Requirement Future Renewable Acquisitions Under Active Consideration Existing PSE Renewables

6 Pacific NW Renewable Projects Renewable Northwest Project

7 BPA Transmission Constraints
8 Resource Cost Comparison year Levelized Cost $/MWh $44-62 $ $ $60-85 $ $ $64-67 $ $ $42-74 $ $ Wind Natural Gas Notes: 2004 prices represent Mid-C delivery and 2008 prices represent deliveries to PSE s system System PPAs are offers that are shorter term in nature and not tied to a specific resource. Hydro System PPAs


9 Rising wind turbine costs Wind turbines comprise 60% of total project costs. Source: Berkeley Lab database.thorndike Landing analysis.

10 Biomass - active opportunities Dairy Digesters Wood Waste Waste Water Treatment Plants Landfill Dairy Digesters Wood Waste Landfill Waste Water Treatment Plants
11 Green Tariff (Schedule 91) PSE s offer to new small renewable resources Market price forecast for 10 years + Adjust upward for new cost of resources Fixed price offer (not flat) for 10 years Published and bankable Separate contract for the RECs
12 Green Power Program sales growth Annual Green Power Megawatt-hours Sold , , , , , ,110 8, Projection


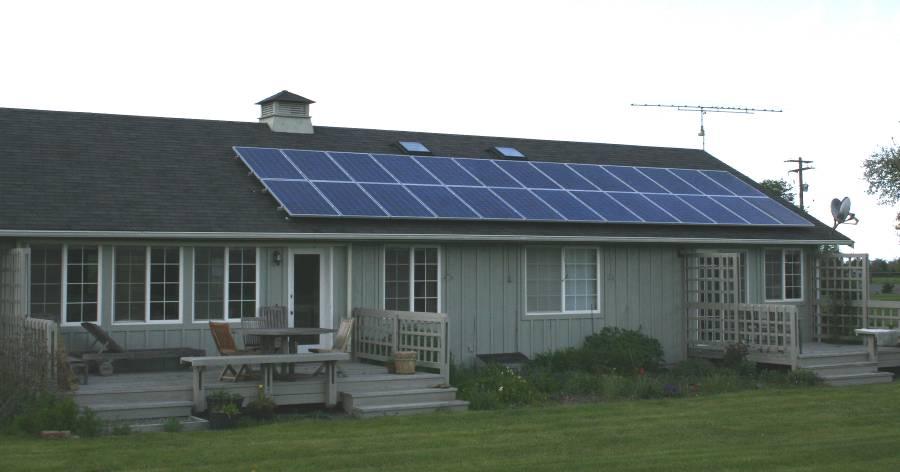
13 Customer-Owned Generation Photos courtesy of Power Trip Energy
14 10 Years of Net Metering Net Metering Customers Current: 326 systems; 1,155 KW
15 Net Metering with continued growth to 2015 Net Metering Customers to ,000 12,000 12,207 10,000 Projection: 12,000 systems; 42,000 kw 8,000 7,295 6,000 4,359 4,000 2,605 2,000-1,

16 PSE Net Meter Customers
17 PSE Solar Demonstration Projects Schools Environmental Centers Other Buildings
18 PSE Green Tariffs Net Metering Services for Customer-Generator Systems (Schedule 150) Net metering up to 100 KW Surplus energy credited to customer bill Eligible resources: wind, solar, anaerobic digester, hydro Renewable Energy Production Incentive Payment Program (Schedule 151 works with either Schedule 150 or Schedule 91) Production payments, meters AC energy before load Eligible resources: wind, solar, anaerobic digester Payments range from cents per kwh Annual cap of $2,000
19 Community Solar New model that requires partnership of utility, city and community organization. 501c3 Organization collects donations and builds the system. Net Meter if they have a load (Sch 150), Production payments if no load (Sch 91) Payments to Organization goes back to buying more panels or education.
20 Retail Rate Solar PV Convergence Cost of Residential Solar Electricity (2008 $) $0.60 $0.50 PSE Customer Costs - Unsubsized PSE Customer Costs - Subsized Levelized Cost (2008 $/kwh) $0.40 $0.30 $0.20 $0.10 $


21 Concentrating solar power
 In Development: ~ 150 MW In Consideration: ~ 250")
22 Proposed NW Geothermal Baker Neal Hot Springs Newberry Crater Crump Geyser Willow Springs Raft River China Cap Currently Operating: ~14 MW (Raft River) In Development: ~ 150 MW In Consideration: ~ 250 MW
 Douglas County (Wavegen) OPT Coos County (Ocean Power Tech.")
23 Wave & tidal power in the Northwest Wave Projects Makah Bay (Finavera) OPT Reedsport (Ocean Power Tech.) Douglas County (Wavegen) OPT Coos County (Ocean Power Tech.) Humboldt County (Finavera) Tidal Projects Race Rocks (Pilot) Snohomish PUD (Planning) Tacoma Power (Halted) Willapa Bay (Planning)

24 Puget Sound Algae Blue Marble
25 Technology Development Concept Pilot Early Commercial Favorable High Market Economics Favorable Mass Market Economics Wave Tidal Algae CPV CSP Solar Thermal Electric PHEV Biomass Gasification Solar PV Dairy Digester Fuel Cells Wind Traditional Biomass Geothermal Batteries
26 Technology development and financial support Concept Pilot Early Commercial Favorable High Market Economics Favorable Mass Market Economics Founder Financing Private Venture Capital Commercial Financing State & Federal Basic research: Universities and National Labs Grants & partnerships with private entities. Establish legal frameworks Government as Customer Tax Credits for Investment (ITC) Tax Credits for Production (PTC) Tax Credits for Manufacturing RE (OR) Promote export market Reduce regulatory barriers.
27 Basic Research Funding U.S. DOE Energy RD&D Spending FY1978-FY2009 Request million 2000$ Hydrogen (EERE) Electricty T&D Fossil (including CCT demo) Renewables Efficiency Fusion Fission Source: Gallagher, K.S., "DOE Budget Authority for Energy Research, Development, and Demonstration Database," Energy Technology Innovation Policy, John F. Kennedy School of Government, Harvard University, February 2008.
28 Partnership model for early commercial Government Funding STEM Personnel Disseminate Findings Private Partner Site and Resource Enthusiasm Production Responsibility Utility Market Access Interconnection Distribution Customer Safety and Reliability
29 Renewable technology outlook in the Northwest Technology Utility Scale Distributed Commercial Distributed Residential Wind X X Solar X X X Geothermal X EES Tidal X Wave X Biomass Combustion X X Biomass AD X X Biomass Gasification X Algae X X Fuel Cells X X Commercially available, depending on economics Tested and shows good potential Early testing with theoretical potential Target Market
30 Renewable Energy in the Northwest Discussion