2017 Iowa Statewide Waste Characterization Study
|
|
|
- Harvey Harmon
- 5 years ago
- Views:
Transcription
1 2017 Iowa Statewide Waste Characterization Study
2 Agenda 1. Purpose of waste characterization studies 2. Background of 2017 Iowa Statewide study 3. Waste sort process 4. Results 5. Resulting initiatives 6. Comparison to Minnesota results 2

3 1. Purpose of Waste Characterization Studies 3

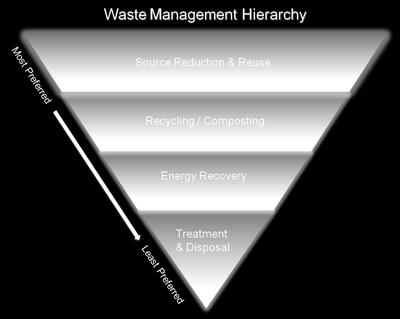
4 Why Do a Waste Characterization Study? Gauge Program Success Determine Education Opportunities Assess Diversion Opportunities Calculate Environmental Benefits Estimate Potential Revenue & Jobs Identify Disposal Trends Target Materials and Generators Assist in Facility Design Evaluate Energy Value

5 What Materials Are In This Pile? Material Types Usually Dictated by Client based on: Previous Studies What Facility Accepts Available Recycling Programs Curiosity

6 Consistent Material Definitions Allow for Comparisons

7 Although Material Types Can Be Added

8 2. Background of 2017 Iowa Statewide Study 8

9 FUNDED BY:
10 Previous Iowa Waste Sorts

11 13 Participating Landfills and Transfer Stations 2017 Host Facilities West Central Iowa Solid Waste Landfill of North Iowa City of Cedar Falls Transfer Station Dubuque Metropolitan Solid Waste Agency Cedar Rapids/Linn County Solid Waste Agency Site #2 Metro Park East Landfill Iowa City Landfill & Recycling Center Newton Sanitary Landfill South Central Iowa Solid Waste Agency Landfill Waste Commission of Scott County

12 Background Information Host Facility Study Participation

13 Similarities to Past Studies Waste generating sectors In-state wastes Host facility sort duration Targeted waste from transfer stations Site-specific sampling plans Seasonal sampling & sorting events 2017 study designed to mirror previous studies

14 Differences from Past Studies Material categories (minimal) Number of host facilities Number of samples Visual characterization of bulky wastes Some differences between studies do exist


15 3. Waste Sort Process 15

16 The Dirty Details Residential and industrial/commercial/institutional (ICI) sectors analyzed 524 solid waste samples collected 275 samples of residential waste 249 samples from ICI generating sector Performed in May, June and July
17 The Dirty Details 9 major material categories (61 subcategories) Paper (8) Plastic (11) Metal (6) Glass (6) Organics (6) Durables (4) (cell phones, monitors, TVs, appliances) C&D (6) Household hazardous materials (7) Other (7) 17

18 Methods Development of Sample Plan Obtained site-specific data Residential ICI Other Stratified sampling 50 samples/site Targeted samples Hauler information Use as a guide


19 Methods Fieldwork Health & safety #1! Equipment Containers Sort table Scale Data forms PPE

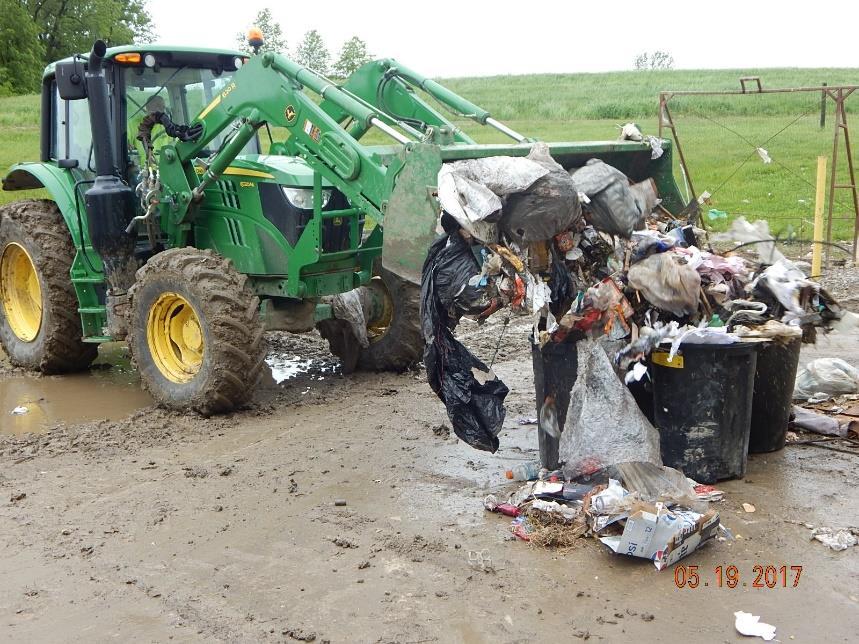

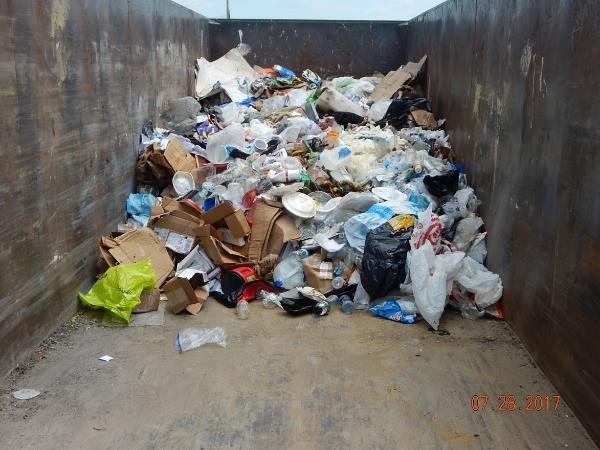
20 Methods Obtaining Sample

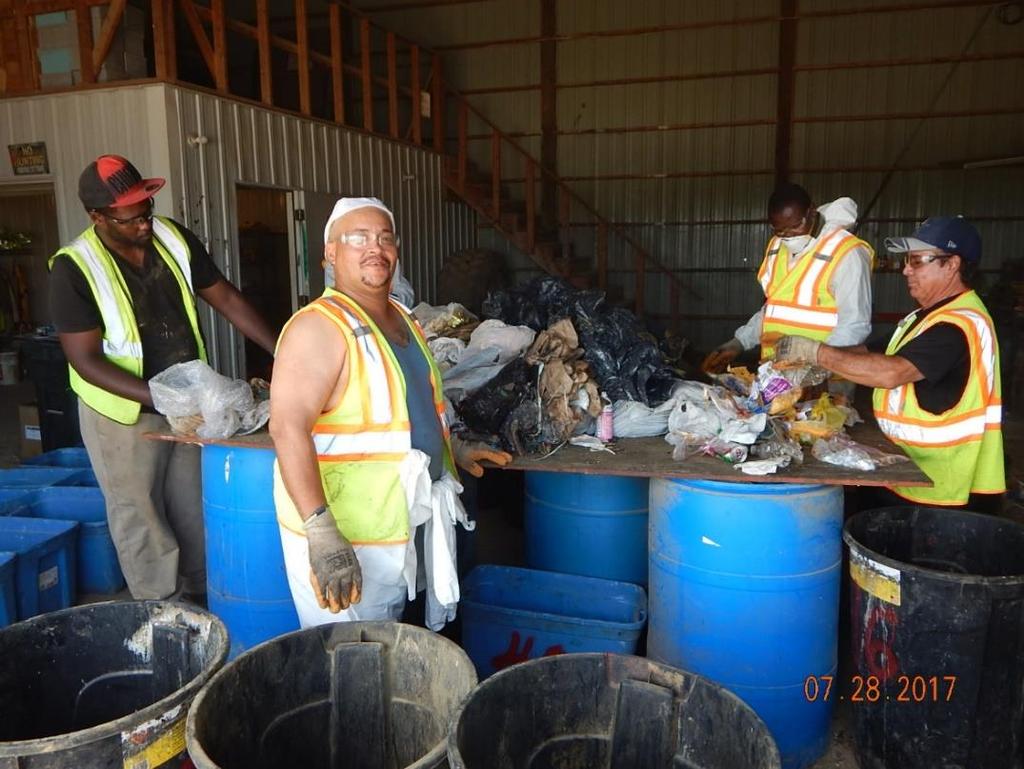
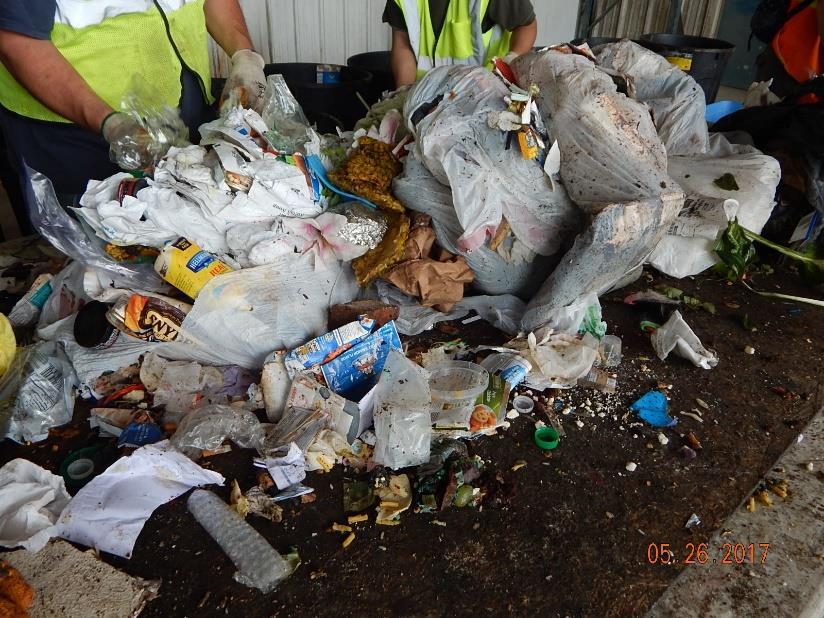
21 Methods Sorting
22 Methods Materials


23 Methods Fines


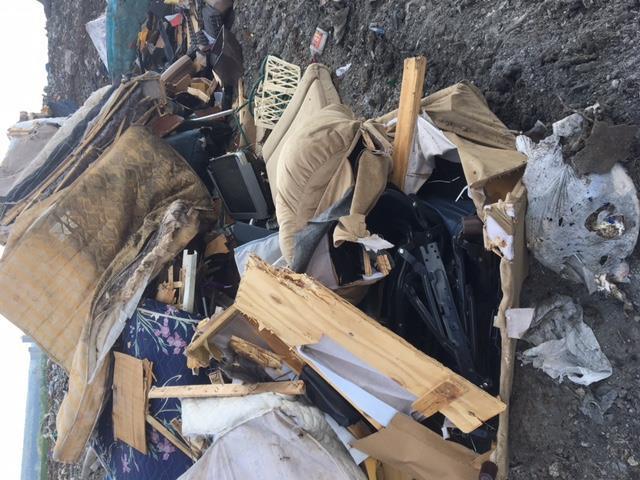
24 Methods Bulky Waste


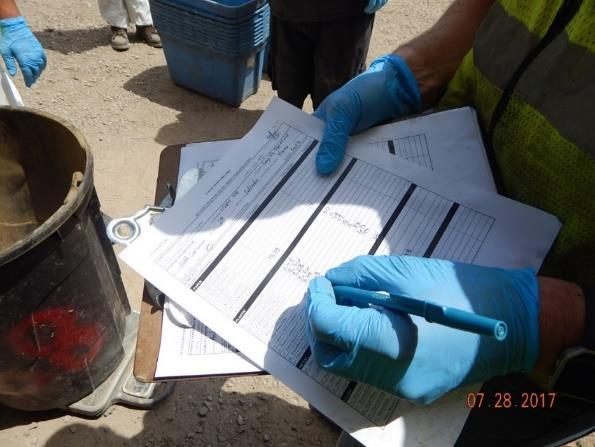
25 Methods Weighing/Data Recording


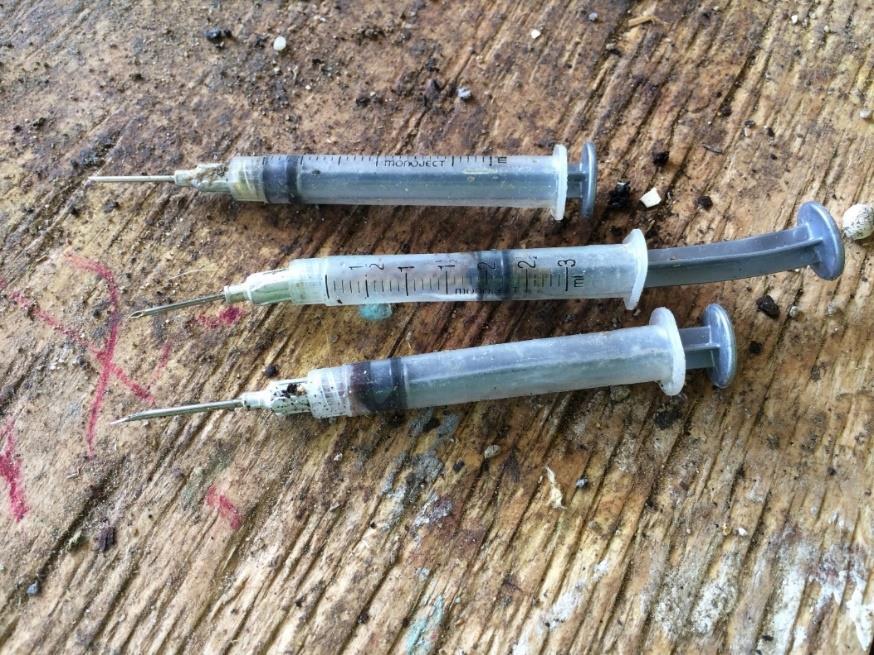
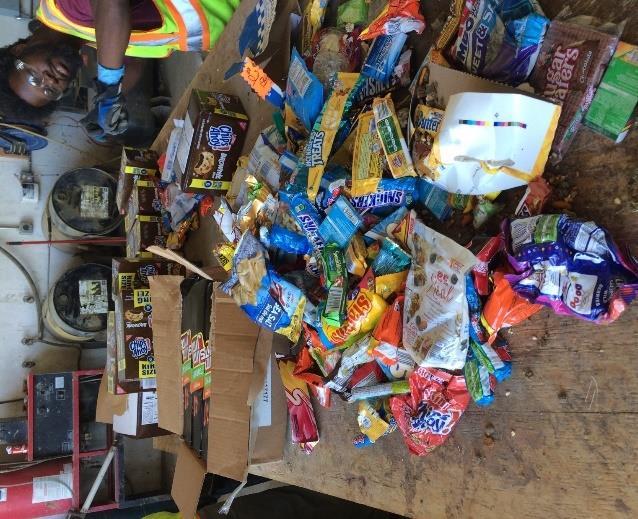
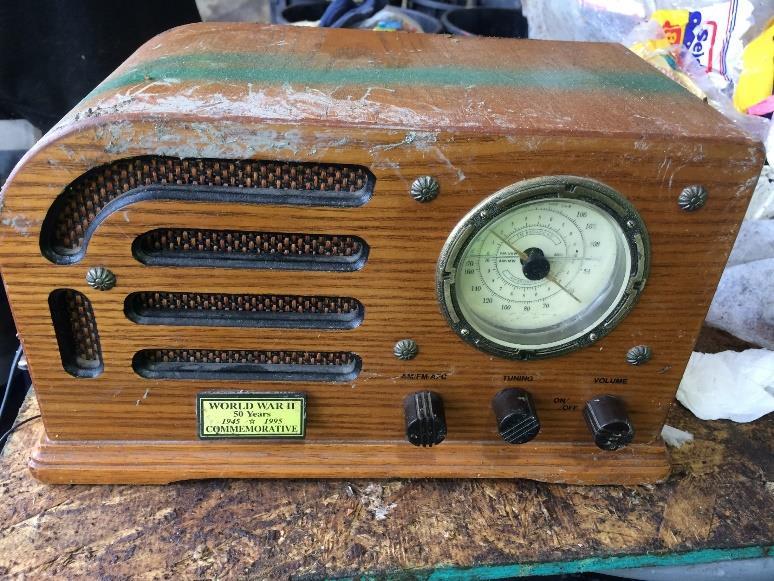
26 You never know what you will find.

27 4. Results 27

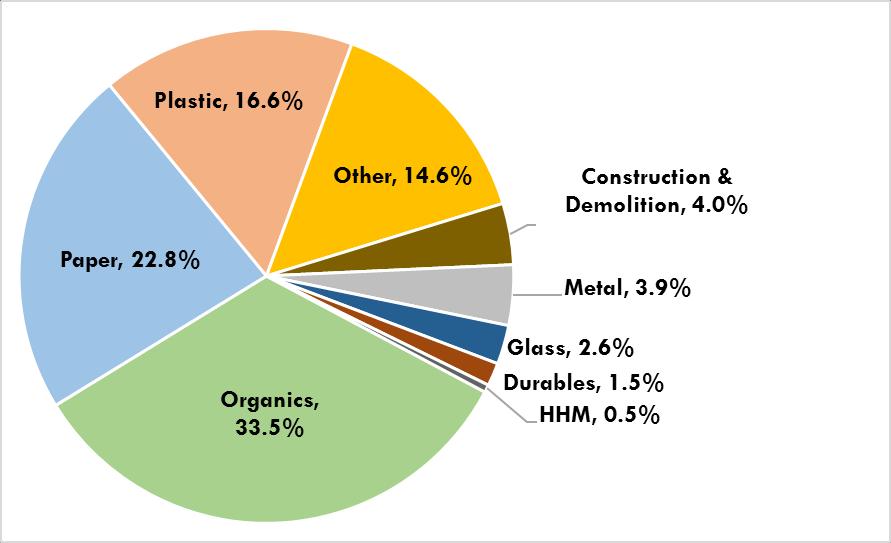
28 Overall Results
29 Top 5 Material Components Food Waste 10.7% Non-Rec. Paper 10.3% OCC & Kraft Paper 8.5% Other Plastic Products 7.5% Mixed Rec. Paper 5.4% Food Waste 10.6% OCC & Kraft Paper 8.5% Mixed Rec. Paper 7.0% Plastic Film 6.6% Compostable Paper 6.5% Food Waste 13.3% OCC & Kraft Paper 9.0% Plastic Film 6.7% Compostable Paper 6.1% Untreated Wood 5.4% Total Proportion of Top 5 Materials Food Waste 20.0% Plastic Film 8.7% Compostable Paper 7.6% Mixed Rec. Paper 6.1% OCC & Kraft Paper 4.6% 42.4% 39.2% 40.5% 47.0% 29
30 5 Materials Ranked in Top 10 for All Studies Food waste Plastic film OCC and Kraft paper Textiles and leather Other plastic products 30

")
31 New Materials in Top 10 in 2017 Other organics (e.g., cat litter, dirt, dog waste) Diapers 31

32 Residential & ICI Results Residential ICI
33 Trends Noted Material Category Overall MSW Residential ICI Paper -- Increase -- Metal Glass Increase Organic Increase -- Increase C&D Decrease Decrease Decrease Plastic -- Increase -- Durable Household hazardous materials Increase -- Increase Other


34 Diversion Opportunities Approximately 70% can be diverted Recyclable 33.4% Compostable 30.6% Reusable 7.2% Diverting waste from disposal can: Increase revenue Create jobs Reduce greenhouse gas emissions 34

35 Estimated Economic Value of Diversion Opportunities Recyclable paper $20.4 M Recyclable containers $39.9 M 35

36 Job Creation Opportunities Jobs created by disposing of recyclable material 10x Jobs created by sorting and processing of recyclable materials 1 Institute of Local Self-Reliance; Recycling Mean Business; 2002; access on October 23, 2017 from 36
37 Energy and Emissions Greenhouse Gas Reduction Opportunities Disposing of recyclable or compostable material Recycling & Composting USEPA s Waste Reduction Model (WARM) estimates over 1.4 M metric tons of carbon dioxide equivalent emissions can be reduced by recycling paper and containers and composting food waste. Energy and Emissions 37

38 5. Resulting Initiatives 38

39 How IDNR and Participating Facilities Are Using the Data Compare to previous years to see trends Determine effectiveness of existing programs Make decisions to modify existing programs Develop education and outreach
40 Iowa DNR Materials management is a perspective DNR supports as a means of better managing and protecting human health and natural resources. ~IDNR RFP October 2017 Presented results at Iowa SWANA conference May 2018 Stakeholder meeting to brainstorm and discuss strategy September 2018 RFP Sustainable Materials Management Vision for Iowa provide the foundation to update laws, policy and programs arising from the 1987 Iowa Groundwater Protection Act and the 1989 Waste Volume Reduction and Recycling Act significant changes to the issues and opportunities in solid waste management, including a global shift in perspective from waste management to materials management
 17.")

41 Dubuque Metropolitan Area Solid Waste Agency 28.4% of material organics (largest category) 17.8% food waste Organics Feasibility Study Existing organics management facilities Organics producers over 100 tons per year Management options Pro formas Presentation to Agency

42 City of Iowa City Landfill and Recycling Center

43 City of Iowa City Landfill and Recycling Center


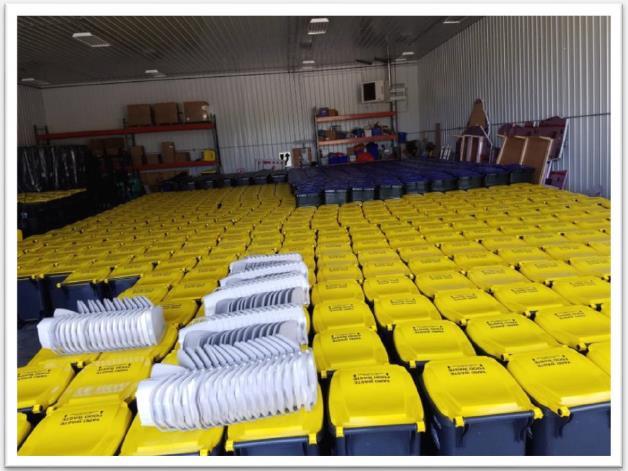
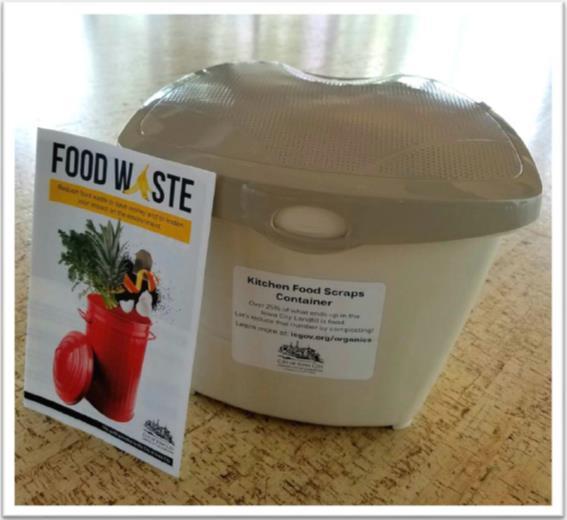
44 City of Iowa City Landfill and Recycling Center Residential Reduce Food Waste Education on curbside composting over trash Education on reduction of generation of preventative food waste Curbside carts in addition to 2-gallon kitchen food scrap containers
45 City of Iowa City Landfill and Recycling Center Community Carts available to events Taste of Iowa City Jazz Fest Soul Fest Arts Fest Iowa City Block Party City staff assists with cart delivery and pickup
46 City of Iowa City Landfill and Recycling Center Business Reduce, donate, compost Iowa City Compost Facility does not have capacity for large commercial accounts Composting is not main solution Offer options: Source reduction information Food Recovery Challenge Food: Too Good to Waste Table to Table partnership Composting options
47 City of Iowa City Landfill and Recycling Center Schools Source reduction and composting Working on draft toolkit for local Iowa City schools Repurposing old curbside recycling bins for school recycling bins Education!!! Bin lid colors Materials accepted Where containers used
48 Point of the Story. Data from waste sort studies: Beneficial when used Provides baseline for comparison Place to start from on beginning/enhancing programs Allows focus to be placed where needed

49 6. Comparison to Minnesota Results 49
50 The Minnesota Connection Minnesota conducted 2 state-wide waste characterization studies 1999 (documented in 2000 report) 2013 MN studies used similar methods 6 host facilities Waste sorted into similar categories 178 samples manually sorted 50
51 Key Differences Minnesota did not divide waste into generating sectors (e.g., residential, ICI) Minnesota has several other smaller-scale waste characterization studies to compare to Minneapolis Waste resource recovery facilities 51

52 Minnesota Results - Overall 52

53 Minnesota Results 2013 vs 2000 Plastic and Organics Paper 53
54 MN/IA/WI Comparison - Overall Category MN 2013 Organics 31.0% Paper 24.5% Other 18.3% Plastic 17.9% Metals 4.5% Glass 2.2% Problem Materials/ Electronics Household hazardous materials 1.2% 0.4% Category IA 2017 Organics 31.5% Paper 25.5% Plastic 18.3% Other 11.4% C&D 5.4% Metal 3.9% Glass 2.1% Durable 1.4% Household hazardous materials 0.5% Category WI 2009 Organics 23.2% C&D 21.3% Paper 19.6% Plastic 14.1% Other 12.4% Metal 4.9% Glass 1.7% Durable 2.6% Household hazardous materials 0.2% 54
55 MN/IA/WI Comparison 40% 35% 30% 25% 20% 15% 10% 5% Iowa 1998 Minnesota 2000 Wisconsin 2002 Iowa 2005 Wisconsin 2009 Iowa 2011 Minnesota 2013 Iowa % Paper 55
56 MN/IA/WI Comparison 20% 18% 16% 14% 12% 10% 8% 6% 4% 2% 0% Plastic Iowa 1998 Minnesota 2000 Wisconsin 2002 Iowa 2005 Wisconsin 2009 Iowa 2011 Minnesota 2013 Iowa
57 MN/IA/WI Comparison 35% 30% 25% 20% 15% 10% 5% Iowa 1998 Minnesota 2000 Wisconsin 2002 Iowa 2005 Wisconsin 2009 Iowa 2011 Minnesota 2013 Iowa % Organics 57
58 2013 MN Diversion Opportunities Food Waste Compostable Paper Bag and Film Plastic Wood Waste 58

59 2017 Iowa Waste Characterization Report The 2017 study will be posted here
60 Contact Christine Collier, PE Betsy Powers, PE SCS Engineers SCS Engineers (515) (608) Iowa Waste Characterization Study Minnesota Waste Characterization Study