Birmingham Clean Air Zone Feasibility Study
|
|
|
- Jasmin Jones
- 5 years ago
- Views:
Transcription

1 Work Pac kage 1 - Si eving Criteria Transport for Greater Manchester / Birmingham Clean Air Zone Feasibility Study Birmingham City Council Air Quality Modelling Report 29 June 2018
2 Birmingham Clean Air Zone Feasibility Study Project No: Document Title: Document No.: 1 Revision: 3.0 B Date: 29 June 2018 Client Name: Client No: Project Manager: Authors: Jacobs U.K. Limited Air Quality Modelling Report Birmingham City Council Tom Kavanagh Nigel Bellamy, Glyn Hodgkiss New City Court_20 St Thomas Street_London SE1 9RS_United Kingdom T +44 (0) F +44 (0) Copyright 2018 Jacobs U.K. Limited. The concepts and information contained in this document are the property of Jacobs. Use or copying of this document in whole or in part without the written permission of Jacobs constitutes an infringement of copyright. Limitation: This document has been prepared on behalf of, and for the exclusive use of Jacobs client, and is subject to, and issued in accordance with, the provisions of the contract between Jacobs and the client. Jacobs accepts no liability or responsibility whatsoever for, or in respect of, any use of, or reliance upon, this document by any third party. Document history and status Revision Date Description By Review Approved /04/18 Draft G. Hodgkiss N. Bellamy N. Bellamy /06/18 Draft v 1.0 incorporating M. Wolstencroft comments plus & D with additional measures G. Hodgkiss D. Howells N. Bellamy /06/18 Draft v 2.0 plus JAQU comments G. Hodgkiss D. Howells N. Bellamy ii
3 Contents Executive Summary Introduction What is meant by air quality? Air Pollution and Public Health EU/UK air quality legislation Local Air Quality Management in Birmingham UK Plan for Tackling Roadside Nitrogen Dioxide Concentrations Existing Initiatives Air Quality Action Plan Taxis and Private Hire Vehicles Freight and Logistics Other Transport Projects Smoke Control Areas Policies and Strategies Birmingham Connected Low Carbon Fuel Infrastructure West Midlands Low Emission Bus Delivery Plan The Case for Further Intervention Update on Birmingham s Air Quality Current Position Future Year Estimates of Birmingham s Air Quality Areas of Exceedance CAZ Options Background to the Proposals Potential Options for Birmingham Traffic Modelling Methodology Introduction Base Year Model Do Minimum (DM) Scenario Road Network Traffic Growth to Traffic Fleet CAZ Scenarios Outline of The Air Quality Modelling Process Traffic Data, Fleet Mix and Emissions Air Quality Modelling Set-Up Air Quality Monitoring Data Background Air Quality Data NOx Chemistry Model Verification iii
4 7. Air Quality Modelling Results Baseline Evaluation and Comparison with PCM DM Baseline Basic CAZ Scenarios ( Charge) CAZ D (Medium Charge) CAZ D ( Charge) CAZ Plus Additional Measures Overview Plus Additional Measures CAZ D Plus Additional Measures Conclusions Appendix A. Explanation of Vehicle Emissions Standards Appendix B. Local Fleet Mix Profiles Appendix C. Model Verification Appendix D. Dispersion Modelling Results from Evaluation of Different CAZ Scenarios Appendix E. Dispersion Modelling Results from Additional Measures Packages Table 1-1 : Numbers of Deaths, Asthmatic Children with Bronchitic Symptoms and Respiratory Hospital Admissions Attributable to NO 2 Pollution Under the Business as Usual Case...8 Table 1-2: Local Mortality Burden Associated with Particulate Air Pollution in West Midlands Local Authorities...8 Table 1-3 : Legal Limits for Pollutants of Most Concern in the West Midlands Urban Area, Including Birmingham...9 Table 3-1 : Defra s Estimated Percentage of Modelled Road Length Exceeding Limits with No Further Action. 15 Table 4-1 : Proposed Classification Standards for Compliant Vehicles Table 4-2 : Defra CAZ classes Table 4-3 Potential harging Rates Table 5-1 : Traffic Modelling Tools Table 5-2 BCC Traffic Growth 2016 to Table 5-3 Non-CAZ Scenario Forecast Compliance Rate Table 5-4 Demand Response Hierarchy Table 5-5 : Geographical Responses Table 5-6 : Application of Responses to Assignment Model Table 5-7 : Assumptions Used in Modelling Various Vehicle Types Table 6-1 : Annual Average Daily Traffic Flows Table 7-1 : Summary of 2020 DM Source Apportionment Results Table 7-2 : Summary of Modelled Air Quality CAZ Scenarios Table 7-3 : Summary of 2020 Charge Source Apportionment Results Table 7-4 : Summary of 2020 CAZ D Charge Source Apportionment Results Table 7-5 : Package of Additional Measures Table 7-6 : Summary of Dispersion Modelling Results from Additional Measures Packages Table 7-7 : Summary of CAZ D Charge Plus Additional Measures Source Apportionment Results Table 7-8 : Summary of 2020 CAZ D Charge Plus Additional Measures Source Apportionment Results.. 38 iv
5 Executive Summary A Clean Air Zone (CAZ) is being considered as part of a wider package of measures by Birmingham City Council (BCC) in order to achieve compliance with the European Union (EU) annual legal Limit Values for nitrogen dioxide (NO 2) of 40µg/m 3 in the shortest possible time. Jacobs was commissioned on behalf of Birmingham City Council (BCC) to undertake a feasibility study for a CAZ within the City of Birmingham, focusing on measures associated with road vehicles. This technical report provides an overview of the methodology, data sources and associated outcomes of the processes followed to calculate the vehicle emissions and resulting concentrations of NO 2 in the (2016) base year and (2020) future year scenarios. This technical evidence base has been used to design and evaluate future CAZ options and any additional measures required to deliver compliance with EU Limit Values within the shortest possible timescale. The report contains a full description of the factors driving implementation of the CAZ, the existing measures being undertaken by BCC to improve air quality, and an evaluation of the potential air quality benefits which could be delivered by the implementation of a suitable CAZ with appropriate supporting additional measures. The results of the traffic and air quality modelling undertaken to date have demonstrated that implementation of a charging class C or class D Clean Air Zone (CAZ), in the absence of supporting additional measures, would be insufficient to deliver compliance with EU Limit Values. Under a class C CAZ (with high charge) based on the boundary of the Inner Ring Road, exceedances of the EU Limit for NO 2 are still predicted to occur on the A38 and Ring Road in It is estimated that additional reductions of up to 11% and 31% of total oxides of nitrogen (NO x) would be required, outside and inside the CAZ, respectively, to achieve compliance with the Limit Value. Even if all the vehicles restricted by category C which entered the zone had a compliant engine, the levels of NO 2 would still be too great. This reflects the fact that over 80% of the vehicles entering the CAZ area are private cars, and these are not restricted by a scheme. Under a class D CAZ (where non-compliant cars are subject to charging), concentrations of NO 2 reduce by an additional 1.5 µg/m 3 inside the CAZ (with a medium charge), and by 1.8 µg/m 3 for a high charge, beyond the high scenario. There are still places, however, where the legal limits are predicted to be exceeded on the A38 and Ring Road. It is estimated that additional reductions of up to 9% and 19% NO x are required, outside and inside the CAZ respectively, to remove these exceedances. A number of additional measures which could be applied to support the various CAZ options have been evaluated as part of work undertaken to date. The package of measures tested include upgrade to buses and taxis, removal of free parking, changes to the road network and upgrades to bus corridors. With a Charge Plus Additional Measures scheme in place, dispersion modelling shows that by 2020, the total number of exceedances is predicted to reduce from 19 (in the Scenario) to 17 (In the Plus Additional Measures scenario). In order to deliver full compliance, additional reductions in NOx of between 14 and 31% will still be required. The CAZ D Charge Plus Additional Measures scheme is predicted deliver greater improvements by 2020, reducing the total number of exceedances from 12 (in the CAZ D Scenario) to 10 (In the CAZ D plus Additional Measures scenario). In order to deliver full compliance, additional reductions in NOx of between 3 and 19% would still be required. Overall, the CAZ D Plus Additional Measures Scheme represents the most effective scenario evaluated to date. However, since modelling the most stringent possible measures still hasn t led to compliance, BCC will be looking at achieving compliance in This is beyond the year assumed in the national modelling for the 2017 Plan because detailed local modelling presented in this report has shown that the problem is worse (in terms of number of sites over limit value and the fact that a number of sites over the limit value are outside of the city centre). 5
6 Further sensitivity analysis is being undertaken on a range of assumptions and therefore the overall conclusions leading to the preferred option may be subject to change. 6
7 1. Introduction 1.1 What is meant by air quality? Air quality is a term used to describe the air that we breathe, and the level of pollutant concentrations that are considered to be reasonably safe from a health perspective 1. The main pollutants of concern in the UK are nitrogen dioxide (NO 2) and fine particulate matter (PM). The majority of these pollutant emissions are typically associated with combustion emissions, including from vehicles and industry. Part IV of the Environment Act (1995) and resultant initial Air Quality Strategy, in the late 1990 s, introduced the concept of local air quality management (LAQM) in the UK and it was expected at this time that the forthcoming vehicle emissions standards for road vehicles and industrial permitting would deliver, if not all, then the majority of the air quality improvements needed to meet legislation. However, the predicted reductions in pollution concentrations of NO 2 have not occurred as rapidly as expected and further action is now required. 1.2 Air Pollution and Public Health The real driver for tackling pollution is the benefit to public health. It is also a social justice issue for more vulnerable people as well as a health and environmental concern, particularly given the high number of schools, hospitals and care homes affected by poor air quality. NO 2 and PM, are currently causing the greatest concern in Birmingham and other major cities across the UK. Specific health impacts 2 for these pollutants are summarised as follows: NO 2: At high concentrations, NO 2 causes inflammation of the airways. Long-term exposure is associated with an increase in symptoms of bronchitis in asthmatic children and reduced lung development and function PM: Long-term exposure contributes to the risk of developing cardiovascular and respiratory diseases, including lung cancer. Research shows that PM 10 (particles with a diameter of 10 microns and smaller) are likely to be inhaled deep into the respiratory tract. The health impacts of particles with a diameter of 2.5 microns or smaller (PM 2.5) are especially significant as smaller particles can penetrate even deeper The extent of the negative effects of air pollution on health depends on an individual s level of exposure and other conditions that they may be vulnerable to, or suffering from. Knowledge in this area is continually increasing as research progresses. Preliminary work undertaken in 2015 as part of the West Midlands Low Emissions Towns and Cities (LETC) Programme 3 provided estimates of the current impacts of NO 2 pollution on Birmingham city centre and the wider West Midlands Conurbation 4. Table 1-1 shows the estimated number of deaths per year that are attributable to NO 2 pollution, the reduction in the prevalence of chronic bronchitis in asthmatic children compared to the 2011 baseline, and the number of respiratory hospital admissions for each of the 7 West Midlands Metropolitan Boroughs for business as usual cases in 2011, 2018 and In 2011, it was estimated that 906 deaths in the West Midlands Metropolitan Districts were attributable to NO 2 pollution, including 371 in Birmingham. It can be seen that the number will decrease substantially in the future business as usual cases, primarily as a result of emissions reductions in motor vehicles. It was also estimated that the reduction in emissions between 2011 and 2026 under the business as usual cases will reduce the number of asthmatic children showing bronchitis symptoms each year by 873 in Birmingham and 1946 across the wider West Midlands conurbation. Further evaluation indicated that there were 1896 hospital admissions for respiratory diseases in 2011 the West Midlands Metropolitan Districts attributable to NO 2 air pollution, including 774 in Birmingham. The estimated number of hospital admissions will decrease by 27% between 2011 and 2026 under the business as usual case. 1 It can also relate to impacts on eco-systems, but this is beyond the scope of this report. 2 Ambient (Outdoor) Air Quality and Health Fact Sheet. World Health Organisation (2016). Accessed February West Midlands Low Emissions Towns and Cities (LETC) Programme. Accessed February West Midlands Low Emission Zones: Technical Feasibility Study. Economic and Health Impacts of Air Pollution Reductions. Ricardo-AEA. February Accessed February
8 Table 1-1 : Numbers of Deaths, Asthmatic Children with Bronchitic Symptoms and Respiratory Hospital Admissions Attributable to NO2 Pollution Under the Business as Usual Case Local Authority Deaths per year attributable to NO 2 pollution Prevalence of Chronic Bronchitis in Asthmatic Children Respiratory Hospital Admissions Per Year Reduction Base Birmingham , Coventry , Dudley , Sandwell , Solihull , Walsall , Wolverhampton , West Midlands Metropolitan Districts ,322-1,184 1,946 1,896 1,589 1,388 Table 1-2 shows the estimated burden on local mortality attributable to man-made particulate air pollution. It shows the calculated population weighted man-made PM 2.5 concentrations for each district and the calculated numbers of attributable deaths. It also shows the estimated number of attributable life-years lost. It is estimated that there were 1359 deaths attributable to particulate air pollution in 2011 in the West Midlands Metropolitan Authorities, including 486 in Birmingham. This is expected to decrease to 426 in 2026, and 1188 across the region, under the business as usual scenario. The number of deaths attributable to NO 2 in Birmingham (371 in 2011) is slightly smaller than that calculated for particulate matter. (Note that particulate matter may contribute to the estimated number of deaths attributable to NO 2 so that the effects may not be additive). Table 1-2: Local Mortality Burden Associated with Particulate Air Pollution in West Midlands Local Authorities Local Authority Average PM 2.5 concentration, µgm -3 Deaths Annual Deaths Per Year Attributable to PM 2.5 Particulate Air Pollution Life Years Lost per Year Attributable to PM 2.5 Particulate Air Pollution Birmingham , ,838 5,296 5,112 Coventry , ,874 1,709 1,642 Dudley , ,896 1,710 1,650 Sandwell , ,134 1,927 1,873 Solihull , ,233 1,128 1,083 Walsall , ,756 1,593 1,542 Wolverhampton , ,569 1,421 1,369 West Midlands Metropolitan Districts ,369 1,359 1,231 1,188 16,300 14,784 14,271 An understanding of the effects associated with sudden peaks in air pollutant concentrations is also improving. Air pollution is now believed to play a significant role in some cardiovascular episodes, for instance heart attacks, and in a range of health conditions from asthma to dementia. Clearly, this emerging evidence demonstrates that air quality improvements can have a major impact in terms of delivering health benefits, and further practical interventions to improve air quality will accelerate the delivery of these positive outcomes. 8
9 1.3 EU/UK air quality legislation The Air Quality (Standards) Regulations 2010 set legal limits (called limit values ) for concentrations of pollutants in outdoor air. These are based on the EU Air Quality Limit Values 5. The UK government is currently responsible to the EU for ensuring that it complies with the provisions of the EU Air Quality Directives 6, which are legally binding. However, under the Localism Act (2011), the UK government has discretionary powers to pass on any fines (or a proportion) to local authorities. For NO 2, the European Commission has initiated infraction proceedings against the UK and 12 other Member States 7. On the UK government s behalf, the Department for Transport (DfT) and Department for Environment Food and Rural Affairs (Defra) have Public Service Agreements relating to EU Air Quality Limit Values and it is their responsibility to ensure that the UK meets these. The legal limits for NO 2 and other pollutants of most concern for the West Midlands Urban Area (including Birmingham) are shown in Table 1-3. Table 1-3 : Legal Limits for Pollutants of Most Concern in the West Midlands Urban Area, Including Birmingham Concentration Pollutant Averaging (limit Period value) µg m -3 PM year hours PM year Target and Limit Values Target value came into force on 1 January 2010 Limit value came into force on 1 January 2015 Limit value came into force on 1 January 2005 (time extension granted to June 2011) Limit value came into force on 1 January 2005 Compliance Number of assessment for permitted 2016 in the West exceedances Midlands Urban each year Area (Including Birmingham) 8 n/a Compliant 35 Compliant 10 n/a Compliant NO hour 40 1 year Limit value came into force on 1 January 2010 Limit value came into force on 1 January Compliant n/a Non-Compliant Defra has reported PM compliance limits for 2016 across England and Wales, with most non-reportable sites falling below the legal limits. However, there are no safe limits for PM 2.5 which is more damaging to health than PM 10. Health evidence suggests that further emissions reductions, will bring about improvements in health for UK residents. Without further action there is the prospect of PM 2.5 emissions increasing if traffic levels rise. 5 Taken from: ec.europa.eu/environment/air/quality/standards.htm. Accessed February Ambient Air Quality Directive 2008/50/EC and Directive 2004/107/EC relating to other pollutants. Accessed February Communication from the Commission to the European Parliament, The Council, The European Economic and Social Committee and the Committee of the Regions. A Europe That Protects: Clean Air For All (2018). Accessed June Air Pollution in the UK Defra (2016). Accessed February An obligation to reduce exposure to concentrations of fine particles also came into force from Following the subtraction of natural sources in accordance with the directive 9
10 1.4 Local Air Quality Management in Birmingham The basic statutory framework for local air quality management (LAQM) exists under the national Air Quality Regulations and Part IV of the Environment Act 1995 ( the 1995 Act, as amended, and Part IV functions ) and this framework remains in place; relevant LAQM policy and technical guidance is provided by Defra 11,12. Under the LAQM regime, a city-wide Air Quality Management Area (AQMA) was declared in 2005 due to elevated concentrations of NO 2 resulting from road traffic emissions, particularly within the city centre area 13. The AQMA boundary has been retained since this time to ensure that there is no risk of transferring exceedance areas during the implementation of wider compliance strategies (Figure 1). The 2016 Annual Status Report for Birmingham City Council (BCC) concluded that currently, the Air Quality Objectives (AQO) were likely to be achieved in respect of all prescribed air pollutants except NO Results from the 2016 annual mean NO 2 monitoring programme, which incorporated both automatic (continuous) and diffusion tube (DT) monitoring, indicated that there were many locations within the city-wide AQMA where concentrations still exceeded the annual mean value of 40 µg/m 3 NO 2. However, it is noteworthy that none of the automated monitors indicated a breach of the short-term AQO for NO 2 during Crucially, several areas of Birmingham continue to exceed the annual mean limit for NO 2 and this is likely to continue beyond 2020, so more action needs to be taken. A range of measures are being progressed by the City Council and to underpin these interventions air quality has been prioritised across all services and championed by relevant politicians. This updated and prioritised governance will be supported by underpinning policies, including a review of the current Air Quality Action Plan (AQAP) during UK Plan for Tackling Roadside Nitrogen Dioxide Concentrations In July 2017, the government published the UK Plan for Tackling Roadside Nitrogen Dioxide Concentrations setting out how it will achieve compliance in the shortest possible time 15 in response to a UK Supreme Court ruling 16. The Government is requiring the initial five cities, including Birmingham, named in the 2015 UK Air Quality Plan to draw up full business cases for their local plans by 15 September The government expects local authorities in these cities to deliver their Clean Air Zones by the end of 2019, with a view to achieving statutory NO 2 limit values within the shortest possible time. The government use the Pollution & Climate Mapping (PCM) modelling to define whether the UK is complying with the EU Limit Values. The PCM model in the government s national air quality model which predicts air quality on the major road network across the UK, and reports on the compliance status to the European Commission. The National Plan reports the road links, which comprise relatively long sections of road based on the national traffic survey count sites or Census ID, where the PCM has predicted exceedances of the Limit Values. The government then requires the relevant local authority to undertake local modelling to confirm where exceedances are predicted, which must include all of the PCM road network along with any other roads excluded from the PCM modelling at risk of exceedance. The local authority must then develop plans based on the Clean Air Zone Framework 17 and other guidance, to reduce vehicle pollution in these locations and deliver compliance in the shortest possible time. The government expects Birmingham to deliver their CAZ by the end of 2019, with a view to achieving statutory NO 2 Limit Values within the shortest possible time. The Birmingham CAZ consultation proposals are consistent with the National Plan. 11 Local Air Quality Management Technical Guidance (LAQM.TG (16)). Defra. April Accessed January Local Air Quality Management Policy Guidance (LAQM.PG (16)). Defra. April Accessed January Birmingham AQMA as amended (2005). Accessed February Air Quality Annual Status Report (ASR) for Birmingham City Council. BCC (2017). Accessed January UK Plan for Tackling Roadside Nitrogen Dioxide Concentrations. Detailed plan. Defra/DfT, July Clean Air Zone Framework. Principles for setting up Clean Air Zones in England. Defra. May Accessed June
11 2. Existing Initiatives 2.1 Air Quality Action Plan Since the last update of BCC s AQAP in , a number of actions have been completed, including: Increasing the number of park and ride schemes Increasing the provision of charging infrastructure to encourage the take up of electric vehicles The delivery of improvements to the bus fleet under the Statutory Bus Quality Partnership (SBQP) Setting up an Air Quality Members Steering Group comprised of the Chair of the Public Protection Committee and the Cabinet members for Transportation, Health and Wellbeing, and Clean Streets, Recycling and Environment, to ensure that delivering improved air quality is a key priority integrated into all aspects of the Council s service delivery Setting up an Air Quality Program Delivery Group, chaired by the Director of Public Health, and comprised of senior officers from departments involved in the delivery of programs to improve air quality. Publication of Planning and Procurement Guidance to support Low Emissions Infrastructure via the West Midlands LETC programme. It is proposed to review and update the AQAP once further details of the CAZ implementation are confirmed. 2.2 Taxis and Private Hire Vehicles BCC s proposed policy on emission standards for taxis and private hire vehicles means that these vehicles will need to reach certain emission standards, which will gradually become stricter. Responses to the consultation on this policy are being considered and a final outcome will be published during Under the Birmingham NO x Reduction Champions project, the emissions of 65 of Birmingham s Hackney carriages (black cabs) has been reduced by fitting LPG (liquefied petroleum gas) fuelled engines. These engines are Euro 6 (category N1, class III) compliant, meaning they would not be charged to enter a future CAZ. Additional funding has been awarded by the Office for Low Emission Vehicles (OLEV) to introduce 197 electric taxi charging points, all of which will offer fast or rapid charging facilities for Hackney carriages and private hire vehicles. Electric vehicles would be exempt from charging as part of any future CAZ scheme. 2.3 Freight and Logistics Birmingham s economy relies on the freight and logistics sector working efficiently. Poor air quality is estimated to have cost of up to 2.7 billion nationally, through its impact on productivity in BCC wish to better understand the challenges facing local businesses seeking to improve their fleets, to appreciate the implications of a CAZ for freight operators, and to learn what other measures businesses may be required (e.g. seeking further Government funding to support a transition to cleaner fleets). Addressing air quality presents an opportunity to not only reduce pollution levels in the city, but to open up new economic development and regeneration opportunities within the green economy for alternative fuels, new vehicle and product design, and manufacture supply chains in line with the Government s Industrial Strategy. To this end, businesses were invited to complete a survey during 2017 and to work with the Council towards positive solutions leading to cost savings and more sustainable business operations. The final outcome of this initiative will be reported during Birmingham Air Quality Action Plan. BCC, Accessed February
12 2.4 Other Transport Projects Birmingham Connected 19 covers all transport planning activity and is built on the Birmingham Connected White Paper 20, the city s 20-year transport strategy. Within this scheme, many of the Council s transport projects are focused on reducing pollution emissions and enabling more sustainable modes of transport. Birmingham Cycle Revolution 21 aims to make cycling an everyday way to travel in Birmingham over the next 20 years. The scheme has set a target of 5% of all trips in the city to be made by bicycle by 2023, and to double this again to 10% by In 2017/18, two new, high quality cycle routes are being constructed, linking the city centre to Selly Oak and Perry Barr. Birmingham is creating Green Travel Districts with less congestion, less pollution, fewer accidents, and healthier, safer, more productive communities. In densely populated residential areas, the aim is to create an environment where residents, workers and visitors can safely walk, cycle or take public transport as their preferred travelling option. Alongside the CAZ, the Council is reviewing and extending parking controls in and around the city centre. 2.5 Smoke Control Areas Birmingham was designated as a Smoke Control Area in 1995 to improve air quality. As a result of this, residents are only allowed to burn authorised fuels in an open fireplace or an exempt appliance. Burning coal is not permitted in Birmingham. 2.6 Policies and Strategies Birmingham Connected As mentioned in Section 2.4, The Birmingham Connected White Paper sets out a 20-year vision for transport in the city, including a reduction in emissions from transport and a move to more sustainable transport Low Carbon Fuel Infrastructure In 2015, BCC launched its City Blueprint for Low Carbon Fuel Infrastructure 22. Building on the Birmingham Connected Transport Strategy, the Council has developed a blueprint for low carbon fuel infrastructure. This blueprint identifies the key priorities and opportunities for the refuelling and recharging infrastructure that will be needed to support growing fleets of low and ultra-low carbon vehicles. The blueprint covers electric, hydrogen, gas, methane/ bio-methane and LPG vehicles, and has been developed in close consultation with fleet operators active in the Birmingham area to deliver wide ranging air quality and CO 2 benefits offered by cleaner vehicles West Midlands Low Emission Bus Delivery Plan Birmingham is part of the West Midlands Combined Authority Delivery Plan for Low Emission Buses. The Low Emission Bus Delivery Plan 23 was developed by Transport for West Midlands (TfWM) to facilitate the delivery of low emission buses to help address the region s significant air quality problems. 19 Birmingham Connected. Accessed February Birmingham Connected- Moving Our City Forward: Birmingham Mobility Action Plan White Paper. BCC, Accessed February Birmingham Cycle Revolution. Accessed February A City Blue Print for Low Carbon Fuel Refuelling Infrastructure. Birmingham City Council (2015). Accessed February West Midlands Low Emission Bus Delivery Plan- A Study Commissioned by Centro. Element Energy & Network West Midlands Accessed February
13 It highlights areas where use of low emission buses should be prioritised, by identifying air quality hot-spots, and sets out a timeline for reducing NOx emissions by over 90% by The West Midlands Bus Alliance is a collaboration of local councils and local bus operators, co-ordinated by TfWM, and committed to ensuring that all buses in the region reach a minimum Euro V standard by
14 3. The Case for Further Intervention 3.1 Update on Birmingham s Air Quality Current Position Birmingham is currently compliant with legal limits for PM. However, further reductions are needed (especially to PM 2.5 levels) to protect human health. Annual average PM 10 and PM 2.5 concentrations are well within the legal limit values of 40 and 25µg/m 3 respectively. Although compliance has officially been achieved, by reducing PM concentrations even more, the health benefits will be even greater. In contrast, annual average NO 2 concentrations still exceed the legal limit on several road links in and around Birmingham City Centre. Meeting the NO 2 legal limit poses a huge challenge for many cities in the UK and across Europe. One of the key reasons why ambient levels of NO 2 remain higher than had been previously expected is the driving conditions in urban areas and concerns over the performance of the more recent Euro emissions standards for some diesel vehicles (see Appendix A for more information on Euro standards). In general, Euro standards have failed to reduce oxides of nitrogen (NO x) 24 emissions from light-duty diesel vehicles (e.g. cars and vans), despite tightening emissions standards for NOx. However, Euro VI (for heavy vehicles) is performing well and the standard for light vehicles is still bringing about a significant reduction, albeit not as much as it should. This report only includes discussion of the impacts of any potential measures on NO 2 emissions and concentrations, as this is the pollutant that defines compliances and the definition of the potential CAZ scheme. However, the assessment process has included modelling of PM 10 and PM 2.5, alongside carbon dioxide (CO 2). These data have been used in the overall assessment of the benefits of the scheme and are included in the health impact assessment and distributional analysis Future Year Estimates of Birmingham s Air Quality Birmingham s air quality is expected to improve, although further and more urgent action is required. Emissions from all sources are projected to decrease thanks to technological advances in vehicle design, as well as because of policies and legislation already in place to reduce emissions across the UK and Europe. This includes the roll-out of a new emissions standard for Euro 6 diesel cars and vans which is anticipated to be more successful at reducing pollutants in urban driving conditions than previous standards, and a forthcoming requirement for all vehicles to meet real world driving emissions tests 25. However, although it is expected that PM emissions will remain within legal limits, levels of NO 2 will continue to exceed the legal limits in some areas of Birmingham. Further PM 10 and PM 2.5 reductions by 2021 will mean that annual average concentrations should remain below the legal limits. However, there is a strong case to continue cutting PM concentrations to ensure health benefits, and a compelling need to accelerate the pace of change to achieve this even sooner in order to move towards meeting the WHO recommended guidelines. The proportion of Birmingham City Centre where annual average NO 2 concentrations exceed the legal limit is also expected to decrease by 2020, due to anticipated reductions in background concentrations, ongoing upgrade of the local vehicle fleet and other local interventions. However, modelling indicates that, if nothing further is done, concentrations will continue to exceed the limit on some major roads in and around the City Centre, including the A38, A38M, A4400, A452 and A Vehicle emissions are measured in terms of total NOx. NOx is made up of nitrogen oxide (NO) and NO2, although the NO is subsequently converted into additional NO2 by interaction with ozone in the atmosphere this reaction being dependent on the availability of ozone. 25 Please see appendix A for more details. 14
15 3.2 Areas of Exceedance Whilst air quality remains a problem across Birmingham and the wider West Midlands conurbation, there are areas of the city centre where the problem is more pronounced than others. The modelled 2016 baseline concentrations are presented in Figure 2, showing wide spread exceedances across Birmingham. Table 3-1 shows the estimated percentage of the length of major roads exceeding legal limits in Birmingham, derived from Defra s NO 2 projections data 26 based on the PCM model. In 2020, approximately 0.3 percent of roads in the city centre are forecast to still exceed the limit value for NO 2 with no CAZ in place. Table 3-1 : Defra s Estimated Percentage of Modelled Road Length Exceeding Limits with No Further Action Area % of Road Length Exceeding Limit Values 2015 % of Road Length Exceeding Limit Values 2020 Birmingham City Council
16 4. CAZ Options 4.1 Background to the Proposals In order to meet the EU limit value for annual average NO 2 concentrations, Defra have set out an approach to introduce targeted local measures to tackle the most polluting vehicles in a number of air quality hotspots in a number of cities and primarily urban areas, including Birmingham 27. These measures are intended to reduce air pollution, particularly in urban centres, and to encourage the replacement of the older and most polluting vehicles with more modern, cleaner vehicles. BCC has been directed by the Government to draw up a full business case for its local plan by 15 September 2018 because locations in the city exceed legal levels of NO 2. BCC needs to demonstrate that it is implementing policies to meet compliance in the shortest possible time, but ensuring that this is by 2020 at the latest. It is intended that the implementation of a CAZ will be more than just putting into place an access restriction for vehicles; this would simply constitute a Low Emission Zone (LEZ). In principle, a CAZ should deliver wider benefits, supporting economic growth and accelerating the transition to a low emission economy by raising public awareness and providing financial incentives to accelerate transition. In addition to any access restrictions, a CAZ should promote short-term improvements, such as anti-idling measures and allow for an open dialogue with local businesses about fleet turnover plans, travel plans and healthier travel. Longer term, a CAZ should help support local growth and low-emission ambitions this could include awareness raising, an improved business environment due to the reduced levels of air pollution, and low emission new developments. A key part of a CAZ ambition will be to promote modal shift to cleaner and healthier forms of travel, with the CAZ providing a guide for where new investment in necessary infrastructure may be required. 4.2 Potential Options for Birmingham BCC has commissioned Jacobs to undertake an initial CAZ feasibility study in order to consider what type of CAZ would help Birmingham to meet the EU Limit Values for NO 2 in the shortest possible time. The CAZ is likely to involve a low emission zone, among other actions, to reduce emissions of nitrogen oxides (NOx oxides of nitrogen which are a pre-cursor to NO 2), as well as emissions of NO 2 and other pollutants. In the longer term, it is envisaged that a CAZ will help to improve human health and create a more pleasant environment by introducing quieter vehicles (e.g. electric/hybrid) and potentially due to reduced traffic in some areas less related stress and accidents. Current proposals for Birmingham s CAZ are focused on the City Centre, in the area within and including the Inner Ring Road (A4540). The implementation of a CAZ scheme in Birmingham fits with the Movement for Growth 2026 Transport Delivery Plan produced by Transport for West Midlands (TfWM) 28 ; this in turn supports the West Midland s Combined Authority s Strategic Economic Plan. Measures within these documents are designed to unlock economic growth opportunities and support wider initiatives to improve social well-being and lives of residents. A larger, more economically active population will have diverse transport needs and shifting attitudes to travel and travel behaviour. The implementation of a CAZ will capitalise on those shifts, as well as play a part in the need to transform Birmingham into a sustainable, low-emission city region. Implementation of a CAZ would also contribute towards Birmingham s committed 60% reduction in carbon emissions by 2027 (based on a 1990 baseline) as road vehicle transport currently accounts for ~20% of carbon emissions in Birmingham 29. This report contains an overview of the methodology, data sources and associated outcomes of the processes followed to calculate the vehicle emissions and resulting concentrations of NO 2 in the (2016) base year and (2020) future year scenarios. This technical evidence base has been used to design and evaluate a number of future CAZ options, and to identify what improvements could potentially be delivered at the implementation 27 UK Plan for Tackling Roadside NO2 Concentrations. Detailed Plan. Defra/DfT (July 2017). Accessed January TfWM, Movement for Growth: 2026 Delivery Plan for Transport. 29 BCC, Birmingham s Green Commission-Building a Green City,
17 stage. It also provides a summary of the outputs from the traffic and air quality modelling undertaken, which will inform the development of a wider air quality strategy for Birmingham. Initial considerations have assumed the introduction of policy targeting older vehicles with higher emissions, and the need to discourage non-complaint vehicles from entering the CAZ in order to meet air quality targets. Compliance standards have been based on the Euro-classification of vehicle engines similar to those adopted for London s Ultra Low Emission Zone (ULEZ) and the government s Clean Air Zone Framework 30. Proposed compliance standards for different vehicle types are shown in Table 4-1. Table 4-1 : Proposed Classification Standards for Compliant Vehicles Vehicle Petrol Diesel Car Euro Class 4 and above Euro Class 6 and above Taxi Euro Class 4 and above Euro Class 6 and above Light Goods Vehicle (LGV) Euro Class 4 and above Euro Class 6 and above Heavy Goods Vehicle (HGV) - Euro Class VI and above Bus/ Coach - Euro Class VI and above Defra has identified four classes for the implementation of CAZ s across the UK as per Table 4-2. Table 4-2 : Defra CAZ classes CAZ class A B C D Vehicles included Buses, coaches, taxis (Euro 6/VI). Buses, coaches, taxis and HGVs (Euro 6/VI). Buses, coaches, taxis, HGVs and LGVs (Euro 6/VI diesel and Euro 4 petrol). Buses, coaches, taxis, HGVs, LGVs and cars (Euro 6/VI diesel and Euro 4 petrol). In the absence of any specific guidance on proposed charge rates, this analysis of the impact of Category C and Category D CAZs in Birmingham City Centre has incorporated a range of hypothetical values based on the current London ULEZ rates. These are summarised in Table 4-3. Table 4-3 Potential harging Rates CAZ Proposed Charge Rates Proposed CAZ D Charge Rates Low Low Low Medium Car Taxi LGV HGV Bus/ Coach Clean Air Zone Framework. Principles for setting up Clean Air Zones in England. Defra. May Accessed June
18 5. Traffic Modelling Methodology 5.1 Introduction The air quality modelling process followed a number of sequential steps to calculate the emissions from traffic into NO 2 concentrations. In addition to covering the area in and around the Inner Ring Road (A4540), the model also covered areas beyond the city centre, where it could reasonably be expected that the CAZ would have an impact on the road network as a result of diversion or reduction in traffic volume. In order to provide input traffic data for the air quality model, traffic modelling was undertaken using a variety data sources, research and existing modelling platforms to fully comply with Defra s Joint Air Quality Unit (JAQU) guidance; these included the following timeframes: 2016 Base Year Model 2020 CAZ Opening Year Model Average Weekday morning (AM) / Inter-Peak (IP) / Afternoon (PM) periods The AM period covered 7:30 to 09:30, the IP period covered 09:30 to 15:30 and the PM period covered 15:30 to 19:00. Using these data, annual average daily traffic, and the off-peak (OP) period from 19:00 to 07:30 was also calculated. The traffic model was developed and used to provide traffic for the air quality model, as well as supporting other assessments required for the CAZ evaluation. The model has been developed to forecast 2020 conditions without a CAZ, and also to evaluate the impact of CAZ measures on traffic levels. Outputs from the model were used in several ways: To forecast compliant/ non-compliant link flows, thereby enabling the AQ model to demonstrate levels of compliance with air quality limit values To generate inputs for the impact assessment (IA), cost benefit analysis (CBA) and the distributional impacts. The main tools used in forecasting traffic flows in 2020 are summarised in Table 5-1. Table 5-1 : Traffic Modelling Tools Source BCC Simulation and Assignment of Traffic to Urban Road Networks (SATURN) Model Description SATURN assignment model: 2016 base year and 2020 CAZ scenarios AM, IP and PM peak weekday periods Car (taxis included in 2020 scenarios), LGV, HGV and Bus User Classes, split into compliant and non-compliant categories Covers CAZ zone in detail, with network covering the motorway box. Much of the network outside the CAZ is fixed speed (approx. 2km from the Ring Road) Feeds traffic link flow data into the air quality models Policy Responsive Integrated Strategy (PRISM) Demand Model Regional demand model covering the West Midlands, maintained by Mott MacDonald on behalf of TfWM, BCC and other stakeholders. Inputs from PRISM are: Base year prior matrices 18
19 Source Description Traffic Growth from PRISM, having been updated with Trip End Model Presentation Program (TEMPRO) V7.0 demographic data (with post model adjustments to account for v7.2 changes). TEMPRO is software provided by DfT that provides data from their National Trip End Model (NTEM). To calculate non-route choice responsiveness to charging Automatic number plate recognition (ANPR) Surveys TfL London ULEZ Behavioural Research Internet transport analysis guidance (WebTAG) Defra s Joint Air Quality Unit (JAQU) Guidance A large programme of ANPR surveys carried out in the CAZ area. This has been used to: Validate base year through trip proportions Calculate Euro Class fleet mix TfL carried out a stated preference survey on car drivers in the extended ULEZ area covering an area not in the current congestion charging zone. Used to forecast vehicle upgrade rates from CAZ charging. Modelling follows WebTAG guidance and uses various data sources JAQU guidance and data sources used as appropriate Base Year Model Forecasting utilised the 2016 base year BCC SATURN model, which was calibrated against 2016 traffic data. The base year fleet mix data was derived from ANPR surveys conducted in and around Birmingham City Centre. The survey was undertaken specialist data collection company, Intelligent Data Collection (ID) during a seven-day period in November Cameras were installed at 29 unique locations, supplemented with a further 7 sites which are managed by an independent company, Amey, on behalf of BCC. Figure 3 illustrates the location of each site, with red sites representing cameras positioned around the city centre and blue sites representing a cordon of entry/exit points to the city centre. The collection of vehicle registration plate data was then matched to the Driver and Vehicle Licensing Agency (DVLA) database, which provides further information about the vehicle, including a breakdown of different Euro Class emission standards by vehicle class. The 2016 model results were audited by JAQU in August 2017 and approved for use within subsequent calculations Do Minimum (DM) Scenario The analysis of the 2020 do-minimum scenario involved an evaluation of how base year traffic flows would change by 2020 in the absence of a CAZ or any other currently unapproved schemes. This included a consideration of approved changes to the local road network, regional traffic growth and changes to the traffic fleet Road Network A number of approved changes to the highway network are due to be implemented between 2016 and These changes, which are focused around the proposed City Centre CAZ area were agreed with BCC Transport Studies team and incorporated into the highway model. 31 City Centre Data Collection Report (QU043), Reference: ID02908, 11/04/2017, Issue
20 Discussions with ways England (HE) indicated that schemes that are proposed to be in construction in the period from the end of 2020 are: M40-M42 Interchange M5/M42 Birmingham Box 4 While these roads are on the Birmingham Motorway Box, they are some miles outside of Birmingham and to the south where there are less air quality issues. The roadworks are therefore not likely to have any impacts on air quality within Birmingham, but BCC will work with HE to ensure that any issues with these roadworks are considered when implementing the scheme Traffic Growth to 2020 An evaluation of background traffic growth was undertaken using the PRISM model. This has been recently updated with TEMPRO V7.0 demographics, development locations and network assumptions, with further changes applied to account for changes between TEMPRO V7.0 and V7.2. The sites of specific major developments within Birmingham were agreed with BCC development planners. Traffic impacts resulting from the demand at these developments was incorporated at the appropriate location within the model, whilst also ensuring that there is no double counting of developments already included in PRISM. The overall growth rates that resulted from this process are provided in Table 5-2. Table 5-2 BCC Traffic Growth 2016 to 2020 Sector AM Peak Inter Peak PM Peak Car/ Taxi LGV HGV Car/ Taxi LGV HGV Car/ Taxi LGV HGV City Centre 7.9% 10.8% 3.5% 8.0% 10.8% 3.6% 7.4% 10.8% 3.6% Rest of Birmingham Birmingham (Total) Rest of West Midlands 3.7% 10.7% 3.2% 3.7% 10.7% 3.1% 3.7% 10.7% 3.1% 4.2% 10.7% 3.2% 4.2% 10.7% 3.2% 4.1% 10.7% 3.2% 4.4% 10.6% 2.9% 5.3% 10.7% 2.9% 4.6% 10.8% 3.0% Total 4.3% 10.7% 3.0% 4.7% 10.7% 3.0% 4.4% 10.7% 3.0% Traffic Fleet Future year traffic fleet forecasts were based on guidance provided by JAQU. This enabled typical compositions of future CAZ compliant and non-compliant traffic fleets to be derived for further evaluation. The following assumptions were applied: National forecasts of how fleet proportions of petrol and diesel cars might change in future years were used to correct the local fleet proportions observed in the ANPR surveys. Conventional hybrid vehicles were included within the petrol and diesel car proportions when deriving these estimates. For other vehicle classes, the proportions of petrol and diesel vehicles were retained at the same levels as those observed in the ANPR surveys. It was assumed that the age distribution of vehicles will remain the same, but will increase in line with each additional year. This causes a natural increase in the proportion of compliant vehicles (i.e. a fiveyear-old car in 2020 will be of a higher Euro standard than a five-year-old car in 2016). 20
21 It was assumed there will be no change to the contribution from the electric vehicle fleet beyond assumptions in Defra s Emission Factor Toolkit 32, including plug in hybrids, battery electric or hydrogen vehicles, however this can be included in further evaluation once data becomes available. Based on this evaluation, it was possible to estimate the number of compliant vehicles within the future 2020 do-minimum scenario. This forecast is summarised in Table 5-3. Table 5-3 Non-CAZ Scenario Forecast Compliance Rate Vehicle % Compliance Status (See Table 4-1) Non Compliant Compliant Car 23% 77% LGV 41% 59% HGV 35% 65% Bus 40% 60% Taxi 71% 29% CAZ Scenarios It is assumed that there would be various potential responses to the introduction of charging for trips entering the city centre. This has been modelled hierarchically in the order shown in Table 5-4. Table 5-4 Demand Response Hierarchy Hierarchy Response Method 1 Upgrade to compliant/ switch to already owned compliant vehicles (for households with more than one car) Choice Modelling based on TfL Stated Preference Research for Cars and LGVs Taxis and buses are assumed to upgrade through licencing agreements HGVs users assess value for money over 5- year period as part of decision on whether to upgrade 2 (Car only) Cancel do not make a journey Elasticity to charge derived from PRISM run to apply to Do Minimum trips to/ from the City Change Mode to non-highway PT/ Walk/ Centre. Cycle option Avoid (Change destination from City Centre to non-city Centre trips) Pay (with a city centre origin/ destination) 3 Avoid (through trips change route to non-city Centre route). Pay (through trips use City Centre) BCC CAZ assignment model to forecast diversion due to toll for through trips. Traffic model development was conducted at the journey level to retain compatibility with the vehicle kilometre tables provided within the JAQU technical reports. 32 Emission Factor Toolkit V7.04. Defra (2017). 21
22 Vehicle owners that choose to upgrade to a compliant vehicle have been represented in the model by using TfL's behavioural research for the extended London ULEZ. This research is relevant to Birmingham as it covers an area that is currently free to drive in (rather than the congestion charging area), and therefore captures people that do not currently pay a charge. To ensure that the forecasts reflect local conditions, factors from the TfL research were re-weighted using Birmingham data in the following way: Usage frequency from the ANPR City Centre survey was grouped into low, medium and high frequency in accordance with the following classifications: high (4-7 days a week); medium (2-3 days a week); low (1 day per week) End-user income grouping within the PRISM model was classified as low, medium and high as defined by the following classifications: low <- 35k, medium 35k- 50k, high > 50k The cost to upgrade is a required input to the model, which was calculated based on assumptions published in JAQU s technical appendix to the national air quality plan 33. This resulted in a calculated upgrade cost of 3,100. The following assumptions were applied: Users will change to the cheapest vehicle that is considered to be an upgrade (i.e. a diesel Euro 5 would upgrade to a petrol Euro 4 rather than a diesel Euro 6). The starting cost of a new car is taken as the most popular car in 2016, the Nissan Qashqai, costing 19,080 (new) Standard depreciation rates were applied to derive the cost of compliant cars and non-compliant cars for the different Euro Classes. An average sell cost and buy cost for Birmingham users was derived by using the age profile of the fleet taken from the ANPR survey. This enabled the derivation of appropriate factors which could be applied to non-compliant trips into the City Centre in the Do Minimum model. For the remaining proportion of users that won t upgrade to a new vehicle, the PRISM model was used to estimate what proportion of users with an origin or destination in the city centre would respond by: Paying the charge; Shift to a new mode; Cancel their trip; or Avoid the zone by travelling somewhere else. It is worth noting that this final option is not applicable to those trips with an origin in the city centre. The PRISM model was run with the charges set to the ULEZ value of The PRISM model is not set up to be able to separate compliant and non-compliant vehicles, so could not be used directly to forecast the full responsiveness to the charge. The PRISM demand model outputs provide a large set of demand responses in response to different model inputs, for example: Income segments Journey purposes Origin/ destination pairs with different highways, public transport, and walking / cycling times An average elasticity to charge was calculated by analysing the changes in demand between Do Minimum and CAZ scenarios against the change in generalised costs of each potential City Centre journey. The generalised 33 UK Plan for tackling roadside nitrogen dioxide concentrations, Technical report, Section E, JAQU, July
23 costs were calculated as a sum of journey time costs, vehicle operating costs, charges and parking charges to ensure that costs other than the CAZ charge were considered in the choice. The demand was also analysed within 3 different geographical segments depending on where the trip was generated. Trip generation refers to the home end of a trip, unless it is part of a trip chain, in which case it is modelled as an origin/ destination format. This approach is illustrated in Table 5-5. Table 5-5 : Geographical Responses Geography Trips Generated in the City Centre to outside the City Centre (CC to Non CC) Trips Generated in the City Centre to inside the City Centre (CC to CC) Trips Generated outside of the City Centre to inside the City Centre (Non CC to CC) Response These trips can be cancelled, pay the charge or change mode. No change in destination assumed. For home based trips, no change assumed as there would no way to charge them. For non-home based trips, mode shift or cancelled trip assumed. Pay the charge, mode choice, cancel trip, and change destination is modelled. The analysis was conducted at two journey purpose levels to retain compatibility with the assignment mode: Non Work; and In Work Overall, the model responded sensibly, demonstrating that more people were prepared to pay the charge at lower levels. The mode shift response is small, which indicates that the majority of existing car users either do not have a good public transport alternative or have strong preference. The challenge therefore will be ensuring that, within the Additional Measures programme, good public transport alternatives are explored. To apply these responses to the City Centre assignment model, adjustments were made as per Table 5-6. Table 5-6 : Application of Responses to Assignment Model Response Upgrade Vehicle Mode Shift Cancel Journey Change Destination Modelled The compliant user class is uplifted and the non-compliant reduced The non-compliant car trips to/ from the City Centre are reduced The non-compliant car trips to/ from the City Centre are reduced The non-compliant trips to/ from the city centre are redistributed to outside so that neither trip end is in the City Centre, using the existing demand distribution from the appropriate origin/destination zone outside the city centre For through trips, non-compliant through trips were modelled using route choice in the assignment model. Charges were coded onto links forming a cordon into and out of the City Centre. As the charge is only used for route choice it was only applied in the inbound direction to avoid double charging. Values of time were addressed by converting charges into a generalised journey time, with the model forecasting whether users were prepared to pay for the time savings of making a through trip. Assumptions used in the transport modelling of other vehicle classes are summarised in Table
24 Table 5-7 : Assumptions Used in Modelling Various Vehicle Types Vehicle Type Taxi/ Private Hire Vehicles (PHVs) LGV HGV Bus BCC Fleet Assumptions Made It was assumed that all Birmingham registered taxis and PHVs will upgrade to compliant vehicles, based on policy being developed by BCC. LGVs were assumed to respond by: upgrading their vehicle; pay the charge and continuing to drive into the CAZ; or through the route choice for through trips. TfL s ULEZ behavioural model was used to forecast the response to upgrading the vehicle. It was assumed that LGV users behaviour will more closely reflect car users than HGV users, due to the following: The charges and upgrade costs are similar. The costs used are based on JAQU costings published in their technical report supporting the UK Plan for Tackling Roadside Nitrogen Dioxide Concentrations 34. The approach compared the cost to upgrade over a 5-year period against the cost of paying a charge throughout this period. The costs involved both in upgrading, the charge paid, and the value of the business being carried out, is considerably higher than for the lighter vehicle classes. Users are therefore likely to take a longer-term outlook on whether to upgrade their vehicle. Compliance rates were calculated by applying the following assumptions: Depreciation Rates from JAQU Users will upgrade to cheapest available option Frequency taken from the ANPR survey data, with assumptions of how the vehicle counted once in the week are distributed across the year. The costs were calculated for rigid and artic separately with proportions in the ANPR surveys used to derive the fleet proportions to apply these assumptions to. The effect of CAZ charges on buses was not explicitly modelled as it was assumed that all buses in the CAZ will be compliant, with an out of model adjustment made when applying the results in the AQ model. It was assumed that the full Birmingham fleet will be made compliant. However, using number plate data provided by BCC and matching against the ANPR surveys showed that the proportion of the fleet within the traffic model was too small to include specifically within the modelling. Measures for staff owned vehicles would be an additional measure, and would be considered at a later stage in the study. Full traffic model runs were completed for and CAZ D for three pricing levels for both CAZ types. A summary of the timeframes evaluated is provided below: o AM Peak Weekday Average Hour (07:30-09:30) o Inter Peak Weekday Average Hour (08:30-16:30) o PM Peak Weekday Average Hour (16:30-19:00) 34 UK Plan for tackling roadside nitrogen dioxide concentrations - Technical report, DEFRA/ DfT July
25 Additionally, the following scenarios were evaluated: o 2016 Base Year o 2020 Do Minimum o Low charge, medium charge, high charge o 2020 CAZ D- Low charge, medium charge, high charge The key metrics used to assess the impacts of the CAZ are summarised as follows: Annual Average Daily Flows (AADT) entering the CAZ for compliant and non-compliant flows. This shows the numbers of vehicles driving across the CAZ boundary each day by vehicle type in the different scenarios. Network Plots Showing change in flows graphically across the modelled links to see where flows are increasing and decreasing. Also includes analysis of change in link delay. Key Link Analysis Tables showing changes in flows at key network links at the all-day level Network Statistics Change in vehicle kilometres and average network speed. This provides an aggregate measure of change in network conditions and has been provided by different modelled areas. Outputs from the traffic modelling process were used to produce inputs for a range of air quality models including: o o o o o o 2016 Base Year for model verification 2020 Do Minimum (baseline) high charge 2020 CAZ D- medium charge, high charge high charge plus additional measures 2020 CAZ D- high charge plus additional measures 25
26 6. Outline of The Air Quality Modelling Process 6.1 Traffic Data, Fleet Mix and Emissions Modelled traffic data outputs produced using BCC s Saturn model covered the road network area as shown in Figure 4. The traffic model contains differing level of density of road network coding, with detailed junctions in the centre and speed flow curves used further out, and beyond this the fixed speed buffer area. The buffer area is not validated as part of the Saturn model development process (although the demand flows in PRISM regional transport model are, which is the source for the traffic demand in the BCC model) and therefore traffic data in these locations are considered less reliable. The approach to the transport modelling, and Saturn spatial coverage was initially developed to address the government requirements based on the 2015 Pollution & Climate Mapping (PCM) modelling, which identified exceedance in Birmingham city centre only. The PCM model is the government s national air quality model which predicts air quality on the major road network across the UK, and reports on the compliance status to the European Commission. Following the issue of updated PCM model data in July 2017, JAQU identified potential link exceedances in the 2020 forecasts beyond the city centre. Some of these links were located within the Saturn model buffer zone. The transport modelling approach was subsequently approved by DfT/JAQU, recognising that certainty in the model outputs would be reduced. The air quality modelling in this location is compared with monitoring data, and a verification process applied. However, it is not considered to contain the same level of confidence in results. BCC intends to update and improve the transport modelling to cover these areas of exceedance risk as the project progresses. Additional analysis of the PCM exceedance links in the Saturn model buffer zone has been undertaken comparing all day traffic flows provided from the BCC model for input into the AQ model against DfT traffic counts. This was undertaken at locations close to the PCM exceedance links on Tyburn and Chester Roads and are shown in Table 6-1. Given that the model has not been calibrated in the buffer area, the modelled flows are relatively close to the observed values, and provides some reassurance that traffic conditions are reasonably accurate on these external exceedance links. Table 6-1 : Annual Average Daily Traffic Flows 2016 Road Modelled Vehicles Counted Observed Vehicles Difference % Difference Tyburn Rd (A38 East of M6 junction) 30,688 33,699 3,011 9% Chester Rd (North of M6) 53,041 49,661 3,380 7% Traffic modelling was based on ANPR data collected in September 2016, with additional data fields added by JAQU from sites inside the Inner Ring Road of Birmingham. This data has combined with licence data for Hackney Carriages and Private Hire Vehicles (although limited to BCC licensing) and buses. This data was processed to develop the Euro Standards by class. The analysis indicates that the fleet was older than the national fleet defaults used by Defra s Emission Factor Toolkit (EFT v7.4a) for all vehicle categories, except for diesel LGVs where there was a greater spread in the vehicles ages, including more new diesel LGVs. However, once projected to 2020 the overall effect was that all vehicle categories were older (fewer vehicles of the latest Euro standard) in the local fleet compared to the forecast national average. The fleet mix profiles as input to EFT are presented in Appendix B. 26
27 Traffic data from Saturn were provided for the following categories: Buses (includes coaches) HGVs LGVs Hackney Carriages Private Hire Vehicles (PHV) Cars All have been disaggregated into compliant and non compliant vehicles defined by the CAZ Framework, and cars/hackney carriages/phv have been further disaggregated to petrol and diesel fuel types. ANPR data has been used to develop age and Euro class profiles for each vehicle type/fuel, along with rigid/articulated splits for HGVs. The emissions of NO x, PM 10 and PM 2.5 were calculated for each traffic model period, so that speeds in congested periods were represented. EFT v7.4a (Detailed Option 3) was used to calculate emissions by vehicle type. Hackney carriages and PHVs were included in the car flows, although the age profiles were recorded separately to enable CAZ interventions on these vehicles to be modelled specifically in the CAZ scenarios. The Advanced Options for Euro Compositions outputs was used to determine the proportion of emissions from every link by vehicle type and Euro class based local fleet mixes for the relevant year. These Output % Contributions from Euro Classes were combined with National Atmospheric Emissions Inventory (NAEI) f NO 2 vehicle types 35 to develop link specific f NO 2 for every Road link, and the total NO x and f NO 2 (as NO 2) emissions were input to the dispersion model. The outputs of the dispersion model for NO x and NO 2 at every monitoring site and receptor could be used to calculate the f NO 2 for every output location. 6.2 Air Quality Modelling Set-Up To model air quality, BCC use the Airviro modelling software produced by the Swedish Meteorological and Hydrological Institute (SMHI) and Apertum. The Airviro model was set up to model dispersion of pollutants across a 10m x 10m grid at 2m elevation. The specified locations for receptors and monitoring were then produced by Airviro based on kriging (mathematical interpolation) of the exact grid reference within the 10m grid square. Locations where the EU Limit Values apply are defined in Annex III of the Air Quality Directive. These are defined by sites where the public could be reasonably present, and should be at least 25m from major junctions and be representative of at least 100m road length. The receptor is set 4m back from the road edge, and all PCM roads links are included. Additional receptors were then added where worst-case exposure might occur based on LAQM.TG (16) 36 guidance for relevant annual mean exposure, including at roads not included in the PCM model. Meteorological data for 2016 from Birmingham Airport was used for the assessment, which was converted to a statistical meteorological dataset to reduce runtimes by SMHI. The wind rose for the meteorological data is shown in Figure Air Quality Monitoring Data A total of 99 monitoring sites were reviewed for the model verification process, which compares the model predictions with the measurements of air quality in Birmingham. There are 7 continuous analyser sites located in Birmingham, with 3 sited at background locations and 4 located at roadside locations. However, only one continuous analyser site is located in the city centre at Moor St Queensway, which recorded 52 µg/m 3 NO 2 as an annual mean in Local Air Quality Management Technical Guidance (LAQM.TG (16)). Defra. April Accessed January
28 The positions and measured concentrations of the sites are summarised in Figure 6, and clearly indicate a wide range of exceedances of the 40 µg/m 3 EU Limit values, with measured values at some diffusion tube sites exceeding 70 µg/m 3 NO2. This evidence supports the mandate for taking urgent and effective action across the City Centre at the earliest opportunity. Diffusion tubes were supplied and analysed by Gradko International. Monitoring data for 2016 was collated by BCC and a local bias adjustment factor of was calculated at Stratford Road, and at Tyburn Road background site. These factors show good agreement with the Gradko national diffusion tube survey results. These factors were applied to the 2016 annual mean diffusion tube data for roadside and background sites respectively, which was consistent with the approach used for LAQM reporting in previous years. Measured concentrations at roadside sites with good data capture in 2016 ranged from 29 to 67 µg/m 3. The diffusion tube data was used for verification, and Road NO x back calculated using the Defra NO x to NO 2 calculator v 5.3, with calculated f-no2 from the dispersion modelling input for each site. Monitoring at sites BMH66 to BMH93 was initiated in September 2016, with data available up to July 2017 at the time of verification. The use of four months of data from 2016 would normally be considered inappropriate for use in verification, however, because these sites have been deployed in the vicinity of the road links used in the PCM, they could provide additional information to input to the assessment process. The monitoring data from these sites were therefore annualised using the relationships of other Roadside tubes in the BCC survey for locations running from January 2016 to July Background Air Quality Data Defra 2013 based background maps have been adjusted in accordance with JAQU guidance, and then the total NO x and NO 2 concentrations were compared with values recorded at background monitoring sites during Overall, good agreement was found, and no further adjustment considered necessary. The NO x maps were then processed in order to remove contributions from all roads in each sector, apart from the minor road component, and the NO 2 concentrations were recalculated using the Defra NO 2-Adjustment-for- NO x-sector-removal-tool. 6.5 NOx Chemistry The conversion of modelled Road NO x to NO 2 was undertaken using the Defra NO x to NO 2 calculator v5.3. The dispersion model used link specific f NO 2 emissions, modelled as NO 2. The modelled annual mean Road NO x and f NO 2 for each output point were put into the calculator so that a location specific f NO 2 was applied. 6.6 Model Verification Model verification is the process for comparing the modelled pollutant concentrations with the monitored concentrations for the same pollutant, and where necessary, adjusting the modelled results so they better align with the monitoring data. Given the complexities inherent throughout the model verification process, JAQU and Defra have provided specific guidance to inform this process and assist in the generation of robust data sets. The AQ modelling outputs were converted to NO 2 and then compared to the monitoring data. Only road traffic sites with data capture greater than 75% were used in the verification process, with calendar year data for A total of 44 sites were selected for the verification process. Full details of the verification process are provided in Appendix C. Model verification was undertaken in accordance with Defra s technical guidance document LAQM.TG (16); this involved initial adjustment of Road NO x, with a secondary adjustment factor being applied to the calculated Road NO 2 concentration. The adjusted results were then compared with the monitoring data, which demonstrated improved model performance consistent with the guidance in LAQM.TG (16). 28
29 7. Air Quality Modelling Results 7.1 Baseline Evaluation and Comparison with PCM Local baseline air quality modelling has shown that the air quality issues identified are broadly in line with the national PCM information issued in the National Air Quality Plan with regard to the locations of exceedance of the NO 2 annual mean limit value of 40 µg/m 3. It should be noted that the PCM model does not include minor roads, notably those within the city centre. The results of the BCC (local) modelling are displayed in Figure 7, and PCM data for 2020 is provided in Figure 8. Comparison of the local modelling results for 2020 with the full PCM results shows reasonable agreement between the numbers of locations exceeding the NO 2 annual mean limit value of 40 µg/m 3. Further evaluation of a number of selected points was carried out during the comparison of modelling results (Figure 9). The A38/A4400 Queensway link (PCM_153, Census ID: 81493) yields the highest concentration of 50.5 µg/m 3 in the full PCM model, compared with a predicted concentration of 46.5 µg/m 3 in the local model. The maximum recorded concentration at a PCM receptor point in the local Airviro modelling is further south on the A4400 (PCM_0, Census ID: 81490). A value of 44.1 µg/m 3 was predicted by the Full PCM model, however the local modelling generated a concentration of 48.8 µg/m 3. The local road network in the vicinity of this PCM link is complex so direct comparison is difficult. The maximum modelled concentration generated by the local model at a non-pcm site (49.4 µg/m 3 ) was located at a receptor point in Digbeth (ObjectID_15_@4m), however this receptor point is not included in the PCM model. Other locations with similar levels of predicted concentrations occur on the A4540 Watery Lane Middleway (PCM_6, Census ID: 27736) on the east side of the Inner Ring Road. A value of 46.9 µg/m 3 generated by the local model corresponded with a PCM value of 43.0 µg/m 3. Outside of the city centre, the local modelling does not identify exceedances at the PCM link on the A38 Tyburn Road (Non_PCM_8, Census ID: 16365). The PCM modelling predicts an exceedance (43.2 µg/m 3 ), but the local modelling reports a value of 39.0 µg/m 3. Similarly, the PCM exceedance in northeast Birmingham on the A452 Chester Road (PCM_159, Census ID: 99234) of 45.8 µg/m 3 corresponds with a value of 38.6 µg/m 3 predicted by the local model. However, the local modelling identifies an exceedance at the PCM link on the A5127 Lichfield Road close to the M6 (PCM_60, Census ID: 46398). A value of 40.5 µg/m 3 was reported, which corresponds to a value of 33.3 µg/m 3 in the PCM modelling. The local topography and exposure at this location will be reviewed. The link outside the city centre referred to above is located in the traffic model Buffer zone, so should be treated with additional caution DM Baseline Local baseline air quality modelling has shown that the air quality issues identified are broadly in line with the national PCM information issued in the National Air Quality Plan with regard to the locations of exceedance of the NO 2 annual mean limit value of 40 µg/m 3. It should be noted that the PCM model does not include minor roads, notably those within the city centre (Figure 7). The results of the BCC (local) modelling are displayed in Figure 8, and PCM data for 2020 is provided in Figure 9 29
30 Evaluation of the 2020 DM baseline (as described in Section 7.1) indicated the full extent of predicted exceedances in and around the city centre in the absence of any additional interventions. A breakdown of vehicle emissions or source apportionment was undertaken at a number of specific receptor points inside and outside the CAZ boundary to provide specific information on the emission sources contributing to each exceedance which need to be targeted by the respective CAZ scenarios (Figure 10). The respective source apportionments indicate significant contributions from a number of vehicle classes as summarised in Table 7-1 below: Table 7-1 : Summary of 2020 DM Source Apportionment Results Site Location % Contributions From Respective Vehicle Classes Diesel Cars Petrol Cars Diesel LGVs Rigid HGVs Artic HGVs Buses & Coaches A4400 Suffolk St. Queensway A38 Corporation St A4540 Lawley Middleway- Garrison Circus A4100 Moat Lane, Digbeth Evaluation of two specific CAZ scenarios provided an opportunity to evaluate the impacts of targeting specific vehicle classes as part of a wider strategy, with specific focus on reducing emissions from diesel vehicles. These are clearly indicated as the predominant source of emissions in each of the areas evaluated above, apart from the A4100 (Moat Lane, Digbeth), which is populated with predominantly buses and coaches. 7.3 Basic CAZ Scenarios The following CAZ scenarios were closely examined in order to provide a comparison against the 2020 DM baseline: high charge 2020 CAZ D- medium charge, high charge Further evaluation of this data was carried out to assess the impacts at a number of key locations and a summary is provided in Table 7-2. The full results of the initial dispersion modelling for 2020 are provided in Appendix D. 30
31 Table 7-2 : Summary of Modelled Air Quality CAZ Scenarios Receptor Position Easting Northing Census ID Road Modelled NO 2 Concentration (µg/m 3) DM Additional Reduction in Road NOx Required (After Modelled NO 2 Concentration (µg/m 3) CAZ D Medium CAZ D Additional Reduction in Road NOx Required (After CAZ D high) PCM_0 Inside Ring Road A4400 Suffolk St. Queensway % % PCM_2 Inside Ring A % % Road Corporation St. PCM_6 Outside A % % Ring Road Watery Lane Middleway Non_PCM_ 10 Inside Ring Road N/A Moat Lane % % ( Charge) Initial evaluation of the results indicates that a number of locations within the CAZ boundary will still remain above the NO 2 objective concentration in 2020 (Figure 11). Whilst modelling shows an improvement in overall emissions compared to the 2020 baseline scenario, this option does not achieve a large enough emissions reduction to deliver compliance with EU Limit Values. In 2020, predicted concentrations still exceed the NO 2 Limit Value at 19 modelled receptor locations, including the A38 and Ring Road (compared with 41 exceedances in the Do-Minimum scenario). The highest modelled concentration of 45.0 µg/m 3 NO 2 corresponds to receptor PCM_0 at A4400 Suffolk St. Queensway (Census ID 81490). Source apportionment at each of the locations highlighted in Table 7-2 has been undertaken to provide specific information on the emission sources and further reductions in NOx required to deliver compliance (Figure 12). As expected, comparison between the and the 2020 DM Scenarios indicates a reduction in percentage contributions from LGV and HGV vehicle classes, and an increase in percentage contributions from petrol and diesel cars, which are not charged within the Scenario. The respective vehicle contributions towards emissions in each of these areas are summarised in Table 7-3 below: 31
32 Table 7-3 : Summary of 2020 Charge Source Apportionment Results Site Location % Contributions From Respective Vehicle Classes Diesel Cars Petrol Cars Diesel LGVs Rigid HGVs Artic HGVs Buses & Coaches A4400 Suffolk St. Queensway A38 Corporation St A4540 Lawley Middleway- Garrison Circus A4100 Moat Lane, Digbeth In order to deliver full compliance following implementation of a high charge scenario, additional reductions in NOx of between 11 and 31% are required (outside and inside the CAZ respectively, see Table 7-2 and Figure 12). Unlike other vehicle types, modelling suggests that 17% of LGV drivers with non-compliant vehicles will be prepared to pay the higher charge rather than upgrade. However, current projections indicate that even if 100% of LGVs were of Euro 6 standard, this would not reduce emissions sufficiently to meet the EU Limit value for NO 2. Approximately 70% of vehicle emissions inside the CAZ originate from diesel cars. Under the CAZ Scenario C, there are no charges applied to cars, and therefore no significant change in compliance rates within the CAZ, but there are small increases in car through traffic due to improvement in journey time. Under this scenario, buses and taxis are assumed to have upgraded via licensing agreements CAZ D (Medium Charge) Initial evaluation of the results indicates that a number of locations within the CAZ boundary will still remain above the NO 2 objective concentration in 2020, although a number of minor improvements are observed in comparison with the Medium Charge Scenario (Figure 13). This scenario further improves air quality by reducing emissions from diesel cars, but the medium charge level means that a significant proportion of drivers are likely to pay the charge, rather than upgrade their vehicles. Whilst modelling shows an improvement in overall emissions compared with, this option does not achieve a large enough emissions reduction to deliver compliance with EU Limit Values. In 2020, predicted concentrations still exceed the NO 2 Limit Value at 16 modelled receptor locations, including the A38 and Ring Road. The highest modelled concentration of 43.5 µg/m 3 NO 2 again corresponds to receptor PCM_0 at A4400 Suffolk St. Queensway (Census ID 81490) CAZ D ( Charge) Initial evaluation of the results from the CAZ D Charge Scenario indicates that a number of locations within the CAZ boundary will still remain above the NO 2 objective concentration in 2020 (Figure 14). This scenario further improves air quality by reducing emissions from diesel cars, and the higher charge rate is likely to generate greater uptake of newer compliant vehicles. However, in 2020, predicted concentrations still exceed the NO 2 Limit Value at 12 modelled receptor locations, including the A38 and Ring Road. The highest modelled concentration of 42.7 µg/m 3 NO 2 corresponds to receptor PCM_0 at A4400 Suffolk St. Queensway (Census ID 81490). 32
33 Compared to the charge scenario, NO 2 concentrations are predicted to reduce by an additional 1.8 µg/m 3 with a CAZ D high charge. Based on the predicted diesel car fleet for 2020, diesel car drivers upgrading from non-compliant to compliant vehicles will typically experience a ~25% reduction in NOx emissions per car. The willingness to pay by LGV drivers remains unaffected from the scenario. Under these conditions, approximately 59% of vehicle emissions inside the CAZ will still originate from diesel cars. This is illustrated in Figure 15, which provides a source apportionment at each of the locations highlighted in Table 7-2. As expected, the respective source apportionments indicate significant reductions in contributions from diesel cars and petrol cars in comparison with the scenario, as these are now included within the charging structure. General emission contributions from the various vehicle classes are summarised in Table 7-4 below: Table 7-4 : Summary of 2020 CAZ D Charge Source Apportionment Results Site Location % Contributions From Respective Vehicle Classes Diesel Cars Petrol Cars Diesel LGVs Rigid HGVs Artic HGVs Buses & Coaches A4400 Suffolk St. Queensway A38 Corporation St A4540 Lawley Middleway- Garrison Circus A4100 Moat Lane, Digbeth In order to deliver full compliance following implementation of a CAZ D high charge scenario, additional reductions in NOx of between 4 and 19% are required (outside and inside the CAZ respectively, see Table 7-2 and Figure 15). It can therefore be concluded that additional mitigation measures would be required to support a potential charging CAZ scheme in order to achieve compliance within the shortest possible timescale. 7.4 CAZ Plus Additional Measures Overview Additional Measures are a series of supporting interventions identified to support a potential charging CAZ scheme in delivering compliance. They will take into account the outputs of the CAZ traffic and air quality modelling and using the appraisal process they identify which interventions are likely to close the emissions compliance gap between the target of annual mean concentration levels of 40µg/m 3 for NO 2 and the levels modelled. The measures have been chosen to consider the source apportionment data provided above and the potential type of CAZ that will be implemented. The measures must support the implementation of CAZ to achieve compliance in the shortest time possible. Table 7-2 indicates how much the traffic emissions must be reduced by to further improve air quality and deliver compliance. A range of additional measures have been proposed for further testing and refinement. The additional measures are aimed at reducing emissions from vehicles and encouraging modal shift from car to bus with either the high or CAZ D high scheme in place. The package of measures evaluated is summarised in Table
34 Table 7-5 : Package of Additional Measures Type Summary Comments Recommended for further consideration? Fleet Upgrades Fleet 1: 85 Hackney Carriage Upgraded to Electric vehicles 441 Private Hire Vehicles Upgraded to Electric Vehicles 65 Hackney Carriages retrofitted to LPG Assumptions agreed with BCC. An electric vehicle upgrade is estimated to remove 1.6% of total vehicle kilometres from the City Centre network in a CAZ D scenario. Given that taxis and PHVs are upgraded, the AQ impacts are reduced. Yes Fleet 2: Zero emission buses (new Hydrogen buses) It is assumed that these will be used to add additional capacity on specific routes (so no change to emissions from CAZ Scenarios). If we assume no increases in numbers of buses running, this could be applied to specific bus corridors to reduce bus emissions, e.g. Digbeth. Yes Parking Remove all free parking from BCC controlled areas. Replace with paid parking spaces. Assume cost of parking in line with BCC off-street parking. Around 15% of traffic parking in the City Centre currently parks on free on street parking. Transport modelling indicates that this will reduce car demand with free parking by around 30%. This leads to around a 2.5% reduction in overall vehicles kilometres, resulting in a reasonably significant reduction in emissions, although this is limited in the key locations (failing the legal limits) as the impacts are focused on the outer areas of the City Centre. An additional benefit is that it raises revenues of the City Centre which will be reinvested in mitigating the effects of the CAZ. Yes Network Changes Network 1: Ban traffic entering (southbound) or leaving (northbound) Suffolk Street Queensway (A38) from Paradise Circus, other than local access. Provides a reduction in overall traffic levels and reduces delays on the A38 at a key exceedance location. Reduces traffic through Paradise Circus an area with high pedestrian flows linking one of Birmingham s main cultural quarters, to the shopping/ business district and New Street Station. Paradise is the focus of one the city centre s main masterplan areas, so removing traffic will support this regeneration. Yes Network 2: Close Lister Street and Great Lister Street at the junction with Dartmouth Middleway. Reduction in delay on the A4540 ring road, including less traffic needing to stop (and accelerate away from the junction) due to the removal of the signal stage for traffic crossing the road. This also provides a mitigation for increases in traffic caused by the CAZ charge for through trips on the A38. Yes Network 3: Ban on CAZ through trips for all vehicle types. Provides significant improvement to air quality in the City Centre. However, this causes significant increases on the Eastern section of the ring road which exceeds the legal NO2 limits. In addition, the model shows large increases on local roads outside of the CAZ area which worsens AQ on these local residential roads. There are also issues with the practicality of implementing this option on the ground. No Network 4: Ban on CAZ through trips for LGV and HGV vehicles. or D on the Eastern section of the ring road. As Above. No 34
35 Type Summary Comments Recommended for further consideration? Network 5: or D on the ring Eastern section of the ring road. Significant diversion to local roads outside the CAZ, increasing emissions on these smaller residential roads. There is a need to reduce overall traffic (not just noncompliant) to meet compliance so the CAZ does not solve the issue on its own. On the worst road, even if all non-compliant vehicles were removed the road would still be non-compliant due to weight of traffic No Public Transport 4 improved bus corridors agreed with TfWM (see Figure 16). Potential delivery by Impact on mode shift forecast to be small, less than 1% reduction in overall trips into the City Centre, with high costs to implement. No Modelling of the package tests alongside both and CAZ D scenarios has been completed in order to assess their effectiveness and determine the relative impacts. A summary of the results of the initial dispersion modelling for 2020 are provided in Table 7-6 and the full modelling results are presented in Appendix E. Percentage changes in NO 2 concentrations are presented for each Additional Measure + CAZ scenario compared with the respective CAZ scenario baseline. 35
36 Table 7-6 : Summary of Dispersion Modelling Results from Additional Measures Packages Modelled NO2 Concentration µg/m 3 36 Receptor Position Easting Northing Census ID Road 2020 DM CAZ D Additional Measures Additional Measures % NOx Reduction Required After + Additional Measures % NOx Reduction Required After CAZ D + Additional Measures PCM_0 Inside Ring Road A4400 Suffolk St. Queensway % -19% PCM_2 Inside Ring Road A38 Corporation St % -3% PCM_6 Outside Ring Road A4540 Watery Lane Middleway % -11% Non_PCM_10 Inside Ring Road N/A Moat Lane N/A N/A
37 7.4.2 Plus Additional Measures The outputs from this scenario are summarised in Table 7-7 and Figure 17 and show significant improvements when the additional measures are implemented alongside the scenario, reducing the total number of exceedances from 19 to 17 (See Appendix E). The maximum modelled concentration of 45.1µg/m 3 at Suffolk St Queensway (PCM_0, Census ID 81490) indicates a slight increase at this receptor. Here, it is considered that the local road network in the vicinity of this PCM link is complex, so direct comparison with the PCM network remains difficult. Other locations on the A38 demonstrate reductions from 0.1 to 0.3 µg/m 3 in NO 2, and additional exceedances are observed along the A38. Beyond the A38, the other location demonstrating an exceedance inside the CAZ is at Digbeth. Here, LAQM (non-pcm) exposure is at the first floor level, so the modelled outputs at ground level are likely to be an overestimate, and the exposure isn t likely to be realistic. At this receptor, significant reductions of up to 1.8 µg/m 3 NO 2 are predicted (ObjectID_15_@4m). NO 2 concentrations along the Ring Road at A4540 Lawley Middleway - Garrison Circus (PCM_6, Census ID 17998) increase from 41.8 µg/m 3 to 42.0 µg/m 3 (an increase of ~1% on with no additional measures). Further north, on the A4540 at Dartmouth Middleway (PCM_4, Census id 7676), NO 2 concentrations are reduced by ~1% from 41.7 µg/m 3 to 41.2 µg/m 3. The respective source apportionments are summarised in Figure 18, which indicate significant contributions from a number of vehicle classes as summarised in Table 7-7 below. Table 7-7 : Summary of CAZ D Charge Plus Additional Measures Source Apportionment Results Site Location % Contributions From Respective Vehicle Classes Diesel Cars Petrol Cars Diesel LGVs Rigid HGVs Artic HGVs Buses & Coaches A4400 Suffolk St. Queensway A38 Corporation St A4540 Lawley Middleway- Garrison Circus A4100 Moat Lane, Digbeth In order to deliver full compliance following implementation of a high charge with additional measures scenario, additional reductions in NOx of between 14 and 31% are required (outside and inside the CAZ respectively, see Table 7-6 and Figure 18). Receptor Non_PCM_10 (A4100 at Digbeth) is fully compliant under this scenario, so no further reductions in NOx are required CAZ D Plus Additional Measures The outputs from this scenario are summarised in Table 7-8 and Figure 19 and show significant improvements when the additional measures are implemented alongside the CAZ D scenario, reducing the total number of exceedances from 12 to 10 (See Appendix E). Inside the CAZ boundary, the largest reductions in road NO x contributions are observed in Digbeth, due to the closure of Moor Street Queensway. Here, reductions of up to 10% in road NOx contributions are observed, compared to typical values of around 2% at other locations within the CAZ. As in the Plus Additional Measures scenario, the maximum modelled concentration of 42.7µg/m 3 at Suffolk St Queensway (PCM_0, Census ID 81490) remains unaltered. Here, it is considered that the local road network in the vicinity of this PCM link is complex, so direct comparison with the PCM network remains difficult. Other locations on the A38 demonstrate reductions from 0.1 to 0.3 µg/m 3 in NO 2, and additional exceedances are observed along the A38. 37
38 Beyond the A38, the other location demonstrating an exceedance inside the CAZ is at Digbeth. Here, LAQM (non-pcm) exposure is at the first floor level, so the modelled outputs at ground level are likely to be an overestimate, and the exposure isn t likely to be realistic. At this receptor, significant reductions of up to 1.5 µg/m 3 NO 2 are predicted (ObjectID_15_@4m). NO 2 concentrations along the Ring Road at A4540 Lawley Middleway - Garrison Circus (PCM_6, Census ID 17998) increase from 41.4 µg/m 3 to 41.5 µg/m 3 (an increase of ~1% on CAZ D with no additional measures). Further north, on the A4540 at Dartmouth Middleway (PCM_4, Census id 7676), NO 2 concentrations are reduced by ~1% from 40.8 µg/m 3 to 40.3 µg/m 3. The respective source apportionments are summarised in Figure 20, which indicate significant contributions from a number of vehicle classes as in Table 7-8 summarised below: Table 7-8 : Summary of 2020 CAZ D Charge Plus Additional Measures Source Apportionment Results Site Location % Contributions From Respective Vehicle Classes Diesel Cars Petrol Cars Diesel LGVs Rigid HGVs Artic HGVs Buses & Coaches A4400 Suffolk St. Queensway A38 Corporation St A4540 Lawley Middleway- Garrison Circus A4100 Moat Lane, Digbeth In order to deliver full compliance following implementation of a CAZ D high charge with additional measures scenario, additional reductions in NOx of between 3 and 19% are required (outside and inside the CAZ respectively, see Table 7-6 and Figure 20). Receptor Non_PCM_10 (A4100 at Digbeth) is fully compliant under this scenario, so no further reductions in NOx are required. Beyond CAZ D, the limited effect of the additional measures (such as taxi and bus improvements and reduced parking) may be caused by the closure of Moor St Queensway, resulting in rerouting traffic onto the A38 and Middleway. Overall, this represents the most effective scenario evaluated to date, however, further work would still be required to achieve compliance with the EU Limit values in all areas. 38
39 8. Conclusions This report contains a description of the factors driving implementation of the CAZ, the existing measures being undertaken by BCC to improve air quality, and an evaluation of the potential air quality benefits which could be delivered by the implementation of a potential charging CAZ with appropriate supporting additional measures. The results of the traffic and air quality modelling undertaken to date have demonstrated that implementation of a charging class C or class D Clean Air Zone (CAZ), in the absence of supporting additional measures, would be insufficient to deliver full compliance with EU Limit Values for annual mean NO 2. Under a class C CAZ (with Charge) based on the boundary of the Inner Ring Road, exceedances of the EU Limit for NO 2 are still predicted to occur on the A38 and Ring Road in It is estimated that additional reductions of up to 11% and 31% of total oxides of nitrogen (NO x) would be required, outside and inside the CAZ, respectively, to achieve compliance with the Limit Value. Even if all the vehicles restricted by category C which entered the zone had a compliant engine, the levels of NO 2 would still be too great. This reflects the fact that over 80% of the vehicles entering the CAZ area are private cars (or private hire vehicles) and these are not restricted by a scheme. Under a class D CAZ (where non-compliant cars are subject to charging), concentrations of NO 2 reduce by an additional 1.5 µg/m 3 inside the CAZ (with a medium charge), and by 1.8 µg/m 3 for a high charge, beyond the high scenario. There are still places, however, where the legal limits are predicted to be exceeded on the A38 and Ring Road. It is estimated that additional reductions of up to 9% and 19% NOx are required, outside and inside the CAZ respectively, to remove these exceedances. A number of additional measures which could be applied to support the various CAZ options have been evaluated, including upgrade to buses and taxis, removal of free parking, changes to the road network and upgrades to bus corridors. With a Charge Plus Additional measures scheme in place, dispersion modelling shows that by 2020, the total number of exceedances is predicted to reduce from 19 (in the Scenario) to 17 (in the Plus Additional Measures scenario). In order to deliver full compliance, additional reductions in NOx of between 14 and 31% will still be required. The CAZ D Charge Plus Additional Measures scheme is predicted to deliver greater improvements by 2020, reducing the total number of exceedances from 12 (in the CAZ D Scenario) to 10 (in the CAZ D Plus Additional Measures scenario). In order to deliver full compliance, additional reductions in NOx of between 3 and 19% would still be required. Overall, the CAZ D Plus Additional Measures Scheme represents the most effective scenario evaluated to date. However, since modelling the most stringent possible measures still hasn t led to compliance, BCC will be looking at achieving compliance in This is beyond the year assumed in the national modelling for the 2017 Plan because detailed local modelling presented in this report has shown that the problem is worse (in terms of number of sites over limit value and the fact that a number of sites over the limit value are outside of the city centre). 39
40 / Legend Lichfield FIGURE 1 Walsall Birmingham Air Quality Management Area Wolverhampton Sandwell North Warwickshire Birmingham Dudley 0 04/05/2018 Initial Issue GH Rev. Date Purpose of revision Drawn Check'd Rev'd Appr'd 7th Floor, 2 Colmore Square, 38 Colmore Circus, Queensway, Birmingham, B4 6BN Tel: +44 (0) Fax: +44.(0) Client Solihull Project BIRMINGHAM CLEAN AIR ZONE Bromsgrove Drawing Title BIRMINGHAM AIR QUALITY MANAGEMENT AREA A3 Jacobs No. 1:100,000 B DO NOT SCALE km \\GBBHM1-FIL003\Projects\B3553P06 - SSBU_Air Quality_Minor Work\Birmingham CAZ\CAZ AQ Reporting January 2018_GH\70. GH Report\Figures\B _004_Rev0_AQMA1_10_3.mxd Contains OS data Crown Copyright and database right 2017 This drawing is not to be used in whole in or part other than for the intended purpose and project as defined on this drawing. Refer to the contract for full terms and conditions.
41 / FIGURE 2 Legend Modelled NO 2 Concentration (µg/m 3 ) < >50 Proposed CAZ boundary Modelled Road Network 0 23/05/2018 Rev. Client Date Initial Issue Purpose of revision GH Drawn Check'd Rev'd Appr'd 7th Floor, 2 Colmore Square, 38 Colmore Circus, Queensway, Birmingham, B4 6BN Tel: +44 (0) Fax: +44.(0) Project BIRMINGHAM CLEAN AIR ZONE Drawing Title ANNUAL MEAN NO 2 CONCENTRATIONS BASE km A3 Jacobs No. 1:20,000 B DO NOT SCALE \\GBBHM1-FIL003\Projects\B3553P06 - SSBU_Air Quality_Minor Work\Birmingham CAZ\CAZ AQ Reporting January 2018_GH\70. GH Report\Figures\B _003_Rev0_2016_BASE_10_3.mxd Contains OS data Crown Copyright and database right 2017 This drawing is not to be used in whole in or part other than for the intended purpose and project as defined on this drawing. Refer to the contract for full terms and conditions.
42 8 ") 1-2 ") 2 ") 1-1 S007 ") S004 ") ") ") S ") Legend FIGURE 3 Automatic Number Plate Recognition survey location ") External site ") Internal site S002 ") 3 ") 17-1 ") 17-2 ") ") ") ") 14-3 ") ") ") 18-2 ") 15-4 ") ") 9 ") 11 ") ") ") 13-4 ") S001 ") 6 ") 4 ") 12-1 ") S005 ") 0 23/05/2018 Rev. Date Initial Issue Purpose of revision GH Drawn Check'd Rev'd Appr'd 12-2 ") 7th Floor, 2 Colmore Square, 38 Colmore Circus, Queensway, Birmingham, B4 6BN Tel: +44 (0) Fax: +44.(0) ") Client S006 ") 5 ") Project Drawing Title BIRMINGHAM CLEAN AIR ZONE BCC ANPR CAMERA LOCATIONS 10 ") A3 Jacobs No. 1:10,967 B DO NOT SCALE km Contains OS data Crown Copyright and database right 2017 This drawing is not to be used in whole in or part other than for the intended purpose and project as defined on this drawing. Refer to the contract for full terms and conditions. \\GBBHM1-FIL003\Projects\B3553P06 - SSBU_Air Quality_Minor Work\Birmingham CAZ\CAZ AQ Reporting January 2018_GH\70. GH Report\Figures\B _002_Rev0_ANPR_10_3.mxd
43 / Legend FIGURE 4 Birmingham borough Modelled road network Speed Flow Zone Detailed Zone Buffer Zone 0 04/05/2018 Initial Issue GH Rev. Date Purpose of revision Drawn Check'd Rev'd Appr'd 7th Floor, 2 Colmore Square, 38 Colmore Circus, Queensway, Birmingham, B4 6BN Tel: +44 (0) Fax: +44.(0) Client Project BIRMINGHAM CLEAN AIR ZONE Drawing Title SATURN MODEL ZONING A3 Jacobs No. 1:60,000 B DO NOT SCALE km \\GBBHM1-FIL003\Projects\B3553P06 - SSBU_Air Quality_Minor Work\Birmingham CAZ\CAZ AQ Reporting January 2018_GH\70. GH Report\Figures\B _001_Saturn Model Zoningb_10_3.mxd Contains OS data Crown Copyright and database right 2017 This drawing is not to be used in whole in or part other than for the intended purpose and project as defined on this drawing. Refer to the contract for full terms and conditions.
121 237 4000 Fax: +44.(0)121.237.4001 www.jacobs.")
44 FIGURE /04/2018 Initial Issue GH Rev. Date Purpose of revision Drawn Check'd Rev'd Appr'd 7th Floor, 2 Colmore Square, 38 Colmore Circus, Queensway, Birmingham, B4 6BN Tel: +44 (0) Fax: +44.(0) Client Project BIRMINGHAM CLEAN AIR ZONE Drawing Title WIND ROSE FROM BIRMINGHAM AIRPORT METEOROLOGICAL STATION (2016) A3 Jacobs No. B DO NOT SCALE This drawing is not to be used in whole in or part other than for the intended purpose and project as defined on this drawing. Refer to the contract for full terms and conditions. \\GBBHM1-FIL003\Projects\B3553P06 - SSBU_Air Quality_Minor Work\Birmingham CAZ\CAZ AQ Reporting January 2018_GH\70. GH Report\Figures\B _002_Rev0_wind rose_10_3.mxd
 BHM29 BHM22 BHM7 BHM31 BHM23 BHM8 BHM65 BHM33 BHM21 BHM84 BHM30 BHM25 BHM83 Diffusion tube <30 30-40")
\") BHM15 BHM17 BHM18 \") 30-40 \") 40-50 \") 50-60 \") 60-70")


 BHM19 0 100 200 300 400 m")

45 INSET A BHM68 BHM69 BHM67 BHM93 BHM66 BHM85 BHM27 New Hall ") / Legend FIGURE 6 Monitored NO 2 concentrations µg/m 3 BHM70 BHM71 BHM72 BHM87 BHM16 BHM86 BHM90 SEE INSET B BHM24 BHM26 BHM89 ") BHM29 BHM22 BHM7 BHM31 BHM23 BHM8 BHM65 BHM33 BHM21 BHM84 BHM30 BHM25 BHM83 Diffusion tube < >70 Continuous monitoring station ") <30 BHM37 BHM73 BHM51 BHM74 BHM92 BHM75 BHM m BHM77 BHM78 BHM82 BHM81 BHM80 BHM79 BHM9 Birmingham Tyburn Roadside BHM13 BHM14 ")") BHM15 BHM17 BHM18 ") ") ") ") ") >70 Modelled road network SEE INSET A BHM91 ") INSET B BHM11 BHM12 ") BHM5 BHM6 BHM57 Bristol Road BHM20 ") BHM2 BHM3 BHM4 BHM1 Acocks Green ") BHM28 BHM88 BHM63 BHM62 BHM38 BHM39 BHM43 BHM40 BHM44 BHM36 BHM42 BHM61 BHM46 BHM41 BHM35 BHM45 BHM60 BHM47 BHM48 BHM59 BHM49 BHM34 BHM56 BHM50 BHM58 ") Moor Street Queensway BHM52 BHM54 BHM53 BHM64 BHM55 BHM /04/2018 Rev. Client Project Date Drawing Title Initial Issue Purpose of revision 7th Floor, 2 Colmore Square, 38 Colmore Circus, Queensway, Birmingham, B4 6BN Tel: +44 (0) Fax: +44.(0) BIRMINGHAM CLEAN AIR ZONE GH Drawn Check'd Rev'd Appr'd MONITORED ANNUAL MEAN NO 2 CONCENTRATIONS: 2016 (µg/m 3 ) BHM m BHM65 A3 Jacobs No. 1:70,000 B DO NOT SCALE km \\GBBHM1-FIL003\Projects\B3553P06 - SSBU_Air Quality_Minor Work\Birmingham CAZ\CAZ AQ Reporting January 2018_GH\70. GH Report\Figures\B _001_Rev0_no2results10_3.mxd Contains OS data Crown Copyright and database right 2017 This drawing is not to be used in whole in or part other than for the intended purpose and project as defined on this drawing. Refer to the contract for full terms and conditions.
46 / FIGURE 7 Legend Modelled NO 2 Concentration (µg/m 3 ) < >45 Proposed CAZ boundary Modelled Road Network 0 23/05/2018 Rev. Date Initial Issue Purpose of revision GH Drawn Check'd Rev'd Appr'd Client 7th Floor, 2 Colmore Square, 38 Colmore Circus, Queensway, Birmingham, B4 6BN Tel: +44 (0) Fax: +44.(0) Project Drawing Title BIRMINGHAM CLEAN AIR ZONE ANNUAL MEAN NO 2 CONCENTRATIONS DM BASE km \\GBBHM1-FIL003\Projects\B3553P06 - SSBU_Air Quality_Minor Work\Birmingham CAZ\CAZ AQ Reporting January 2018_GH\70. GH Report\Figures\B _003_Rev0_2020DM_10_3.mxd Contains OS data Crown Copyright and database right 2017 A3 Jacobs No. 1:20,000 B DO NOT SCALE This drawing is not to be used in whole in or part other than for the intended purpose and project as defined on this drawing. Refer to the contract for full terms and conditions.
121 237 4000 Fax: +44.(0)121.237.4001 www.jacobs.")
47 / Legend FIGURE 8 PCM 2020 NO 2, ug/m 3. Data provided by JAQU in July < >50 Birmingham borough 0 25/04/2018 Initial Issue GH Rev. Date Purpose of revision Drawn Check'd Rev'd Appr'd 7th Floor, 2 Colmore Square, 38 Colmore Circus, Queensway, Birmingham, B4 6BN Tel: +44 (0) Fax: +44.(0) Client Project BIRMINGHAM CLEAN AIR ZONE Drawing Title POLLUTION CLIMATE MAPPING 2020 A3 Jacobs No. 1:95,000 B DO NOT SCALE km \\GBBHM1-FIL003\Projects\B3553P06 - SSBU_Air Quality_Minor Work\Birmingham CAZ\CAZ AQ Reporting January 2018_GH\70. GH Report\Figures\B _004_Rev0_pcm10_3.mxd Contains OS data Crown Copyright and database right 2017 This drawing is not to be used in whole in or part other than for the intended purpose and project as defined on this drawing. Refer to the contract for full terms and conditions.
121 237 4000 Fax: +44.(0)121.237.4001 www.jacobs.")
48 / FIGURE 9 Legend PCM Discussion Points Birmingham borough Modelled road network Speed Flow Zone Detailed Zone Buffer Zone Digbeth /04/2018 Initial Issue GH Rev. Date Purpose of revision Drawn Check'd Rev'd Appr'd 7th Floor, 2 Colmore Square, 38 Colmore Circus, Queensway, Birmingham, B4 6BN Tel: +44 (0) Fax: +44.(0) Client Project BIRMINGHAM CLEAN AIR ZONE Drawing Title PCM DISCUSSION POINTS A3 Jacobs No. 1:60,000 B DO NOT SCALE km \\GBBHM1-FIL003\Projects\B3553P06 - SSBU_Air Quality_Minor Work\Birmingham CAZ\CAZ AQ Reporting January 2018_GH\70. GH Report\Figures\B _001_PCM Discussion Map_10_3.mxd Contains OS data Crown Copyright and database right 2017 This drawing is not to be used in whole in or part other than for the intended purpose and project as defined on this drawing. Refer to the contract for full terms and conditions.
49 A38 Inside CAZ (between Children's Hospital and Dartmouth Circus) Rigid HGVs 13% Diesel LGVs 22% Artic HGVs 2% Rigid HGVs 14% Diesel LGVs 25% Artic HGVs 2% Petrol LGVs 0% Buses/Coaches 3% Buses/Coaches 0% Petrol Cars 6% Petrol Cars 6% Diesel Cars 54% Suffolk St Queensway (Near Beak St) PCM_161 PCM_0 PCM_2 Non_PCM_10 PCM_6 / FIGURE 10 Legend Modelled NO 2 Concentration (µg/m 3 ) < >45 Proposed CAZ boundary Modelled Road Network Petrol LGVs 0% Diesel Cars 53% Petrol Cars 3% A4100 Digbeth Diesel Cars 25% Petrol LGVs 0% A540 Lawley Middleway- Garrison Circus Artic HGVs 4% Buses/Coaches 0% Petrol Cars 5% 0 08/06/2018 Rev. Client Date Initial Issue Purpose of revision GH Drawn Check'd Rev'd Appr'd 7th Floor, 2 Colmore Square, 38 Colmore Circus, Queensway, Birmingham, B4 6BN Tel: +44 (0) Fax: +44.(0) Rigid HGVs 28% Project Drawing Title BIRMINGHAM CLEAN AIR ZONE Buses/Coaches 49% Artic HGVs 2% Rigid HGVs 13% Diesel LGVs 8% km \\GBBHM1-FIL003\Projects\B3553P06 - SSBU_Air Quality_Minor Work\Birmingham CAZ\CAZ AQ Reporting January 2018_GH\70. GH Report\Figures\B _005_Rev0_2020DMSA_10_3.mxd Diesel LGVs 21% Petrol LGVs 0% Diesel Cars 42% Contains OS data Crown Copyright and database right 2017 A3 Jacobs No. LOCATIONS OF KEY NO 2 ECEEDANCE AND SOURCE APPORTIONMENT WITH DO-MINIMUM (DM) SCENARIO (2020) 1:20,000 B DO NOT SCALE This drawing is not to be used in whole in or part other than for the intended purpose and project as defined on this drawing. Refer to the contract for full terms and conditions.
50 / Legend FIGURE 11 Modelled NO 2 Concentration (µg/m 3 ) < Proposed CAZ boundary Modelled Road Network 0 31/05/2018 Rev. Client Date Initial Issue Purpose of revision GH Drawn Check'd Rev'd Appr'd 7th Floor, 2 Colmore Square, 38 Colmore Circus, Queensway, Birmingham, B4 6BN Tel: +44 (0) Fax: +44.(0) Project BIRMINGHAM CLEAN AIR ZONE Drawing Title ANNUAL MEAN NO 2 CONCENTRATIONS HIGH CHARGE km A3 Jacobs No. 1:20,000 B DO NOT SCALE \\GBBHM1-FIL003\Projects\B3553P06 - SSBU_Air Quality_Minor Work\Birmingham CAZ\CAZ AQ Reporting January 2018_GH\70. GH Report\Figures\B _003_Rev0_2020CAZCHIGH_10_3.mxd Contains OS data Crown Copyright and database right 2017 This drawing is not to be used in whole in or part other than for the intended purpose and project as defined on this drawing. Refer to the contract for full terms and conditions.
51 Rigid HGVs 3% Diesel LGVs 20% Rigid HGVs 3% A38 Inside CAZ (between Children's Hospital and Dartmouth Circus) Artic HGVs 1% Diesel LGVs 21% Artic HGVs 0% Buses/Coaches 0% Buses/Coaches 0% Petrol Cars 8% Petrol Cars 8% Diesel Cars 68% NO 2 Conc: µg/m 3 Without CAZ: 46.6 With : 42.6 Req'd extra reduction: -18% Suffolk St Queensway (Near Beak St) NO 2 Conc: µg/m 3 Without CAZ: 48.8 With : 45.0 Req'd extra reduction: -31% PCM_161 PCM_0 PCM_2 Non_PCM_10 PCM_6 / FIGURE 12 Legend Modelled NO 2 Concentration (µg/m 3 ) < Proposed CAZ boundary Modelled Road Network Buses/Coaches 23% Artic HGVs 2% Rigid HGVs 8% Diesel LGVs 14% Petrol Cars 5% Diesel Cars 68% A4100 Digbeth Diesel Cars 48% km NO 2 Conc: µg/m 3 Without CAZ: 46.4 With : 41.5 Req'd extra reduction: -11% \\GBBHM1-FIL003\Projects\B3553P06 - SSBU_Air Quality_Minor Work\Birmingham CAZ\CAZ AQ Reporting January 2018_GH\70. GH Report\Figures\B _005_Rev0_2020CAZCHIGHSA_10_3.mxd Rigid HGVs 25% Artic HGVs 6% Diesel LGVs 22% Buses/Coaches 0% A4540 Lawley Middleway - Garrison Circus Petrol Cars 5% Diesel Cars 42% NO 2 Conc: µg/m 3 Without CAZ: 46.9 With : 41.8 Req'd extra reduction: -11% Contains OS data Crown Copyright and database right /05/2018 Rev. Client Project Date Drawing Title A3 Jacobs No. 7th Floor, 2 Colmore Square, 38 Colmore Circus, Queensway, Birmingham, B4 6BN Tel: +44 (0) Fax: +44.(0) :20,000 B Initial Issue Purpose of revision BIRMINGHAM CLEAN AIR ZONE GH Drawn Check'd Rev'd Appr'd LOCATIONS OF KEY NO 2 ECEEDANCE AND SOURCE APPORTIONMENT WITH (HIGH CHARGE) SCENARIO (2020) DO NOT SCALE This drawing is not to be used in whole in or part other than for the intended purpose and project as defined on this drawing. Refer to the contract for full terms and conditions.
52 / Legend FIGURE 13 Modelled NO 2 Concentration (µg/m 3 ) < Proposed CAZ boundary Modelled Road Network 0 31/05/2018 Rev. Client Project Date Initial Issue Purpose of revision 7th Floor, 2 Colmore Square, 38 Colmore Circus, Queensway, Birmingham, B4 6BN Tel: +44 (0) Fax: +44.(0) BIRMINGHAM CLEAN AIR ZONE GH Drawn Check'd Rev'd Appr'd Drawing Title ANNUAL MEAN NO 2 CONCENTRATIONS CAZ D MEDIUM CHARGE km A3 Jacobs No. 1:20,000 B DO NOT SCALE \\GBBHM1-FIL003\Projects\B3553P06 - SSBU_Air Quality_Minor Work\Birmingham CAZ\CAZ AQ Reporting January 2018_GH\70. GH Report\Figures\B _003_Rev0_2020CAZDMED_10_3.mxd Contains OS data Crown Copyright and database right 2017 This drawing is not to be used in whole in or part other than for the intended purpose and project as defined on this drawing. Refer to the contract for full terms and conditions.
53 / Legend FIGURE 14 Modelled NO 2 Concentration (µg/m 3 ) < Proposed CAZ boundary Modelled Road Network 0 31/05/2018 Rev. Client Project Date Initial Issue Purpose of revision 7th Floor, 2 Colmore Square, 38 Colmore Circus, Queensway, Birmingham, B4 6BN Tel: +44 (0) Fax: +44.(0) BIRMINGHAM CLEAN AIR ZONE GH Drawn Check'd Rev'd Appr'd Drawing Title ANNUAL MEAN NO 2 CONCENTRATIONS CAZ D HIGH CHARGE km A3 Jacobs No. 1:20,000 B DO NOT SCALE \\GBBHM1-FIL003\Projects\B3553P06 - SSBU_Air Quality_Minor Work\Birmingham CAZ\CAZ AQ Reporting January 2018_GH\70. GH Report\Figures\B _003_Rev0_2020CAZDHIGH_10_3.mxd Contains OS data Crown Copyright and database right 2017 This drawing is not to be used in whole in or part other than for the intended purpose and project as defined on this drawing. Refer to the contract for full terms and conditions.
54 Rigid HGVs 4% Diesel LGVs 26% Diesel LGVs 28% Artic HGVs 2% Rigid HGVs 9% A38 Inside CAZ (between Children's Hospital and Dartmouth Circus) Rigid HGVs 4% Artic HGVs 1% Buses/Coaches 27% Diesel LGVs 17% Buses/Coaches 0% Artic HGVs 1% Buses/Coaches 0% Petrol Cars 6% Petrol Cars 11% Diesel Cars 58% Petrol Cars 11% Diesel Cars 56% A4100 Digbeth Diesel Cars 39% NO 2 Conc: µg/m 3 Without CAZ: 46.6 With CAZ D : 40.6 Suffolk St Queensway (Near Beak St) Req'd extra reduction: -7% NO 2 Conc: µg/m 3 Without CAZ: 48.8 With CAZ D : 42.7 Req'd extra reduction: -19% NO 2 Conc: µg/m 3 Without CAZ: 46.4 With CAZ D : 40.3 Req'd extra reduction: -4% PCM_0 PCM_161 \\GBBHM1-FIL003\Projects\B3553P06 - SSBU_Air Quality_Minor Work\Birmingham CAZ\CAZ AQ Reporting January 2018_GH\70. GH Report\Figures\B _005_Rev0_2020CAZDHIGHSA_10_3_R1.mxd PCM_2 Non_PCM_ km Artic HGVs 6% Rigid HGVs 25% Diesel LGVs 22% Buses/Coaches 0% PCM_6 A4540 Lawley Middleway - Garrison Circus Petrol Cars 5% Diesel Cars 42% NO 2 Conc: µg/m 3 Without CAZ: 46.9 With CAZ D : 41.4 Req'd extra reduction: -9% / Contains OS data Crown Copyright and database right /05/2018 Rev. Client Legend Project Date Drawing Title A3 Jacobs No. 7th Floor, 2 Colmore Square, 38 Colmore Circus, Queensway, Birmingham, B4 6BN Tel: +44 (0) Fax: +44.(0) :20,000 B FIGURE 15 Modelled NO 2 Concentration (µg/m 3 ) < Proposed CAZ boundary Modelled Road Network Initial Issue Purpose of revision BIRMINGHAM CLEAN AIR ZONE GH Drawn Check'd Rev'd Appr'd LOCATIONS OF KEY NO 2 ECEEDANCE AND SOURCE APPORTIONMENT WITH CAZ D (HIGH CHARGE) SCENARIO (2020) DO NOT SCALE This drawing is not to be used in whole in or part other than for the intended purpose and project as defined on this drawing. Refer to the contract for full terms and conditions.
55 / Legend FIGURE 16 Bus route Proposed CAZ boundary 0 01/06/2018 Initial Issue GH Rev. Date Purpose of revision Drawn Check'd Rev'd Appr'd 7th Floor, 2 Colmore Square, 38 Colmore Circus, Queensway, Birmingham, B4 6BN Tel: +44 (0) Fax: +44.(0) Client Project BIRMINGHAM CLEAN AIR ZONE Drawing Title ADDITIONAL MEASURES: BUS ROUTES A3 Jacobs No. 1:70,000 B DO NOT SCALE km \\GBBHM1-FIL003\Projects\B3553P06 - SSBU_Air Quality_Minor Work\Birmingham CAZ\CAZ AQ Reporting January 2018_GH\70. GH Report\Figures\B _007_Rev0_measures2_10_3.mxd Contains OS data Crown Copyright and database right 2017 This drawing is not to be used in whole in or part other than for the intended purpose and project as defined on this drawing. Refer to the contract for full terms and conditions.
56 / Legend FIGURE 17 Modelled NO 2 Concentration (µg/m 3 ) < Proposed CAZ boundary Modelled Road Network 0 01/06/2018 Rev. Client Date Initial Issue Purpose of revision GH Drawn Check'd Rev'd Appr'd 7th Floor, 2 Colmore Square, 38 Colmore Circus, Queensway, Birmingham, B4 6BN Tel: +44 (0) Fax: +44.(0) Project BIRMINGHAM CLEAN AIR ZONE Drawing Title ANNUAL MEAN NO 2 CONCENTRATIONS - HIGH PLUS ADDITIONAL MEASURES PACKAGE FOR OBC km A3 Jacobs No. 1:20,000 B DO NOT SCALE \\GBBHM1-FIL003\Projects\B3553P06 - SSBU_Air Quality_Minor Work\Birmingham CAZ\CAZ AQ Reporting January 2018_GH\70. GH Report\Figures\B _003_Rev0_CAZC_AM_OBC_10_3.mxd Contains OS data Crown Copyright and database right 2017 This drawing is not to be used in whole in or part other than for the intended purpose and project as defined on this drawing. Refer to the contract for full terms and conditions.
57 Rigid HGVs 3% Diesel LGVs 20% Rigid HGVs 3% Diesel LGVs 21% A38 Inside CAZ (between Children's Hospital and Dartmouth Circus) Artic HGVs 1% Buses/Coaches 0% Artic HGVs 1% Buses/Coaches 0% Petrol Cars 8% Diesel Cars 68% Petrol Cars 8% NO 2 Conc: µg/m 3 Without CAZ: 46.6 With + AM: 42.3 Req'd extra reduction: -15% Suffolk St Queensway (Near Beak St) NO 2 Conc: µg/m 3 Without CAZ: 48.8 With + AM: 45.1 PCM_161 PCM_0 PCM_2 Non_PCM_10 PCM_6 / FIGURE 18 Legend Modelled NO 2 Concentration (µg/m 3 ) < Proposed CAZ boundary Modelled Road Network Req'd extra reduction: -31% Buses/Coaches 27% Artic HGVs 1% Rigid HGVs 5% Diesel LGVs 12% Petrol Cars 5% Diesel Cars 67% A4100 Digbeth Diesel Cars 50% km NO 2 Conc: µg/m 3 Without CAZ: 46.4 With + AM: 39.9 Req'd extra reduction: N/A (compliant) \\GBBHM1-FIL003\Projects\B3553P06 - SSBU_Air Quality_Minor Work\Birmingham CAZ\CAZ AQ Reporting January 2018_GH\70. GH Report\Figures\B _005_Rev0_2020CAZCHIGH_AM_SA_10_3.mxd Artic HGVs 6% Rigid HGVs 23% Diesel LGVs 23% Buses/Coaches 0% A4540 Lawley Middleway - Garrison Circus Petrol Cars 5% Diesel Cars 43% NO 2 Conc: µg/m 3 Without CAZ: 46.9 With + AM: 42.0 Req'd extra reduction: -14% Contains OS data Crown Copyright and database right /06/2018 Rev. Client Project Date Drawing Title A3 Jacobs No. 7th Floor, 2 Colmore Square, 38 Colmore Circus, Queensway, Birmingham, B4 6BN Tel: +44 (0) Fax: +44.(0) :20,000 B Initial Issue Purpose of revision BIRMINGHAM CLEAN AIR ZONE GH Drawn Check'd Rev'd Appr'd LOCATIONS OF KEY NO 2 ECEEDANCE AND SOURCE APPORTIONMENT WITH HIGH PLUS ADDIONAL MEASURES PACKAGE (2020) DO NOT SCALE This drawing is not to be used in whole in or part other than for the intended purpose and project as defined on this drawing. Refer to the contract for full terms and conditions.
58 / Legend FIGURE 19 Modelled NO 2 Concentration (µg/m 3 ) < Proposed CAZ boundary Modelled Road Network 0 01/06/2018 Rev. Client Project Date Initial Issue Purpose of revision 7th Floor, 2 Colmore Square, 38 Colmore Circus, Queensway, Birmingham, B4 6BN Tel: +44 (0) Fax: +44.(0) BIRMINGHAM CLEAN AIR ZONE GH Drawn Check'd Rev'd Appr'd Drawing Title ANNUAL MEAN NO 2 CONCENTRATIONS - CAZ D HIGH PLUS ADDITIONAL MEASURES PACKAGE FOR OBC km A3 Jacobs No. 1:20,000 B DO NOT SCALE \\GBBHM1-FIL003\Projects\B3553P06 - SSBU_Air Quality_Minor Work\Birmingham CAZ\CAZ AQ Reporting January 2018_GH\70. GH Report\Figures\B _003_Rev0_CAZD_AM_OBC_10_3.mxd Contains OS data Crown Copyright and database right 2017 This drawing is not to be used in whole in or part other than for the intended purpose and project as defined on this drawing. Refer to the contract for full terms and conditions.

59 Rigid HGVs 3% Diesel LGVs 27% Diesel LGVs 29% Buses/Coaches 32% Artic HGVs 1% A38 Inside CAZ (between Children's Hospital and Dartmouth Circus) Buses/Coaches 0% Artic HGVs 1% Rigid HGVs 4% Rigid HGVs 5% Artic HGVs 1% Diesel Cars 58% Buses/Coaches 0% Petrol Cars 6% Diesel LGVs 14% Petrol Cars 11% Petrol Cars 11% Diesel Cars 42% Diesel Cars 55% A4100 Digbeth NO 2 Conc: µg/m 3 Without CAZ: 46.6 With CAZ D + AM: 40.3 Req'd extra reduction: -3% Suffolk St Queensway (Near Beak St) NO 2 Conc: µg/m 3 Without CAZ: 48.8 With CAZ D + AM: 42.7 Req'd extra reduction: -19% NO 2 Conc: µg/m 3 Without CAZ: 46.4 With CAZ D + AM: 38.9 Req'd extra reduction: N/A (compliant) PCM_161 PCM_0 \\GBBHM1-FIL003\Projects\B3553P06 - SSBU_Air Quality_Minor Work\Birmingham CAZ\CAZ AQ Reporting January 2018_GH\70. GH Report\Figures\B _005_Rev0_2020CAZDHIGH_AM_SA_10_3.mxd PCM_2 Non_PCM_ km Artic HGVs 6% Rigid HGVs 23% Diesel LGVs 23% PCM_6 Buses/Coaches 0% A4540 Lawley Middleway - Garrison Circus Petrol Cars 5% Diesel Cars 43% NO 2 Conc: µg/m 3 Without CAZ: 46.9 With CAZ D + AM: 41.5 Req'd extra reduction: -11% / Contains OS data Crown Copyright and database right 2017 Legend Rev. Project 0 08/06/2018 Client Date Drawing Title A3 Jacobs No. 7th Floor, 2 Colmore Square, 38 Colmore Circus, Queensway, Birmingham, B4 6BN Tel: +44 (0) Fax: +44.(0) :20,000 B FIGURE 20 Modelled NO 2 Concentration (µg/m 3 ) < Proposed CAZ boundary Modelled Road Network Initial Issue Purpose of revision BIRMINGHAM CLEAN AIR ZONE GH Drawn Check'd Rev'd Appr'd LOCATIONS OF KEY NO 2 ECEEDANCE AND SOURCE APPORTIONMENT WITH CAZ D HIGH PLUS ADDIONAL MEASURES PACKAGE (2020) DO NOT SCALE This drawing is not to be used in whole in or part other than for the intended purpose and project as defined on this drawing. Refer to the contract for full terms and conditions.

60 Appendix A. Explanation of Vehicle Emissions Standards Background The Euro standards are a range of successively tightening emissions controls founded in European directives that set limits for air quality pollutants from petrol, gas and diesel engines. Compliance with these limits must be demonstrated as part of the European type approval process for new vehicles and Road vehicle engines. There are also durability requirements to demonstrate continued compliance in service. Light duty vehicles (cars and vans) are subject to whole vehicle emissions testing, whereas engines for heavy duty vehicles (HGVs and buses) are emissions tested on a test bench, prior to installation in any vehicle. They may subsequently be fitted to a variety of different vehicle types. The emissions limit values are different for each vehicle type, and to indicate which is being referred to, there is a convention that, for instance, Euro 6 refers to cars and vans (whole vehicle emissions testing), while Euro VI refers to goods vehicles and buses (engine only emissions testing). In each case, the Euro standards set out emissions limits for type approval testing that control four legislated emissions carbon monoxide (CO), hydrocarbons (HC), nitrogen oxides (NOx) and particulate matter (PM). Standards Euro 1 appeared in 1992 and the standards have progressed to the current Euro 6/VI. This became mandatory for all new heavy duty engines for goods vehicles and buses from January 2014, September 2015 for cars and light vans, and September 2016 for larger vans up to 3,500kg gross vehicle weight. Euro standards for motorcycles, mopeds, tricycles and quadricycles (collectively known as L-Category vehicles) were introduced later than for larger vehicles, with the current standard being Euro 3. In 2017, Euro 4 for L- Category vehicles will come into force. Detailed information about emissions standards for light duty vehicles can be found by following these selected links: and for heavy vehicles at: The tables below set out the approximate implementation dates for each Euro standard, which differ according to vehicle type, between 1990 and Table A1-1: Heavy vehicle Euro standards over time

61 Table A1-2: Light Duty Vehicle Euro Standards Over Time Emissions For NO x emissions, light duty vehicles (e.g. cars and vans) use grams per kilometre (g/km) and heavy duty vehicles use grams per kilowatt hour (g/kwh) because of the different ways these vehicles are tested. In addition, heavy duty vehicles have both a steady state limit and a transient limit. These vehicles would need to comply with both limits to achieve CAZ compliance. For certain vehicle types, some early Euro standards did not set limits for all pollutants. In this case n/a is entered in the table below. This would mean that a vehicle is effectively compliant in terms of the CAZ for that pollutant. For example, Euro 4 petrol vehicles do not have PM limits, therefore vehicle owners only need to check that NOx emissions meet the CAZ standard to know whether the vehicle is compliant. The NO x and PM limits for Euro 4 and Euro 6/VI vehicles are summarised in the tables below. The vehicle weights provided are the reference mass of the unladen vehicle at the time of type approval testing. In the tables, an LGV category N1 is a light goods vehicle not exceeding 3,500kg maximum mass. An N2 LGV is a light goods vehicle not exceeding 12,000kg maximum mass. A heavy duty vehicle is a goods vehicle, bus or coach with a maximum mass greater than 3,500kg. Table A1-3: Euro 4 and 6 Emission Limits for Light Duty Vehicles (g/km) Engine Class Fuel Vehicle Description & Weights Emission Limits g/km NO x PM Euro 4 Petrol Cars and LGVs Category n1 Class n/a 1,305kg Euro 4 Petrol LGV category N1 Class II 1,305-1,760 kg 0.10 n/a Euro 4 Petrol LGV category N1 Class III > 1,760kg 0.11 n/a Euro 4 Petrol LGV category N2 n/a n/a Euro 6 Diesel cars and LGV category N1 Class 1 1,305kg Euro 6 Diesel LGV category N1 Class II 1,305-1,760 kg Euro 6 Diesel LGV category N1 Class III > 1,760kg Euro 6 Diesel LGV category N
62 Table A1-4: Euro VI Emission Limits for Heavy Duty Vehicles (g/kwh) Engine Class Steady State Emission Limits g/km Transient Emission Limits g/km NO x PM NO x PM Euro VI On-highway verification It has been identified that emissions from vehicles, especially diesel cars and LGVs can be much greater under actual driving conditions than the emissions standards based on laboratory testing, For the latest Euro 6/VI emissions standards, the laboratory-based type approval tests, using the limit values set out above, are verified by on-highway emissions testing of a completed vehicle. This has been the case since 2013 for heavy duty engines where the not-to-exceed limits in the on-highway test have ensured that vehicle exhaust emissions of NO x and PM are greatly reduced compared to earlier standards. In many cases the emissions from a heavy truck or bus are comparable with those of passenger cars. For light duty cars and vans, the Euro 6 on-highway verification is in the form of a test protocol known as Real Driving Emissions (RDE). These verification measures are being introduced in a number of stages, which have been loosely termed `Euro 6a to Euro 6d as follows: 2014 Euro 6a new reduced emissions limits 2017 Euro 6b new Worldwide Harmonised Light Vehicle Test Cycle (WLTC) implemented 2019 Euro 6c conformity factor of 2.1 to be applied to on-highway RDE test results 2021 Euro 6d on-highway RDE conformity factor to be reduced to 1.5 At the time of writing, the final details of these measures were still to be confirmed by a vote at the Technical Committee Motor Vehicles (TCMV) at the European Parliament. It is expected that these measures will be confirmed. For cars and LGVs, Euro 6a essentially consisted of a reduction in the allowable NO x emissions from diesel engines of 55 per cent. Emissions of PM and all emissions limits from petrol engines are unchanged from Euro 5. Euro 6b was the replacement of the New European Driving Cycle (NEDC), widely acknowledged as being unrepresentative, with the WLTC, which is far more transient and representative of real driving conditions. Euro 6c will introduce RDE testing as a verification of laboratory emissions tests. A test route conforming to detailed criteria is driven with portable emissions measurement equipment on the vehicle. The average measured emissions must not be more than 110 per cent over the laboratory test limits (conformity factor of 2.1). Euro 6d will see the conformity factor reduced to 1.5 (50 per cent over the laboratory test limits). This factor allows for variance between portable and laboratory emissions analysers.


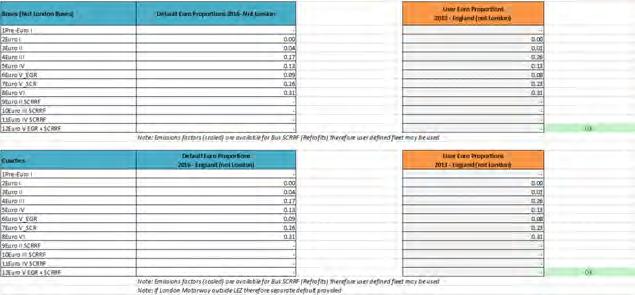
63 Appendix B. Local Fleet Mix Profiles 2016


64 These fleet compositions were rolled forward to 2020, incorporating guidance from JAQU to accommodate predicted trends in diesel and petrol fleet to the fleet mix below: