Offshore Wind: Potential Energy and Economic Benefits to Virginia
|
|
|
- Hillary Leonard
- 5 years ago
- Views:
Transcription

1 Offshore Wind: Potential Energy and Economic Benefits to Virginia VCERC Day at the General Assembly Richmond, VA 04 February 2009 George Hagerman VCERC Director of Research Virginia Tech Advanced Research Institute 4300 Wilson Blvd., Suite 750 Arlington, VA Phone:
2 Presentation Outline Virginia Coastal Energy Research Consortium History, funding, and projects Offshore wind resources Located near coastal metropolitan load centers Mid-Atlantic has most abundant shallow water resource Offshore wind technology Mapping offshore winds and other ocean uses to estimate Virginia s realistic near-term potential Comparing cost of energy between offshore wind and fossil fuel fired power plants Economic development potential


3 VCERC Created by 2006 General Assembly to Bring Together Universities, State Agencies, and Industry Virginia Coastal Energy Research Consortium Non-University VCERC Directors Mechanical, electrical, materials, civil, and ocean engineering Washington, DC area presence Physical, chemical, & geological ocean sciences Biological ocean sciences Wind energy engineering Renewable energy curriculum development High-tech workforce training Entrepreneurship development Integration of marine renewables into Virginia Energy Plan Ensuring compatibility with other marine uses and coastal resources Identification of manufacturing job creation opportunities and industry benefits of long-term, price-stable energy supply Identification of waterfront development opportunities


4 Three Additional Universities and Two New Industry Representatives Added in 2007 Virginia Coastal Energy Research Consortium Rice Center for Environmental Life Sciences expertise on natural algal blooms Non-University VCERC Directors Integration of GIS tool into Coastal GEMS Virginia Coast Reserve Long-Term Ecological Research Project Interface with local high-tech industry, including advanced manufacturing, sensors, and control systems Chemical Engineering Department -- fuels testing and characterization Research and development of alternative marine biofuels and bioproducts Virginia Clean Cities and the Hampton Roads Clean Cities Coalition identify regional transportation needs and opportunities for fuels from algae and integration of offshore wind with plug-in hybrid electric vehicles
5 FY VCERC Budget Distribution Project Total VT-ARI $200K $30K $20K $0K $250K ODU $150K $64K $0K $511K $725K ODU (Industry) $50K $0K $100K $0K $150K $120K $15K $0K JMU $15K $150K $0K $0K $75K $0K NSU $75K VIMS $0K* $50K $0K $100K $150K Total $425K $244K $195K $636K $1,500K * VIMS anticipates being able to support Project 1 through its normal Sea Grant activities and with a subset of the GIS data produced under Project 2. * In Oct 2007, higher-education budget cut of 10.6% to VCERC budget amendment was applied uniformly across all projects and universities * SAIC Maritime Operations is ODU Industry Partner
6 Three Initial VCERC Projects Focus on Offshore Wind 1. Feasibility-level design and economic assessment for a hypothetical reference baseline offshore wind power project 2. Preliminary mapping of offshore areas suitable for offshore wind power development, with identification of military training areas, shipping lanes, commercial fishing grounds, and marine and avian habitats Paliria Energy, Inc. 3. Evaluation of economic development potential of commercial offshore wind power development and associated workforce training needs, and planning for an ocean test bed 4. Feasibility-level design and economic assessment for an algae-to-biodiesel culture and processing system

7 U.S. Offshore Wind Resources Pacific NW Class 5, 6 & 7 Gulf of Maine Class 6 Great Lakes Class 5 & 6 Mid-Atlantic Class 5 & 6 S California Class 4, 5 & 6 Great Plains Class 3, 4 & 5 Southeast Class 4, 5 & 6

8 Nearly 80% of U.S. Electricity Demand is in Atlantic, Pacific, Gulf of Mexico or Great Lakes States Twenty-eight coastal states in contiguous U.S. consume 78% of U.S. electrical energy

9 Nearly 60% of U.S. Population Lives in Atlantic, Pacific, Gulf of Mexico or Great Lakes States Twenty-eight coastal states in contiguous U.S. are home to 58% of population

10 US Offshore Wind Resources Located Near Coastal Metropolitan Load Centers

11 Virginia is One of Ten States with Shallow-Water Resource Base Comparable to Demand ME MI OH NJ DE MA RI SC VA NC


12 Mid-Atlantic Offshore Wind Energy Can Meet a Large Portion of the Energy Needs in PJM 20% = 33.1 GW Developing just 20% of the Mid-Atlantic region s offshore wind potential in depths < 30 m (as required for economical monopile-based projects using commercially available technology) would result in 33.1 GW of installed offshore wind capacity.

13 PJM Energizes About One-Fifth of the U.S. Gross Domestic Product 33.1 GW of offshore wind at 40% annual capacity factor would generate 116,000 GWh, supplying about 17% of PJM s annual energy

14 Offshore Wind Might Relieve PJM Transmission Constraints from West to East Fentress is the only high-voltage substation near the Atlantic coast for gigawatt-scale projects between Staten Island, NY and Savannah, GA
 wind energy resource located within")

 Pale blue region indicates uncertain wind map")
15 Hampton Roads Area has Unique Features Favorable for Offshore Wind Power Development Class 6 ( ) wind energy resource located within miles (16-24 km) of shoreline and close to major, growing centers of power demand 500 kv 115 kv 230 kv Robust coastal transmission grid Minimal probability of major hurricane strike (Categories 3 through 5) Pale blue region indicates uncertain wind map accuracy beyond 25 km offshore


16 Typical Offshore Wind Farm Layout

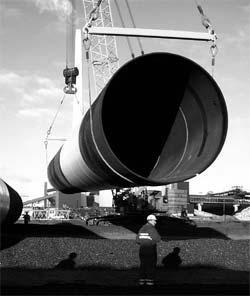


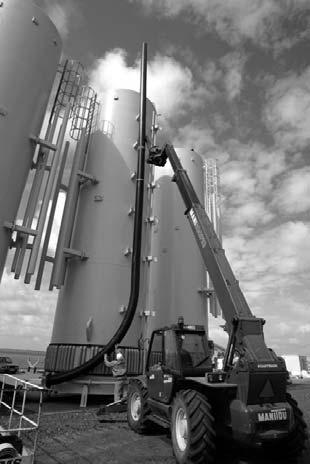
17 Monopile Foundations Driven into Seabed and Transition Pieces Grouted on Top


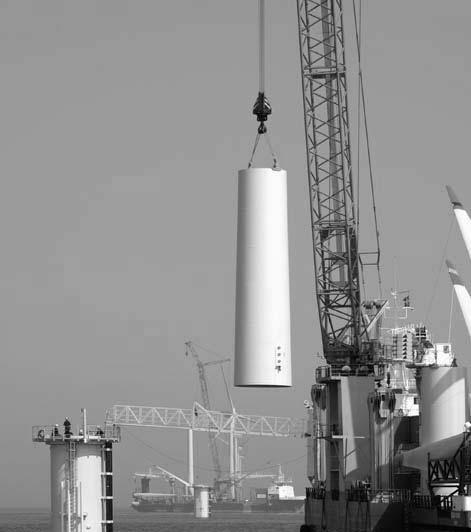
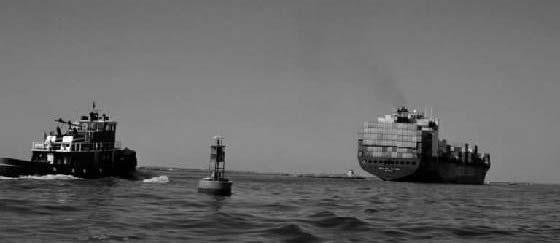
18 Horns Rev 2-MW Turbines Installed Using Self-Propelled A2 SEA Vessels


19 North Hoyle 2-MW Turbines Installed Using Towed Seacore Jack-Up Rigs
20 GIS Analysis and Mapping of Resource Focus on 50 MMS lease blocks and avoid all excluded areas MMS lease blocks are 4.8 km x 4.8 km, with each block having 7 x 7 turbines. Turbines spaced 685 m apart (7.6 rotor diameters) Each lease block could contain 49 turbines = 147 MW per block with Vestas model V-90 3 MW = 6.4 MW per km 2 GIS layers and calculations by James Madison University

; could support 3,680 MW of wind capacity.")
21 Class 6 Winds are Largely Beyond the Visual Horizon Photo simulation of Long Island offshore wind project Beyond the Territorial Sea Limit of 12 n.mi., turbines would be barely visible, and then only on the clearest days. 12 n.mi. Total available area of Class 6 beyond 12 n.mi. is sq.km (142,500 acres); could support 3,680 MW of wind capacity.
22 Class 6 Winds Beyond the Visual Horizon Could Be a Major Electricity Source for Virginia Total available area of Class 6 beyond 12 n.mi. is sq.km (142,500 acres); could support 3,680 MW of wind capacity. With an average annual capacity factor of 40%, this amount of wind generation capacity could generate 12.9 million MWh per year. 12 n.mi. This is about 1/3 of what coal-fired power plants now generate in VA, or slightly more than half of what nuclear plants now produce.


23 Early, Meaningful Engagement of Local Stakeholders Essential to Success

24 Cost of Energy Comparison with Fossil Fuel Fired Generation
25 Cost of Energy Comparison with Fossil Fuel Fired Generation Fossil fuel generation costs and performance are based on actual or planned generation projects under development by Dominion Virginia Power: a combined-cycle natural gas fired plant in Buckingham County, and a coal-fired plant in Wise County.
26 Offshore Wind Provides a Long-Term Hedge Against Fuel Price Volatility

27 Economic Development Potential Capital cost breakdown for hypothetical offshore wind project Based on Vestas V90-3MW turbine 30% of capital cost engages local economy to build balance of plant Estimated maritime industry value of fabrication, installation, and service contracts for notional 3,600 MW of installed offshore wind capacity: At $3,600 per installed kw, total capital investment (CI) = $12.96 billion Assuming an installation rate of 180 MW per year= $648 million per year over 20 years Local fabrication and installation contracts = $194 million per year until fully built out Local offshore service contracts (2.5% of CI) = $155 million per year after fully built out With 25-year project service life, project re-powering ensures indefinite sustainability
28 Hampton Roads can Become a Hub for Offshore Wind Supply and Support Infrastructure Massachusetts (Cape Wind) Supply chain and maritime infrastructure needed for all Atlantic coast projects is a bottleneck Rhode Island New Jersey Delaware Atlantic Ocean
29 Interstate Coordinated Planning Needed to Avoid Local Economic Boom and Bust Cycles

30 Thank You! Any questions?