Soilless Substrate Hydrology and Subsequent Impacts on Plant-Water Relations of Containerized Crops
|
|
|
- Kelley Baker
- 5 years ago
- Views:
Transcription
1 Soilless Substrate Hydrology and Subsequent Impacts on Plant-Water Relations of Containerized Crops Jeb Stuart Fields Dissertation submitted to the faculty of the Virginia Polytechnic Institute and State University in partial fulfillment of the requirements for the degree of Doctor of Philosophy In Horticulture James S. Owen, Jr. James E. Altland Marc W. van Iersel Joshua L. Heitman Holly L. Scoggins December 6, 2016 Blacksburg, VA Keywords: (coco coir, container, drought, evaporative method, horticulture, hydraulic conductivity, HYDRUS, modeling, moisture tension, peat, physical property, pine bark, plant, soilless substrates, sustainability, water, water potential)
2 Soilless Substrate Hydrology and Subsequent Impacts on Plant-Water Relations of Containerized Crops Jeb Stuart Fields ABSTRACT Freshwater is a finite resource that is rapidly becoming more scrutinized in agricultural consumption. Specialty crop producers, especially ornamental crop producers, must continually improve production sustainability, with regards to water resource management, in order to continue to stay economically viable. Soilless substrates were initially developed to have increased porosity and relatively low water holding capacity to ensure container crops would not remain overhydrated after irrigations or rain events. As a result, substrates were selected that are now considered to be in efficient in regards to water resource management. Therefore, to provide growers with additional means to improve production sustainability, soilless substrate hydrology needs be innovated to provide increased water availability while continuing to provide ample air filled porosity to ensure productive and efficient water interactions. Historically, soilless substrates have been characterized using static physical properties (i.e. maximum water holding capacity and minimum air-filled porosity). The research herein involves integrating dynamic soilless substrate hydraulic properties to understand how substrate hydrology can be manipulated to design sustainable substrates. This task involved adapting new technologies to analyze hydrological properties of peat and pine bark substrates by employing evaporative moisture characteristic measurements, which were originally designed for mineral soils, for soilless substrate analyses. Utilizing these evaporative measurements provide more accurate measures of substrate water potentials between -10 and -800 hpa than traditional pressure plate measurements. Soilless substrates were engineered, utilizing only three common substrate ii
3 components [stabilized pine bark (Pinus taedea L.), Sphagnum peatmoss, and coconut coir fiber], via particle fractionation and fibrous additions. The engineering process yielded substrates with increased unsaturated hydraulic conductivity, pore connectivity, and more uniform pore size distributions. These substrates were tested in a greenhouse with irrigation systems designed to hold substrates at (-100 to -300 hpa) or approaching (-50 to -100 hpa) water potentials associated with drought stress. Substrate-water dynamics were monitored, as were plant morphology and drought stress indicators. It was determined that increased substrate unsaturated hydraulic conductivity within the production water potentials, allowed for increased crop growth, reduction in drought stress indicators, while producing marketable plants. Furthermore, individual plants were produced using as low as 5.3 L per plant. Increased production range substrate hydraulic conductivity was able to maintain necessary levels of air-filled porosity due to reduced irrigation volumes, while providing water for plants when needed. The substrates were able to conduct water from throughout the container volume to the plant roots for uptake when roots reduced substrate water potential. Furthermore, increased substrate hydraulic conductivity allowed plants within the substrate to continue absorbing water at much lower water potentials than those in unaltered (control) pine bark. Finally, HYDRUS models were utilized to simulate water flux through containerized substrates. These models allowed for better understanding of how individual hydraulic properties influence substrate water flux, and provided insight towards proportions of inaccessible pores, which do not maintain sufficient levels of available water. With the models, researchers will be able to simulate new substrates, and utilize model predictions to provide insight toward new substrates prior to implementing production tests. It has been determined, that increasing substrate hydraulic conductivity, which can be done with just commonly used components, water requirements for production can be reduced, to produce iii
4 crops with minimal wasted water resources. Concluding, that re-engineering substrate hydrology can ameliorate production sustainability and decrease environmental impact. iv
5 Soilless Substrate Hydrology and Subsequent Impacts on Plant-Water Relations of Containerized Crops Jeb Stuart Fields ABSTRACT The world is rapidly approaching a time when water will become a limited resource, not only for agriculture, but all daily uses. As a result specialty crop production must continue to increase sustainability in order to continue to thrive. One area where growers and researchers believe environmental stewardship can be increased is through designing more resource efficient soilless substrates. Soilless substrates (potting media) are utilized world-wide by container crop producers as a rooting medium for specialty crops. These substrates were developed to be very forgiving for growers. By that, growers could apply excess water through irrigation or precipitations and these substrates were designed to readily drain excess water. This provides an opportunity to create more water efficient substrates to help reduce water consumption by container nurseries. The processes involving water-air-substrate interactions within the container are not well understood. As a result, my research involves measuring, manipulating, maintaining, and modeling substrate hydrology in an effort to design substrates that will conserve water in container production. I incorporated new technology used in Soil Science to measure hydraulic properties of soilless substrates through the evaporative method. I then understood how growers and allied suppliers can easily modify these substrate hydraulic properties. Next, I researched how these manipulated hydraulic properties would influence plant growth and vitality, by maintaining drought level irrigation levels over multiple crops. Finally, I modeled substrate hydraulic properties to better understand water movement through a container. Through the v
6 research herein, I was able to determine that substrate hydrology can be easily modified to provide container crops with more easily accessed water, while still keeping sufficient air-space for plant growth. Increasing unsaturated hydraulic conductivity in soilless substrates, allows ornamental crops to be held at lower water regimes moisture levels traditionally considered to be drought levels. Utilizing the HYDRUS model, I was able to determine how to develop future substrate models that will accurately simulate real-world outcomes, providing researchers with another tool to quickly predict impacts of newly developed (or still in development) soilless substrates on water status in container production. vi
7 DEDICATION I dedicate this dissertation to my parents as partial return for the inspiration provided to allow me to follow my dreams. vii
8 ACKNOWLEDGEMENTS First and foremost, I would like to thank Dr. James Owen, Jr. for providing me the opportunity to pursue my dreams and goals. Jim, your mentorship has allowed me to become a better researcher. You guidance in research, writing, extension, and my future career have been invaluable. I will never be able to look at a figure or table again without considering how you would have chosen to design them. Your semi-allowance of my colorful wording and eclectic figure design was a breath of fresh air. I look forward to continued collaboration with your program to the fullest of my abilities. To my parents, family, and friends, your continued support of my academic endeavors were vital in allowing me to continue my pursuit of academic prowess. To my parents especially, the journey was long and there is no fathomable way I could have made it this far without your mental, emotional, and economic support. Bonnie, I am sorry I left. And as promised water s dipole nature. I would also like to thank my committee members, Drs. James Altland, Josh Heitman, Marc van Iersel, and Holly Scoggins. Each of you played a key role in my endeavor as well as providing much appreciated guidance. Aside from the massive knowledge of horticulture, plant physiology, soil physics and pure science that each of you has instilled in me, I have been able to pick up important understandings and tendencies, which will propel me in my future endeavors. James, you have instilled a deeper understanding and admiration for statistics which will elevate my analyses throughout my career. Josh, you showed me how to step back and think holistically, to attain deeper understanding of all aspects of a problem or result. Marc, I will never forget viii
9 about the plant again! Holly, you taught me how everything does not have to be so rigid and how to meld writing to better communicate with an audience. I would also like to extend my appreciation to Dr. Ryan D. Stewart. Ryan, I leaned on you heavily in my modeling duties, and you always made time to provide your assistance. You were always able to provide clarity, push my knowledge of modeling and software, and provide key reviews of my work from a different perspective. You were not a member of my committee, but I feel you participated as you were. For that, I will especially always be grateful. I would like to thank Dr. Jean Caron for taking the time to invite me to Canada to further my modeling knowledge and fostering interests in dynamic substrate properties. You had little to gain from inviting me to your lab at ISHS, yet you pursued the endeavor on my behalf, and that has not been forgotten. I would like to thank Drs. Brian Jackson and Bill Fonteno at NC State. Not only for being my co-advisers for my M.S. research, where I was introduced to this field of research and received my seminal training and understanding of all that is soilless substrate, but also for your continued support throughout my PhD research. In addition, I would still be hand screening bark to this very day if you did not provide assistance and access to the SPARC facility. I would also extend my gratitude to all faculty and staff members at the Hampton Roads Agriculture Research and Extension Center, in Virginia Beach, VA. From facilities to administration, I was always treated well and provided with every opportunity to succeed. Furthermore, members of the Nursery Production lab and our summer interns, Julie, Simon, Anna, Corey, and Carter, all your help with data collection, study initiation, potting days, and weekend watering is greatly appreciated. ix
10 I would also like to thank specific industry persons who have provided assistance with technology mastery, materials, and coding. Leo Rivera, Bobby Oakley, and Mark Wallace in particular provided immense help that eased my inevitable path towards my research goals. x
11 TABLE OF CONTENTS Chapter Page Academic Abstract...ii Public Abstract...v Dedication...vii Acknowledgements...viii List of Tables...xiv List of Figures...xix Chapter I: Introduction and Literature Review Introduction...1 Literature Review...4 Substrate hydrophysical properties...4 Water use efficiency...8 Plant water availability...9 Modeling container water dynamics...10 Literature cited...12 Chapter II: The Use of the Evaporative Method for Determination of Soilless Substrate Moisture Characteristics Title Page...21 Abstract...22 Introduction...24 Materials and Methods...27 Results and Discussion...31 Conclusions...39 Literature Cited...40 Chapter III: The Influence of Engineered Soilless Substrate Hydrology on Plant Water Status for an Ornamental Containerized Crop Grown Under Optimal Water Conditions Title Page...52 Abstract...53 Introduction...54 Materials and Methods...56 xi
12 Results and Discussion...67 Conclusions...79 Literature Cited...81 Chapter IV: The Influence of Substrate Hydraulic Conductivity on Plant Water Status of Ornamental Container Crop Grown in Sub-Optimal Substrate Water Potentials Title Page Abstract Introduction Materials and Methods Results and Discussion Conclusions Literature Cited Chapter V: Utilizing the HYDRUS Model as a Tool for Understanding Soilless Substrate Water Dynamics Title Page Abstract Introduction Materials and Methods Results and Discussion Conclusions Literature Cited Chapter VI: Simulating Water Movement in a Peat and Pine Bark Substrate. Title Page Abstract Introduction Materials and Methods Results and Discussion Conclusions Literature Cited Summary xii
13 Appendices Appendix A Appendix B Appendix C xiii
14 LIST OF TABLES Chapter II: The Use of the Evaporative Method for Determination of Soilless Substrate Moisture Characteristics Table 2.1 Static physical properties and particle size distribution of commercially available Sphagnum peat: perlite substrate and a conventional nursery substrate composed of aged pine bark with 10 % sand (by volume)...46 Table 2.2 Mean van Genuchten parameter values attained from data from modeled moisture characteristic curves from commercially available greenhouse Sphagnum peat: perlite substrate and conventional nursery substrate composed of aged pine bark with 10% sand (by volume) via pressure extraction method and evaporative method, using SWRC Fit (Seki, 2007) to attain models...47 Chapter III: The Influence of Engineered Soilless Substrate Hydrology on Plant Water Status for an Ornamental Containerized Crop Grown Under Optimal Water Conditions Table 3.1 Particle size distributions (dry weight basis) grouped into three texture classes (large, medium, small) and bulk density for seven experimental pine bark based substrates Table 3.2 Hydrophysical properties for seven pine bark-based substrates including, unscreened bark (UBP), four screened barks, and substrates comprised of 6.3 mm bark amended with 35% (by vol.) Sphagnum peat (P35) or xiv
15 40% (by vol.) coconut coir (C40). Easily available water, water buffering capacity and permanent wilt point are computed from data fit to a Brooks and Corey (1964) model, and therefore have no associated statistics outside of their respective models Table 3.3 Fit model parameters for the relationship between volumetric water content and substrate water potential for seven experimental pine barkbased substrates. Data were fit to a Brooks and Corey (1964) porous media moisture tension model Table 3.4 Plant growth and water status metrics of Hibiscus rosa-sinensis Fort Myers grown in seven pine bark-based substrates including, unscreened bark (UBP), four screened barks, and substrates comprised of 6.3 mm bark amended with 35% (by vol.) Sphagnum peat (P35) or 40% (by vol.) coconut coir (C40). All plants produced while holding substrate matric potential between -50 and -100 hpa Table 3.5 Instantaneous water status measurements made with a portable photosynthesis system on Hibiscus rosa-sinensis Fort Myers plants grown in seven bark-based substrates. Plants were irrigated such that substrate water potentials were maintained between -50 and -100 hpa xv
16 Chapter IV: The Influence of Engineered Soilless Substrate Hydrology on Plant Water Status for an Ornamental Containerized Crop Grown Under Optimal Water Conditions Table 4.1 Hydrophysical properties for four bark substrates maintained at low substrate water potentials. Substrates include a control (UB), bark particles < 4 mm (FB), bark > 4 mm with 35% by vol. Sphagnum peatmoss (BP), and bark > 4 mm with 35% coconut coir (BC) Table 4.2 Model parameters and measures of fit for moisture characteristic data fit to a Brooks and Corey model (1964) for four bark substrates. Substrates include a control (UB), bark particles < 4 mm (FB), bark > 4 mm with 35% by vol. Sphagnum peat moss (BP), and bark > 4 mm with 35% coconut coir (BC) Table 4.3 Differences in plant physiological and morphological measures from initiation to culmination of low substrate water potential production (i.e. value at 32 DAI - 0 DAI). Root vigor rating is a subjective measure only of the final rooting determined by an author at harvest (32 DAI). Substrates include a control unscreened bark (UB), bark particles < 4 mm (FB), bark > 4 mm with 35% by vol. Sphagnum peat moss (BP), and bark > 4 mm with 35% coconut coir (BC) Table 4.4 Irrigation and water use efficiency (WUE) metrics for 32 d of containerized plant production for four substrates held at substrate water potentials between -100 and -300 hpa. Plants were irrigated with pressure compensating spray stakes based on lysimeter readings. Substrates include a control unscreened bark (UB), bark particles < 4 xvi
17 mm (FB), bark > 4 mm with 35% by vol. Sphagnum peat moss (BP), and bark > 4 mm with 35% coconut coir (BC) Table 4.5 Instantaneous measures of plant water relations for four experimental bark substrates. Substrates include a control (UB), bark particles < 4 mm (FB), bark > 4 mm with 35% by vol. Sphagnum peat moss (BP), and bark > 4 mm with 35% coconut coir (BC). Data were measured on 17 and 32 days after initiation (DAI) of an experiment where substrate water potential was held between -100 and -300 hpa. Data were measured with a portable photosynthesis meter (LI-COR 6400xt) Table 4.6 Plant water uptake cutoff points for four experimental bark substrates. Substrates include a control (UB), bark particles < 4 mm (FB), bark > 4 mm with 35% by vol. Sphagnum peat moss (BP), and bark > 4 mm with 35% coconut coir (BC). Planted substrate watered to maximum water holding capacity and allowed to dry down until plant stopped withdrawing water from substrate Chapter V: Utilizing the HYDRUS Model as a Tool for Understanding Soilless Substrate Water Dynamics Table 5.1 Hydraulic parameters based off of moisture retention data from peatbased and bark-based substrates measured via evaporative method and fit to van Genuchten (1980) and Mualem (1976) models xvii
18 Chapter VI: Simulating Water Movement in a Peat and Pine Bark Substrate Table 6.1 Substrate physical properties and particle texture analysis for a 3:1 Sphagnum peat: perlite substrate (by vol.) and a 9:1 bark: sand substrate (by vol.) Table 6.2 Hydraulic parameters for data measured via evaporative and instantaneous profile methods fit to van Genuchten (1985) and Mualem (1976) models used in the HYDRUS models. Also, hydraulic parameters for optimized models based on in situ observations included Table 6.3 Metrics used for determining accuracy of predictive simulations of peat- and bark-based substrates based on varying substrate hydraulic property measurement methodology. Both substrates were modeled maximum water holding and at volumetric water contents equal to water potentials of -100 hpa. Observed in situ measurements as well as hydraulic parameters used to optimize hydrated scenarios included xviii
19 LIST OF FIGURES Chapter II: The Use of the Evaporative Method for Determination of Soilless Substrate Moisture Characteristics Figure 2.1 Consistency of three replicate moisture characteristic curves for A) Sphagnum peat : perlite and B) aged pine bark with 10% sand (by volume) substrate measured with the evaporative method (blue circles), and the pressure extraction method (red circles). Each curve represents an individual replicate. Only three replicates of the pressure extraction method are included in the figure Figure 2.2 Pair-wise comparison of replicate moisture characteristic curves measured via evaporative method for Sphagnum peat moss : perlite (A-C) and aged pine bark with 10% sand (by volume; D-F) using dynamic time warping analysis for each comparison. A) peat substrate replicate 2 vs 1, B) peat substrate replicate 3 vs 1, C) peat substrate replicate 3 vs 2, D) bark substrate replicate 2 vs 1, E) bark substrate replicate 3 vs 1, and F) bark substrate replicate 3 vs 2. This analysis involves providing an optimal alignment between two nonlinear series by querying one replicate against a reference replicate. The similarities between the two replicates can be estimated based on the distance between each line, with the greater the distance resulting in increased dissimilarities between each curve replicate xix
20 Figure 2.3 Depiction of the percentage difference between the moisture characteristic curve from the volumetric pressure plate extractor and the moisture characteristic curve from the evaporative method across the suction range from 0 to 300 hpa. Aged pine bark with 10% sand (by volume; solid line) and peat with perlite (dashed line). Shaded region represents the corrected values in the volumetric pressure plate extraction method (i.e. total porosity value and container capacity value)...51 Chapter III: The Influence of Engineered Soilless Substrate Hydrology on Plant Water Status for an Ornamental Containerized Crop Grown Under Optimal Water Conditions Figure 3.1 Measured moisture characteristic curve data (points) fit to Brooks and Corey (1964) models (line) for seven substrates including unscreened pine bark (A), bark particles that pass through a 2.3 mm screen (B), a 4.0 mm screen but not a 2.3 mm screen (C), 6.3 mm screen but not a 4.0 mm screen (D), and pine bark particles that do not pass through a 6.3 mm screen (E) while at 65% moisture content, and bark particles that do not pass through a 6.3 mm screen while at 65% moisture content amended with fibrous materials including 35% Sphagnum peat (F) and 40% coconut coir (G) by volume. Data measured utilizing porometer, evaporative analysis, and dewpoint potentiametry for saturation, -1 to hpa, and <-1000 hpa respectively. Model fit parameters are presented in Table xx
21 Figure 3.2 Unsaturated hydraulic conductivity data for seven experimental substrates including unscreened pine bark (UPB), bark particles that pass through a 2.3 mm screen (PF0), a 4.0 mm screen but not a 2.3 mm screen (PF2), 6.3 mm screen but not a 4.0 mm screen (PF4), and pine bark particles that do not pass through a 6.3 mm screen (PF6) while at 65% moisture content, and bark particles that do not pass through a 6.3 mm screen while at 65% moisture content amended with fibrous materials including 35% Sphagnum peat (P35) and 40% coconut coir (C40) by volume. Individual data points (A) measured via evaporative method via difference in tension between two depths in core as moisture evaporates, and B) models representing hydraulic conductivity data between substrate water potentials of -50 and -100 hpa (water buffering capacity) attained from fitting moisture tensions measures to a Mualem (1976) model while weighting for actual data measures in (A) Figure 3.3 Water loss through evapotranspiration vs. vapor pressure deficit for seven substrates including unscreened pine bark (A), bark particles that pass through a 2.3 mm screen (B), a 4.0 mm screen but not a 2.3 mm screen (C), 6.3 mm screen but not a 4.0 mm screen (D), and pine bark particles that do not pass through a 6.3 mm screen (E) while at 65% moisture content, and bark particles that do not pass through a 6.3 mm screen while at 65% moisture content amended with fibrous materials xxi
22 including 35% Sphagnum peat (F) and 40% coconut coir (G) by volume. Line represents the best linear fit Figure 3.4 Relationship between in situ effective container capacity for seven experimental substrates in 3.8 L containers and laboratory measured (porometer) container capacity. Substrates included unscreened pine bark (UPB), bark particles that pass through a 2.3 mm screen (PF0), a 4.0 mm screen but not a 2.3 mm screen (PF2), 6.3 mm screen but not a 4.0 mm screen (PF4), and pine bark particles that do not pass through a 6.3 mm screen (PF6) while at 65% moisture content, and bark particles that do not pass through a 6.3 mm screen while at 65% moisture content amended with fibrous materials including 35% Sphagnum peat (P35) and 40% coconut coir (C40) by volume. The dark shaded region represents a 95% confidence interval, while the light shaded region represents a 95% prediction interval. The equation for the line of fit is: measured container capacity = 0.97 x effective container capacity Root mean square error for line of fit = 5.57 and R 2 = Figure 3.5 The reduction in volumetric water content of seven experimental pine bark-based substrates used to produce Hibiscus rosa-sinensis plantes. Substrates included unscreened pine bark (UPB), bark particles that pass through a 2.3 mm screen (PF0), a 4.0 mm screen but not a 2.3 mm screen (PF2), 6.3 mm screen but not a 4.0 mm screen (PF4), and pine xxii
23 bark particles that do not pass through a 6.3 mm screen (PF6) while at 65% moisture content, and bark particles that do not pass through a 6.3 mm screen while at 65% moisture content amended with fibrous materials including 35% Sphagnum peat (P35) and 40% coconut coir (C40) by volume. Substrates with fully rooted plants were watered to effective container capacity (maximum water holding capacity after overhead irrigation) prior to allowing to dry past permanent wilt until the plant ceased withdrawing water from the substrate. Daily reduction in substrate volumetric water contents were plotted against volumetric water content for each substrate to illustrate at what volumetric water content evapotranspiration shifts to primarily evaporation due to plant water uptake diminishing Chapter IV: The Influence of Substrate Hydraulic Conductivity on Plant Water Status of Ornamental Container Crop Grown in Sub-Optimal Substrate Water Potentials Figure 4.1 Hydraulic conductivity models for substrate water potential between and -300 hpa, based off data from evaporative moisture tension and hydraulic conductivity measures of four experimental bark-based substrates. Substrates include a control (UB), bark particles < 4 mm (FB), bark > 4 mm with 35% by vol. Sphagnum peat moss (BP), and bark > 4 mm with 35% coconut coir (BC) Figure 4.2 Moisture characteristic data (points) fit to a Brooks and Corey (1964) model (line) for four experimental bark-based substrates. Data measured xxiii
24 via evaporative method, porometer, and dewpoint potentiametry. Substrates include a control unscreened bark (A), bark particles < 4 mm (B), bark > 4 mm with 35% by vol. Sphagnum peat moss (C), and bark > 4 mm with 35% coconut coir (D) Figure 4.3 Growth index of containerized plants grown in four experimental substrates at substrate water potentials between -100 and -300 hpa for 32 days. Plant growth index was normalized to at the initiation of the research to demonstrate changes over the experimental production period. Substrates include a control (UB), bark particles < 4 mm (FB), bark > 4 mm with 35% by vol. Sphagnum peat moss (BP), and bark > 4 mm with 35% coconut coir (BC) Figure 4.4 A digital image of a representative plant from each of the four experimental substrate treatments collected 33 days after initiation of the low substrate water potential irrigation management. Substrates include an unscreened control bark (UB), bark particles < 4 mm (FB), bark > 4 mm with 35% by vol. Sphagnum peat moss (BP), and bark > 4 mm with 35% coconut coir (BC) Figure 4.5 The reduction in volumetric water content of four experimental pine bark-based substrates used to produce Hydrangea arborescens plantes. Substrates included unscreened pine bark (UB), bark particles that pass through a 4.0 mm screen (FB), bark particles that do not pass through a 4.0 mm screen while at 65% moisture content amended with fibrous materials including 40% Sphagnum peat (BP) and 40% coconut coir xxiv
25 (BC) by volume. Substrates with fully rooted plants were watered to effective container capacity (maximum water holding capacity via spray stake irrigaiton) prior to allowing to dry past permanent wilt until the plant ceased withdrawing water from the substrate. Daily reduction in substrate volumetric water contents were plotted against volumetric water content for each substrate to illustrate at what volumetric water content evapotranspiration shifts to primarily evaporation due to plant water uptake diminishing Chapter V: Utilizing the HYDRUS Model as a Tool for Understanding Soilless Substrate Water Dynamics Figure 5.1 Figure 1. HYDRUS-1D output depicting water distribution in a 250 mm tall container of A) peat-based substrate and B) pine bark-based substrate. Substrates started at container capacity representing the horizontal line at 0.83 volumetric water content (A; peat-based substrate) and 0.54 volumetric water content (B; pine bark-based substrate). Each subsequent line off the vertical (initial moisture content) line represents in situ redistribution of water at 1, 5, 15, 30, 60, 120, 300, 900, 1800, and 3600 seconds Figure 5.2 HYDRUS-1D output depicting water distribution in a 250 mm tall container of A) peat-based substrate and B) pine bark-based substrate. Substrates started at container capacity representing the horizontal line xxv
26 at 0.83 volumetric water content (peat-based substrate) and 0.54 volumetric water content (bark-based substrate). Each data series represents a depth in the container with 0 representing the upper surface of the substrate and 250 representing the lower surface Figure 5.3 HYDRUS-1D output depicting a pulse of water moving through a 250 mm tall container of A) peat-based substrate and B) pine bark-based substrate. The line to the furthest right represents 1 sec duration of the model and each subsequent line back to the equilibrium line represents predicted moisture gradient at 5, 15, 30, 60, 120, 300, 900, 1800, 3600 seconds Chapter VI: Simulating water movement in a peat and pine bark substrate Figure 6.1 Representation of the mass balance system designed to measure water flux through a container. Funnel was fit into bucket lid and provided level fit for 3.9 L container. Lysimeters measured water flux in the system (storage) and drainage (leaching) Figure 6.2 Digital representation of the upper and lower surface layers of the finite element mesh, used to construct the container. Boundary conditions are represented by colored nodes (white is no flux, green is atmospheric, and brown is seepage face). Each lateral line is a cross section of nodes. xxvi
27 The atmospheric boundary condition represents the area where water infiltrates the bulk substrate system and was measured via in situ spray stake pattern Figure 6.3 Substrate moisture tension data for A) a 3:1 (by vol.) peat: perlite substrate and B) a 9:1 (by vol.) bark: sand substrate. These data were measured utilizing an instantaneous profile method to measure both desorption and sorption data in a 3.9 L container. Solid circles represent measures of desorption (drying) cycles and empty circles represent measures of sorption (wetting) cycles Figure 6.4 Evaporative measures of moisture tension data for a 3:1 (by vol.) peat: perlite substrate and a 9:1 (by vol.) bark: sand substrate Figure 6.5 Data representing substrate hydraulic conductivity as a function of substrate water potential for A) 3:1 (by vol.) peat: perlite substrate and B) a 9:1 (by vol.) bark: sand substrate. Data were measured using an instantaneous profile method with both desorption and sorption measured separately in a 3.9 L container. Filled circles represent desorption (drying) measures, while empty circles represent sorption (wetting) measures Figure 6.6 Sensitivity curves for A) saturated volumetric water content, B) saturated hydraulic conductivity, and C) α parameters utilized in a xxvii
28 simulation of water flux through a 3:1 (by vol.) Sphagnum peat: perlite substrate, modeled with HYDRUS 3D in a 3.9 L container with maximum substrate hydration initial conditions Figure 6.7 Sensitivity curves for A) saturated volumetric water content, B) saturated hydraulic conductivity, and C) α parameters utilized in a simulation of water flux through a 9:1 (by vol.) stabilized pine bark: sand substrate, modeled with HYDRUS 3D in a 3.9 L container with maximum substrate hydration initial conditions Figure 6.8 A) storage and B) cumulative leaching curves for a 3:1 (by vol.) Sphagnum peat: perlite substrate, modeled with HYDRUS 3D in a 3.9 L container with maximum substrate hydration initial conditions. Curves represent either simulations based on hydraulic parameter measuring methods, in situ observed data, or parameters utilized to optimize models Figure 6.9 A) storage and B) cumulative leaching curves for a 3:1 (by vol.) Sphagnum peat: perlite substrate, modeled with HYDRUS 3D in a 3.9 L container with initial conditions equal to a pressure head of -100 cm. Curves represent either simulations based on hydraulic parameter measuring methods, in situ observed data, or parameters utilized to optimize models xxviii
29 Figure 6.10 A) storage and B) cumulative leaching curves for a 9:1 (by vol.) stabilized pine bark: sand substrate, modeled with HYDRUS 3D in a 3.9 L container with maximum substrate hydration initial conditions. Curves represent either simulations based on hydraulic parameter measuring methods, in situ observed data, or parameters utilized to optimize models Figure 6.11 A) storage and B) cumulative leaching curves for a 9:1 (by vol.) stabilized pine bark: sand substrate, modeled with HYDRUS 3D in a 3.9 L container with initial conditions equal to a pressure head of -100 cm. Curves represent either simulations based on hydraulic parameter measuring methods, in situ observed data, or parameters utilized to optimize models Appendices Appendix B Volumetric water content (VWC) of Hibiscus rosa-sinensis crops planted in seven different pine bark based substrates pre research in Chapter 3. Substrates included unscreened pine bark (UPB), bark particles that pass through a 2.3 mm screen (PF0), a 4.0 mm screen but not a 2.3 mm screen (PF2), 6.3 mm screen but not a 4.0 mm screen (PF4), and pine bark particles that do not pass through a 6.3 mm screen (PF6) while at 65% moisture content, and bark particles that do not pass through a 6.3 mm screen while at 65% moisture content amended with xxix
30 fibrous materials including 35% Sphagnum peat (P35) and 40% coconut coir (C40) by volume. Crops were watered to effective container capacity (maximum water holding capacity after overhead irrigation) prior to allowing to dry past permanent wilt. Measured vapor pressure deficit during the same time illustrates a relative constant diurnal flux. Table describes the time when nonlinear regression analysis determined water loss shifted from evapotranspiration to only evaporation from substrate surface via calculating breakpoint where curves shifted from nonlinear to linear. Representative VWC and substrate water potentials (Ψ) are also presented. Values within parentheses are 95% confidence intervals for VWC and Ψ Appendix C Stabilized pine bark (Pinus taeda L.) at approximately 65% moisture content by mass (moisture content of windrowed bark) was separated into particle size fractions through screening through a series of sieves. Unscreened bark was iteratively processed through sieves starting at the largest diameter sieve (i.e. 4.0 mm screened bark would have been processed through the 6.3 mm screen prior to 4.0 mm screening). Physical properties were separated via into solid, air, and water fraction. Maximum water holding capacity was subsequently split into readily available water (water held at substrate water potentials -100 hpa) and residual water (water held at substrate water potentials < -100 hpa). The Y-axis represents the percent of the container volume occupied by each of the substrate phases under maximum hydration. xxx
31 Data was previously presented in Fields, J.S., J.S. Owen, Jr. and H.L. Scoggins Exploring the influence of particle size on plant water availability in pine bark based substrates. Proceedings of the Southern Nursery Association Research Conference. 60: xxxi
32 CHAPTER I INTRODUCTION In recent decades, larger portions of the world s specialty crop agricultural production have begun adopting containerized versus conventional, in ground, production techniques to produce ornamental and specialty crops (Raviv and Leith, 2008). Recent NASS surveys estimate the U.S. nursery industry to have produced $3.8 billion in sales in 2009, with approx. $2.5 billion of those sales coming from container nursery stock (USDA, 2010). Thus, approx. 66% of nursery sales are from container production. Additionally, an overwhelming majority of specialty crops spend a portion of their life cycle in containers. Producers typically utilize soilless substrates that provide adequate air space for rapid root growth to ensure proper crop growth in containers. Soilless substrates are a classification given to rooting medium that are primarily comprised of materials not derived from field soils (i.e. sand, silt, and clay). Generally, soilless substrates are highly porous composites, which are composed of multiple components which tend to differ by regionally availability (Hanan, 1998; Abad et al., 2001). When in containers, mineral soils experience what is known as the container effect, in which the gravitational potential existing in the container (equal to the height of the container) is not enough to overcome the suction imposed on water by the small diameter pores (Bilderback, 1980; Mastalerz, 1977). Whereas in a field, the soil gravitational potential can be many meters (based on the depth of the soil profile), which will allow for ample drainage from similar diameter pores. For this reason, substrates were designed to have high porosity to alleviate any container effect issues. Moreover, producers are concerned about under watering crops, and utilizing these soilless substrates allows growers to apply excess irrigation to crops grown in these substrates before over watering becomes a 1
33 concern. Thus, substrate development primary focus has been twofold: (1) generally utilize lower bulk density materials allowing ease of relocating containers (Knox and Chappell, 2014) and (2) provide ample airspace and drainage during production to ensure adequate gas exchange and minimize disease. As a result, soilless substrates were initially developed to be inefficient in regards to water consumption. Increasingly limited freshwater, occurring regionally and temporally as a result of droughts and rising demand, has resulted in concerns over water security for specialty crop producers (O Neill and Dobrowlski, 2011). Freshwater is a critical resource for container production and all of agriculture worldwide. A study conducted in 2011 (United Nations, 2011) by the United Nations reports that 70% of the freshwater consumed by the entire world is used for agricultural purposes, while the USGS reports 40% of all freshwater withdrawn from US reserves is used for irrigation of crops (Kenney et al., 2005). With water reserves becoming limited in regions such as the western U.S. (Howitt et al., 2014), many states are starting to implement increased water regulations or restrictions on agriculture, including container nurseries (Beeson et al., 2004; Fulcher et al., 2016). Nursery crop producers often apply excess water to reduce the risk of containerized crop water stress and subsequent reduction in crop growth or loss (Mathers et al., 2005). It has been recently reported that peak water demand for containerized nursery can be upwards of 72 m 3 per acre per day (Fulcher and Fernandez, 2013). While there is a slow progression to more efficient irrigation practices, overhead sprinkler irrigation remains recommended for smaller containers (<#7 container; Bilderback et al., 2013) and is the primary irrigation method for the majority of container nurseries regardless of size (Beeson et al., 2004). Based on container spacing and crop canopy architecture, only a limited percentage of the water used in irrigation actually makes it into the container substrate. In fact, 2
34 Hanan (1996) reports that only 15 and 50% of applied water makes it to the target crop, with a mean water application efficiency of 20%. Thus, utilizing the mean we can say on a high demand day, 57.6 m 3 of water out of the 72 m 3 per acre-day applied to a container nursery via overhead irrigation will never be intercepted by the container. Furthermore, Majsztrik et al. (2011) reported that high leaching fractions (volume applied volume leached) are common in container nurseries. Aside from the loss of water, the excessive water application results in increased runoff or leaching of applied agrichemicals such as nutrients and pesticides (Millon et al., 2007). With current widespread irrigation practices still lacking in efficiency, especially for containers below #7 (Fulcher et al., 2016), with no clear direction towards sustainability, steps must be taken to provide improved water sustainability in container nurseries to ensure the industry remains viable. However, one pitfall is the basis for soilless substrate container media is rooted in inefficiency. There are multiple current research areas that provide a path towards sustainability including the use of moisture sensor automated irrigation (Chappell et al., 2013), evapotranspirational based irrigation decisions (Million et al., 2010), cultural practices including container spacing and species groupings (Beeson and Yeager, 2003), and engineering more efficient soilless substrates (Schmilewski, 2014). It is my belief, that while each of these tactics will provide much needed reprise and increase nursery sustainability, the use of all or multiple strategies in concert will provide the most influential change towards container nursery sustainability. 3
35 Literature Review Substrate hydrophysical properties Soilless substrates are often characterized by their static physical properties. These properties of most importance are often maxima (container capacity; CC) or minima (air space; AS) values, or values that describe the physical nature of the substrate and do not change as water: air ratio varies [bulk density (Db) and total porosity (TP)]. Container capacity is the maximum percentage of the volume that can be occupied by water after allowing for gravitational flow (drainage) and is synonymous with the field capacity in soils but achieved in minutes or hours versus days (White and Mastalerz, 1967). Conversely, AS is considered the minimum percentage of the volume that is occupied by air. The air and water ratio of a substrate at maximum hydration is not only determined by substrate composition, but is a function of container geometry (Bilderback and Fonteno, 1987). Bulk density is simply the mass of the solid particles (M s ) divided by the total volume of the sample (V t ), Db=M s /V t. This is an important soilless substrate classification criterion, because at the most basic level, Db describes the weight of the container. This importance stems from the weight of containers influencing the ease of translocating containers, which is one of the primary reasons container production is a rapidly increasing agricultural production sector (Raviv and Leith, 2008). Total porosity is the percentage of the container volume not occupied by solid particles (i.e. void space). This can be in the form of structural pores (pores arising from the particle structure) or internal porosity (void space within a particle itself). Total porosity can be calculated from AS and CC (TP=CC+AS). By definition, these values are static, or not being influenced by the water: air ratio of the substrate at any moment. 4
36 When taking a more in-depth look at when air and water ratio are in flux, dynamic properties, these pores can be broken down into more specific classification criteria, including gravitational pores, hygroscopic pores, and capillary pores. These three classifications are based on the tension with which water is held into the pores, which in essence is primarily driven by pore diameter. Gravitational pores, are pores that would remain unoccupied by water when exposed to gravitational forces (i.e. allowed to free drain). As such, gravitational pores are often considered to be representative of the AS of a container substrate. Since gravitational head or suction is based on the height of the column, the CC: AS ratio of a substrate is also dependent upon the height of the container (Bilderback and Fonteno, 1987). Hygroscopic pores are not true pores in the sense of the word, but instead infinitesimally small void space surrounding solid particles. This hygroscopic zone is the interface between solid particles and the surrounding environment. As water is introduced into the system, it will become bound to the surface of particles, and due to the adhesive nature of water, this interface will exist at high tensions and water will often not move. Under normal production conditions, the occupancy volume of water in gravitational and hygroscopic pores will often not alter. However, the water: air ratio for capillary pores tends to be in constant flux. Capillary pores are pores that hold water at tensions between gravitational and hygroscopic. The water existing in these pores is generally available for plant use, as well as able to be distributed through the substrate. As a result, the water in these pores (often the largest volume of the three in traditional substrates) is repeatedly being consumed, redistributed, and replenished through production and plant interactions. Because the air: water ratio of pores fluctuate during crop production, more dynamic properties based on the substrate water content provide more information about crop water status (Caron et al., 2013). Utilizing dynamic substrate properties via moisture characteristic curves 5
37 (MCC) we can provide a more definite substrate classification system. Moisture characteristic curves, first described for soilless substrates by Bunt (1961), are a function that represents the relationship between volumetric water content and water potential (or pore tension) for a porous media. This relationship can provide researchers with not only estimates of static physical properties (Milks et al., 1999), but also provide information regarding the degree of plant water availability (de Boodt and Verdonck, 1972), and water theoretical point of water unavailability (Fields, 2013). There are differences in substrate MCC depending on whether measurements are from desorption (water loss) or sorption (hydration), and the difference is due to substrate hysteresis. Hysteresis describes the phenomenon of where the state of soil water and equilibrium is dependent on whether water is filling or voiding a media (Hillel, 1998). By that, there is an effect where pores are filled and drained at different rates and tensions based on the energy to overcome the tension of water entering versus exiting a pore, termed hysterics. This, in part, is the issue discussed with the capillary bundle theory for water movement by Hunt et al. (2013). In this work, Hunt et al. discusses the idea of virtual pores. Virtual pores are falsely measured pores in MCCs where water from larger diameter pores drains when the smaller diameter surrounding pores drain, and thus the pore volume is attributed to the smaller pore size. Substrate hysteresis is not commonly considered when MCCs are measured; however, much information about the water dynamics of substrate systems can be informed through the use of hysteretic curves. Frequent needed irrigation events for plants produced in soilless substrates lead to increased hysteretic influences on substrate water dynamics (Heinen and Raats, 1999). Naasz et al. (2005) measured hysteretic effects in peat and pine bark substrates, noting that peat substrates exhibited greater hysteretic effects than bark substrates. This was due to the increased percentage 6
38 macropores in the bark substrate, reducing the volume of inaccessible pores. Similar observations were described by Michel et al. (2008), who noted that hysteresis also influenced substrate wettability, gas diffusivity, and shrink/swell of peat substrates, with little effect on hydraulic conductivity. Anlauf et al. (2016) described the increased impact of substrate hysteresis in ebb and flow irrigation systems. Another dynamic property that varies based on the water status of the container is hydraulic conductivity, which is essence is the ease at which water moves through a porous media. As a result of the cohesive and adhesive nature of water, when the water: air ratio increases (i.e. volumetric water content increases) there is higher proportions of capillary water, which fills more pores and allows more paths for water to move. Generally, saturated hydraulic conductivity is much greater than unsaturated hydraulic conductivity, due to the fact that at saturation, pores are filled with water, providing greater ease of flow, and reducing tortuosity (Fonteno, 1993). Unsaturated hydraulic conductivity has been shown to limit plant access to water in mineral soils by affecting the distance from which water can be accessed by plants (Campbell and Campbell, 1982), and later discussed for soilless substrates (Raviv et al., 1999). Wallach et al. (1992) showed that minimal differences in substrate volumetric water content result in great changes in substrate unsaturated hydraulic conductivity, especially as the volumetric water content is reduced. Additionally, da Silva et al. (1993) discussed measuring substrate hydraulic conductivity in soilless substrates to aid in substrate characterization and to make more informed irrigation decisions. However, due to the difficult nature of the measurements of unsaturated hydraulic conductivity, researchers often primarily measure saturated hydraulic conductivity in soilless substrates (Caron and Elrick, 2005). Raviv et al. (1999) discussed importance of measuring in situ hydraulic conductivity, also noting difficulty of 7
39 measurement, and described the need for better understanding the relationship between hydraulic conductivity and water content. Other dynamic substrate properties which are of importance when engineering soilless substrates include gas diffusivity (Allaire et al., 1996; Caron et al., 2010), gas flux (Naasz et al., 2008), gas consumption and aeration (Wever et al., 2004), wettability (Fields et al., 2013; Michel, 2015) and pore tortuosity (Kerloch and Michel, 2015). Water use efficiency The limited nature of worldwide water resources has led to the need for more efficient use of water in agricultural practices (Howell, 2000; Wallace, 2000). Researchers have developed the idea of water use efficiency (WUE) as abroad metric utilized to quantify the efficient use of water in agriculture. Water use efficiency is an interesting metric, as there is no one size fits all formula to calculate. Instead, WUE is defined based on the individual research. However, all WUE calculations are based on the quantity of water required to produce a unit of biomass (Kramer, 1983). Conventionally, WUE measures are separated into two broad categories, integrated and intrinsic (Bacon, 2009). Integrated WUE, also referred to as production WUE, is a measure over time to measure water used per biomass allocation. This has been measured both as water applied and water used (transpired) per dry mass. Intrinsic WUE, also referred to as instantaneous or photosynthetic WUE, is the rate of carbon allocation per the rate of transpiration. Garland et al. (2012) demonstrated that the two measures of WUE are not directly related. Thus it is often important for researchers to determine which measure proves more informative for the specific research question. Reductions in substrate water content have been shown to increase WUE in some bedding plants (Nemali and van Iersel, 2008). Other research has shown that WUE maximizes 8
40 when substrate VWC 30% and decreases with both increasing and decreasing VWC (Garland et al., 2012). Drought stress has been shown to increase in WUE in ornamental crops (Egilla et al., 2005). In all of these cases aside from research by Garland et al. (2102), reduction of water availability resulted in plants utilizing water more efficiently. Researchers have employed various other tactics to improve WUE in crop production, including soil management (Hatfield et al., 2001), nutrition management (Stoven et al., 2006), lighting effects (Garland et al., 2012), irrigation management (Montesano et al., 2016), various breeding techniques (Condon et al., 2004), hormonal regulation (Cantero-Navarro, 2016), just to name a few. Plant water availability Available water capacity was first described by Veihmeyer and Hendrickson (1927) as the difference in water content between field capacity and permanent wilting point (PWP) in field soils. However, Richards (1928) felt this term was generalized and proposed that available water capacity should be considered the ability of the plant to absorb water from the soil, as well as the velocity at which water moves through the soil to replace the water used by the plant. Richards and Wadleigh (1952) further redefined the term available water capacity as the range of water stored in soil and available for plant use. Today, it is widely accepted that water availability is the difference between the maximum water holding capacity and PWP, which in Soil Science is accepted to occur at a water potential of -1.5 MPa (Hillel, 2004). Permanent wilting point is considered the soil/substrate water potential where plants can no longer uptake water from the rooting medium. Permanent wilting point, determined by Furr and Reeve (1945) who allowed sunflowers to reach PWP while measuring soil water potential, is understood to 9
41 occur in taxa between soil water potentials of -1.0 and -2.0 MPa, on average -1.5 MPa, and is taxa specific. Furthermore, infinitesimal reductions in water content equate to large, rapid changes in water potential and subsequent decreases in hydraulic conductivity. Therefore, water delivery to the roots becomes restricted and plants are unable to rehydrate transpirational water loss (Taiz and Zeiger, 2010) at low water potentials (often near -1.5 MPa). Hagan (1956) pronounced PWP not as a transition point but a transition approach, showing as the water potential approaches PWP water becomes more unavailable. However, de Boodt et al. (1974) cautioned that the measurement of -1.5 MPa water potentials as a lower limit for water availability was of no use for greenhouse produced ornamental crops. Plants have been shown to reduce transpiration rates at soil water potentials as high as -0.2 MPa (Denmead and Shaw, 1962). Horticultural crops in peat substrates can exhibit stress signals when the substrate water potential reaches MPa (Caron et al., 1998), which is approx. the same substrate water potential where decreased plant dry mass was observed in chrysanthemum by Kiehl et al. (1992). Modeling container water dynamics Computational models are used quite extensively in agriculture to help researchers predict outcomes in many scenarios, whether it be regarding mineral nutrition, crop production timing, atmospheric conditions, pest emergence, or water loss to schedule irrigation. Many models are compiled utilizing existing data fit to an algorithm or function formula which allows for prediction of a variable with the inputs of other variables. Other models are based off solving existing equations to describe physical or chemical processes, whilst still involving the input of known or measured variables or data. One such model, currently utilized heavily in the fields of soil science, engineering, and geohydrology, is the HYDRUS computer model (Simunek et al., 1997). This computational program utilizes input data to solve the Richard s equation, (Richards, 10
42 1931) which predicts unsaturated flow in porous media numerically, in order to predict movement and location of water within a defined system of chosen boundary conditions. To solve this equation, the HYDRUS model incorporates Galerkin type linear finite element schemes, which in essence means HYDRUS takes a finite number of different aspects of the Richard s equation into account and solves each individually, then compiles the solutions, ensuring that all compiled solutions fit within specified boundary conditions, to create a finalized solution. The HYDRUS model also allows for inverse modeling of hydraulic properties, by which measured data are incorporated into the model and HYDRUS will utilize a Marquat- Levenberg type parameter estimation to predict hydraulic properties and relationships. The HYDRUS computational model has been developed to allow for observations of predicted water flow in 1-dimensional, 2-dimensional, and 3-dimensional scenarios with increasing complexity in calculations and inputs to derive a solution. While being heavily relied upon to predict water and solute movement in field soils, HYDRUS has not been a major tool utilized in soilless substrate research in the past. Understanding of water dynamics in soilless substrates is imperative if researchers want to develop more water efficient soilless substrates. Raviv et al. (2004) discussed the importance of understanding water-substrate interaction during and between irrigation events, concluding that the difference in substrate physical properties during transient conditions influences crop water relations differently than steady state measurements. Fields et al. (2016) used HYDRUS-1D to predict the spatial-temporal location of water in both peat and bark substrates during transient and steady-state conditions. Naasz et al. (2005) used 1-dimensional models to understand the dynamics of air and water relationships in peat substrates. Recently, Caron et al. (2013) indicated the ability to utilize HYDRUS models to predict water flow in soilless substrates, and presented 11
43 the merits of utilizing the model. Previously, the HYDRUS-2D model has been utilized to successfully predict water flow in perlite using measured hydraulic properties (Wever et al., 2004). Anlauf et al. (2012) modeled water movement and substrate hysteresis in a peat substrate in an ebb and flow production setting utilizing HYDRUS-1D. Anlauf et al. (2016) noted that hysteretic measurements of peat-based container substrates amended with pine bark were crucial in predicting accurate outcomes in ebb and flow systems. The HYDRUS-1D model has also been used to predict solute transport in soilless substrates with the authors cautioning the need to calibrate models in situ for certain ions (Boudreau et al., 2009). Literature Cited Abad, M., P. Noguera, and S. Bures National inventory of organic wastes for use as growing media for ornamental potted plant production: case study Spain. Biores. Tech. 77: Allaire, S.E., J. Caron, I. Duchesne, L.E. Parent, and J.A. Rioux Air-filled porosity, gas relative diffusivity, and tortuosity: indices of Prunus x cistena sp. growth in peat substrates. J. Amer. Soc. Hort. Sci. 121: Anlauf, R., P. Rehrmann, and H. Scharat Simulation of water and air distribution in growing media. J. Hort. For. 4: Anlauf, R., P Rehrmann, and A. Bettin Reduction of evaporation from plant containers with cover layers of pine bark mulch. Eur. J. Hort. Sci. 81:
44 Bacon, M Water use efficiency in plant biology. Oxford: Blackwell Publishing Ltd., ISBN Beeson, Jr., R.C., and T.H. Yeager Plant canopy affects sprinkler irrigation application efficiency of container-grown ornamentals. HortScience. 38: Beeson, Jr., R.C., M.A. Arnold, T.E. Bilderback, B. Bolusky, S. Chandler, H.M. Gramling, J.D. Lea-Cox, J.R. Harris, P.J. Klinger, H.M. Mathers, J.M. Ruter, and T.H. Yeager Strategic vision of container nursery irrigation in the next ten years. J. Environ. Hort. 22: Bilderback, T.E. and W.C. Fonteno Effects of container geometry and media physical properties on air and water volumes in containers. J. Environ. Hort. 5: Bilderback, T. E Container soils and soilless media. In V. P. Bonaminio (ed.) North Carolina Nursery Crops Production Manual. N. C. Agr. Ext. Ser. NCPM:9. p Bilderback, T., C. Boyer, M. Chappell, G. Fain, D. Fare, C. Gilliam, B.E. Jackson, J. Lea-Cox, A.V. LeBude, A. Niemiera, J. Owen, J. Ruter, K. Tilt, S. Warren, S. White, T. Whitewell, R. Wright, and T. Yeager Best management practices: Guide for producing Boudreau, J., J. Caron, D. Elrick, J. Fortin, and J. Gallichand Solute transport in subirrigated peat-based growing media, Canadian Journal of Soil Science, 89: Bunt, A.C Some physical properties of pot-plant composts and their effects on growth. Plant and Soil 13: Campbell, G.S., and M.D. Campbell Irrigation scheduling using soil moisture measurements: theory and practice. Adv. Irr. 1:
45 Cantero-Navarro, E., R. Romero-Aranda, R. Fernández-Muñoz, C. Martínez-Andújar, F. Pérez- Alfocea, and A. Albacete Improving agronomic water use efficiency in tomato by rootstock-mediated hormonal regulation of leaf biomass. Plant Sci. Caron, J., H.L., Xu, P.Y. Bernier, I. Duchesne, and P. Tardif Water availability in three artificial substrates during Prunus x cestena growth: variable threshold values. J. Amer. Soc. Hort. Sci. 123: Caron, J. and D.E. Elrick Measuring unsaturated hydraulic conductivity of growing media with a tension disk. Soil Sci. Soc. Amer. J. 69: Caron, J., P. Morel, L.M. Rivere, and G. Guillemain Identifying appropriate methodology to diagnose aeration limitations with large peat and bark particles in growing media. Can. J. Soil. Sci. 90: Caron, J., S. Pepin, and Y. Periard Physics of growing media in a green future. Acta Hort. 1034: Chappell, M., S.K. Dove, M.W. van Iersel, P.A. Thomas, and J. Ruter Implementation of wireless sensor networks for irrigation control in three container nurseries. HortTech. 23: Condon, A.G., R.A. Richards, G.J. Rebetzke, and G.D. Farquhar Breeding for high wateruse efficiency. J. Exp. Bot. 55: da Silva, F.F., R. Wallach, and Y. Chen Hydraulic properties of sphagnum peat moss and tuff (scoria) and their potential effects on water availability. Plant and Soil. 154:
46 de Boodt, M., O. Verdonck, and I. Cappaert Determination and study of the water availability of substrates for ornamental plant growing. Acta Hort. 35: Denmead, O.T., and Shaw, R.H Availability of soil water to plants as affected by soil moisture content and meteorological conditions. Agron. J. 45: Egilla J.N., Davies, Jr., F.T., and T.W. Button Drought stress influences leaf water content, photosynthesis, and water-use efficiency of Hibiscus rosa-sinensis at three potassium concentrations. Photosynthetica 43: Fields, J.S Hydrophysical properties and Hydration Efficiency of Traditional and Alternative Greenhouse Substrate Components. M.S. Thesis, N.C. State Univ., Raleigh, NC. Fields, J.S., W.C. Fonteno, and B.E. Jackson Hydration efficiency of traditional and alternative greenhouse substrate components. HortScience. 49: Fields, J.S., J.S. Owen, Jr., R.D. Stewart, and J.L. Heitman Utilizing the HYDRUS model as a tool for understanding soilless substrate water dynamics. International Symposium on Growing Media, Composting, and Substrate Analysis, Vienna, Austria. Acta Hort. (in press). Fonteno, W.C Problems & considerations in determining the physical properties of horticultural substrates. Acta Hort. 342: Fulcher, A., A.V. LeBude, J.S. Owen, Jr., S.A. White, and R.C. Beeson The next ten years: strategic vision of water resources for nursery and greenhouse producers. HortTechnology. 26:
47 Furr, J.R. and J.O. Reeve The range of soil-moisture percentages through which plants undergo permanent wilting in some soils from semi-arid and irrigated areas. J. Ag. Res. 71: Garland, K.F., S.E. Burnett, M.E. Day, and M.W. van Iersel Influence of substrate water content and daily light integral on photosynthesis, water use efficiency, and morphology of Heuchera americana. J. Amer. Hort. Sci. 137: Hagan, R.M Factors affecting soil moisture-plant growth relations. Int. Hort. Congr., Rep., 14. pp Hanan, J.J., Greenhouses: Advanced technology for protected horticulture. CRC Press: Boca Raton. Hatfields, J.L., T.J. Sauer, and J.H. Prueger Managing soils to achieve greater water use efficiency: a review. Agron. J. 93: Heinen, M. and P.A.C. Raats Hydraulic properties of root zone substrates used in greenhouse horticulture. p In: M.Th. van Genuchten et al. (eds.), Proceedings of the International Workshop on the Characterization and measurement of the hydraulic properties of unsaturated porous media, University of California, Riverside, USA. Hillel, D Environmental Soil Physics 2 nd ed Academic Press, San Diego, CA Howell, T.A Enhancing water use efficiency in irrigated agriculture. Agron. J. 93:
48 Howitt, R., J. Medellín-Azuara, D. MacEwan, J. Lund., and D. Sumner Economic analysis of the 2014 drought for California agriculture. Center for Watershed Sciences, University of California, Davis. Hunt, A.G., R.P Ewing, and R. Horton What s wrong with soil physics? Soil Sci. Soc. Amer. J. 77: Kenney, J.F., N.L. Barber, S.S. Hutson, K.S. Linsey, J.K.. Lovelace, and M.A. Maupan Estimated use of water in the United States in US Geological Services circular Kerloch, E. and J.C. Michel Pore tortuosity and wettability as main characteristics of evolution of hydraulic properties of organic growing media during cultivation. Vadose Zone J. 14: Kiehl, P.A., J.H. Lieth, and D.W. BurgeF Growth response of chrysanthemum to various container medium moisture tension levels. J. Amer. Soc. Hort. Sci. 117: Knox, G.W. and M. Chappell Alternatives to petroleum-based containers for the nursery industry. Fl. Coop. Ext. Serv. ENH1193. Kramer, P.J Water relations of plants. Academic Press, Inc., London. Majsztrik, J.C., A.G. Ristvey, and J.D. Lea-Cox Water and nutrient management in the production of container-grown ornamentals. Hort. Rev. 38: Mastalerz, J.W The greenhouse environment: the effect of environmental factors on the growth and development of flower crops. New York: John Wiley and Sons Mathers, H.M., Yeager, T.H., and Case, L.T Improving irrigation water use in container nurseries. HortTechnology 15:
49 Michel, J.C., R. Naasz, S. Charpientier, P. Morel, L.M. Riviere, and J. Caron Water repellency of organic media and its consequences on their hydraulic properties. Acta Hort.779: Michel, J.C Wettability of organic growing media used in horticulture: A review. Vadose Zone J. 14: Milks, R. R., W. C. Fonteno, and R. A. Larson Hydrology of horticultural substrates: II. Predicting physical properties of media in containers. J. Amer. Soc. Hort. Sci. 114: Million, J., Yeager, T., and J. Albano Consequences of excessive overhead irrigation on runoff during container production of sweet viburnum. J. Environ. Hort. 25: Million, J.B., T.H. Yeager, and J.P. Albano Evapotranspiration-based irrigation scheduling for container-grown Viburnum odoratissimum (L.) Ker Gawl. HortScience. 45: Naasz, R, J.C., Michel, and S. Charpentier Measuring hysteretic hydraulic properties of peat and pine bark using a transient method. Soil Sci. Soc. Amer. 69: Naasz, R., J.C. Michel, and S. Charpentier Modelling oxygen and water flows in peat substrates with root uptakes. ISHS-IPS, International Symposium on Growing media, September , Angers, France. Acta Hort. 779: Nemali, K.S. and M.W. van Iersel An automated system for controlling drought stress and irrigation in potted plants. Scientia Horticulturae 110: O Neill, M.P., and J.P. Dombrowolski, Water and agriculture in a changing climate. HortScience. 46:
50 Raviv, M., R. Wallach, and T.J. Blom Effects of physical properties of soilless media on plant performance - a review. Acta Hort. 644: Raviv, M. and J.H. Lieth Soilless culture: Theory and practice. Elsevier s Publishing, San Diego, CA Raviv, M., R. Wallach, A. Silber, S. Medina, and A. Krasnovsky The effect of hydraulic characteristics of volcanic materials on yield of roses grown in soilless culture. J. Amer. Hort. Sci. 124: Richards, L.A The usefulness of capillary potential to soil moisture and plant investigators. J. Agr. Res. 37: Richards, L.A Capillary conduction of liquids through porous mediums. Physics 1: Richards, L.A. and C.H. Wadleigh Soil water and plant growth. In B. Shaw (ed) Soil Physical Conditions and Plant Growth. Academic Press, New York pp Schmilewski, G Producing growing media responsibly to help sustain horticulture. Acta hort. 1034: Simunek, J., K. Huang, and M.T. Van Genuchten The HYDRUS-ET software package for Simulating the One-Dimensional Movement of Water, Heat and Multiple solutes in variably-saturated Media, Version 1.1 pp Bratislava: Inst Hydrology Slovak Acad. Sci. 19
51 Stoven, A.A., H.M. Mathers, and D.K. Struve Fertilizer application method affects growth, nutrient, and water use efficiency of container-grown shade tree whips. HortScience. 41: Taiz, L. and E. Zeiger Plant physiology, 4th ed. Sinauer Assoc. Inc., Publishers, Sunderland, MA United Nations Water for food innovative water management technologies for food security and poverty alleviation. UNCTAD Current studies on science, technologies, and innovation. UNCTAD/DTL/STICT/2011/2, New York and Geneva. Wallace, J.S Increasing agricultural water use efficiency to meet future food production. Ag., Ecosystems & Environ. 82: Wever, G., J.S. Nowak, O.M. de Sousa Oliveira, and A. van Winkel Determination of hydraulic conductivity in growing media. Acta Hort. 648, White, J.W. and Mastalerz, J.W Soil moisture as related to container capacity. Proc. Amer. Soc. of Hort. Sci. 89:
52 CHAPTER II The Use of the Evaporative Method for Determination of Soilless Substrate Moisture Characteristic Curves Formatted to fit style guide for publication in Scientia Horticulturae Original publication August 29, 2016 Citation: Fields, J.S., J.S. Owen, Jr., L. Zhang, W.C. Fonteno The use of the evaporative method for determination of soilless substrate moisture characteristic curves. Scientia Horticulturae. 211:
53 Abstract. Historically, substrate science has utilized the pressure extraction method to measure soilless substrate moisture characteristic curves, albeit with published discrepancies. Recently, a device utilizing the evaporative method to generate moisture characteristic curves by measuring water potential as volumetric water content decreases via evaporation, known as a Hyprop, has become available. This research compares and contrasts moisture characteristic curves developed over a 2-week period using both the pressure extraction and the evaporative methods for twocomponent greenhouse (Sphagnum peat and perlite) and nursery (aged pine bark and sand) soilless substrates. The pressure extraction method was conducted between water potentials of 0 and -300 hpa (10 data points used in conventional methodology for allotted time), while the evaporative method measurements continued until the tensiometers cavitated ( -500 to -700 hpa) and provided higher data density (100 data points) within the two week period. The evaporative method was found to produce repeatable results, with subsequent measurements of each substrate providing analogous measurements (P > and P > for the peat and bark substrate, respectively). There was little variation between the two methodologies for the peat substrate (0.004% difference in the area under the curves from 0 to -300 hpa). However, differences were observed between the methodologies for the bark substrate, with the percentage difference increasing with decreasing water potential (9.6% at -100 hpa; 23.7% at -300 hpa). Additionally, the evaporative method measured a continued decrease in volumetric water content of the aged pine bark and sand substrate with increasing water potentials throughout the range of measurements, unlike the pressure extraction method, which has documented issues with loss of hydraulic connectivity between the sample and the plate in coarse highly porous organic substrates. Therefore, the pressure extraction method ceases to decrease in volumetric water content ( -65 hpa) resulting in a divergence in curves generated by the two methods. Both 22
54 methods were found to have limitations while measuring substrate water content near saturation, with the pressure plate resistance to free drainage of water influencing measurements and the evaporative method continually underestimating the saturation point. As a result, both methods provided decreased volumetric water content measurements near saturation than when static physical properties were directly measured; therefore, moisture characteristic curves should be used collectively with static properties to correct for underestimation of total porosity and to better yield an understanding of the hydrophysical properties of a soilless substrate. 23
55 Introduction Fresh water is a limited natural resource, and it is a vital component of container crop production. A container nursery consumes upwards of 72 m 3 of water per acre each day during the growing season (Fulcher and Fernandez, 2013). The 2014 Census of Agriculture shows that specialty crop sales have increased by 18% since the previous census in 2009 with the vast majority of these crops spending at least a portion of their life cycles in containers (U.S. Department of Agriculture, 2015). Soilless substrates have been heavily relied upon for production of containerized crops for decades with their use in specialty crop production increasing (Raviv and Leith, 2007). It is important that research be conducted to understand and engineer soilless substrates for production systems that more effectively utilize resources, namely water and mineral nutrients, in order for the containerized specialty crop industry to continue to flourish. A more in depth understanding of the hydraulic properties of soilless substrates may prove beneficial to this undertaking. Historically, research has focused on measuring and altering the static physical properties [total porosity (TP), measured maximum water holding capacity (container capacity; CC) and minimum of air space (AS)] of soilless substrates to optimize the relative ratio of air and water (Bilderback et al., 2005). However, more recently, Caron et al. (2014) emphasized the need to investigate dynamic properties when analyzing soilless substrates to correctly understand hydrology over the course of producing containerized crops. This approach would utilize moisture characteristic curves (MCCs) to understand soilless substrate dynamic properties as opposed to solely analyzing static physical properties which do not represent conditions during wetting or drying. Moisture characteristic curves have been utilized by researchers to quantify hydrophysical properties and make inferences into the hydrology of soilless substrates since first 24
56 described by Bunt (1961). A MCC is conventionally generated by applying incremental pressure increases to a substrate sample on a pressure plate to extract water that is held at varying tensions (Klute, 1986). The amount of water remaining at each pressure is used to calculate volumetric water content (ϴ) associated with that pressure. The resulting data are interpreted as the relationship between water potential (Ψ) and ϴ, referred to as the MCC, which differs between individual substrates. Data from MCCs have been used to make inferences of gas and water flux within a soilless substrate, with an emphasis on water available to produce containerized crops. Most notably, MCCs have been used to describe water availability for subirrigated containerized crops; defining readily available water as occurring between tensions of -10 to -100 hpa (Ψ 10 to Ψ 100 ) and further partitioned into easily available water between tensions of -10 to -50 hpa (water occurring between Ψ 10 to Ψ 50 ) and water buffering capacity (water occurring between Ψ 50 to Ψ 100 ; de Boodt and Verdonck, 1972). Additional methods to generate MCCs in mineral soils have been described by Dane and Hopmans (2002). One method, known as the evaporative method, was first proposed by Wind (1968) and later simplified by Schindler (1980). The simplified evaporative method involves simultaneously measuring Ψ and gravimetric water content of a sample as water evaporates from an exposed surface. This method can also be simultaneously used to calculate hydraulic conductivity. Wendroth et al. (1993) confirmed the application of evaporative method for mineral soils; however, the authors cautioned that soils with extreme textures (i.e. relatively small or large particle sizes) should be examined for suitability to utilize the evaporative method. Schindler and Muller (2006) more recently pronounced the need for increased data density in order to more accurately describe evaporative functions. Furthermore, Peters and Durner (2008) 25
57 described uncertainties regarding low precision in hydraulic conductivity measurements at large values of ϴ when using the evaporative method. A device known as the Hyprop (Hydraulic property analyzer; UMS, Munich, Germany) recently became commercially available and is being utilized to measure the relationships between ϴ, Ψ, and hydraulic conductivity in variably saturated porous media. The Hyprop utilizes a simplified evaporative method as described by Schindler et al. (2010) and yields increased data density which negates inaccuracies of the predictive method exposed by Schindler and Muller (2006) as well as Peters and Durner (2008). Schelle et al. (2013) compared multiple lab methodologies for obtaining MCCs of mineral soils including both the evaporative method and the traditional pressure plate method, concluding that in mineral soils the pressure plate method has the tendency to overestimate ϴ. No such comparisons exist for highly porous organic soilless media. Recently, Schindler et al. (2016) published research in which MCCs for primarily peat-based substrates were measured utilizing the evaporative method. However, there were no comparisons to more traditional methodologies in order to address the cautions of Wendroth et al. (1993) for extreme particle sizes (i.e. soilless substrates). The goal of this research was to determine whether the evaporative method for obtaining MCCs would be valid for coarse, highly porous, dominantly organic soilless substrates. The authors hypothesized that the evaporative method will provide repeatable data that is analogous to the pressure extraction method for organic soilless substrates, with continued measurements of diminishing volumetric water content as substrate water potential decreases beyond the water potential that substrate samples lose connectivity. Specific objectives were to: (1) Determine the capacity of the evaporative method to provide consistent, reproducible data for bark or peat based soilless substrates; and (2) compare MCCs obtained with the evaporative method to those 26
58 obtained with pressure plates. The testing of these hypotheses will allow researchers to realize inaccuracies or concerns that may be associated with employing the new or existing technologies for measuring MCCs discussed in this paper. As such, this study provides an initial evaluation of dynamic property measurements for highly porous soilless substrates utilizing this new methodology. Materials and Methods Static physical properties. Two different soilless substrates; a substrate primarily utilized in open air nursery production, composed of 9 aged pine bark (Pinus taeda L.; Carolina Bark Products, Seaboard, NC) : 1 mason sand (Heard Aggregates, Waverly, VA; by volume); and a commercially available substrate traditionally used in greenhouse production, composed of Sphagnum peat moss and perlite (Fafard 1-P; Sungro, Agawam, MA) were used for this experiment. Henceforth they are referred to as bark and peat, respectively. Static physical properties including TP, CC, AS, and bulk density (D b ) were determined for each substrate using porometer analysis following procedures in Fonteno and Harden (2010; Table 1). In addition, particle size distribution of 100 g oven dried samples were determined for three replicates of each substrate by passing the substrate through seven sieves (6.30, 2.00, 0.71, 0.50, 0.25, 0.11 mm openings) and a lower catch pan. Sieves and pan were shaken for 5 min with a Ro-Tap shaker (Rx-29; W.S. Tyler, Mentor, OH). The particles that were retained on each sieve that passed through the 0.11 mm sieve were weighed individually to determine the particle size distribution (Table 1). 27
59 Pressure extraction method. Moisture characteristic curves for four replicates of each substrate were produced utilizing volumetric pressure plate extractors (VPPE; Soilmoisture Equipment Corp., Santa Barbara, CA) at the North Carolina State University Horticultural Substrates Laboratory (Raleigh, NC) using the method described by Milks, et al. (1989), adapted from Klute (1986). Prior to packing, substrates were hydrated to 60% and 70% ϴ for bark and peat, respectively. Four replicates of each sample were packed in aluminum cores (7.5 cm ht x 7.5 cm i.d.) using a packing column in the same process as with the porometer analysis to ensure uniform D b (peat 0.11±0.005 SE g cm 3 ; bark 0.32±0.005 g cm 3 ). The substrate filled cores were placed on 500 hpa porous ceramic plates (Soilmoisture Corp., Santa Barbara, CA). Samples were then saturated with tap water from below (water poured outside the aluminum cores moves through the ceramic plates into the sample) and allowed to equilibrate for 48 h prior to draining and recording volume of effluent. Pressure, from compressed air, equaling 10 hpa was then applied to the VPPE and allowed to equilibrate for 48 h. The water expressed from the sample was then collected and measured. This process was repeated for pressures of 20, 40, 50, 75, 100, 200, and 300 hpa. After the 300 hpa pressure measurement, cores were removed from VPPEs and dried in a forced air drying oven at 105 C for 48 h. Data were used to calculate ϴ at each pressure. It is worth noting that ceramic plates with different pore sizes can be utilized to extend the range of measurements for the pressure extraction method beyond pressures of 300 hpa; however, these values and maximum applied pressure were chosen based on conventional practices and time restraints. Volumetric water contents for saturation (Ψ 0 ) and free drainage (Ψ 3.8 ) were replaced with TP and CC from porometer analysis to correct for inhibition of free drainage through the ceramic plate, as per Milks et al. (1989). 28
60 Evaporative method. Three replicates of each substrate were analyzed via the evaporative method utilizing a Hyprop (UMS, Munich, Germany). These analyses produced MCCs, as well as graphical depictions of hydraulic conductivity as a function of ϴ and Ψ. Procedures set forth by Schindler et al. (2010) were followed to develop MCCs with additional steps. Prior to analysis, samples were hydrated with precise quantity of water to obtain ϴ of 60% and 70% for the bark and peat substrates, respectively, and allowed to equilibrate for 24 h. The beveled aluminum core (250 ml, 5 cm ht x 8 cm i.d.) was fitted with two separate cores of equal inner and outer diameter on the bottom (5 cm ht) and top (10 cm ht) of the sample core to create a packing column (total ht of 20 cm). Following packing procedures similar to porometer analysis, the column was loosely filled from the top with substrate, and the column was lifted to a height of 10 cm and dropped on a level surface five times, resulting in uniform D b within each core to be analyzed equal to that of the porometer and pressure extraction analyses (Table 1), and comparable to substrate D b in a production container. The packed core was fixed with a piece of cheese cloth and the perforated base plate (UMS, Munich, Germany). Samples were then incrementally saturated with deionized water from below (water poured outside the aluminum cores) with an effort to minimize trapped air in pore spaces and allowed to equilibrate for 24 h to ensure total saturation. Cores were drained by removing a rubber stopper from the bottom of the saturation container. Two holes were then bored at two depths (3.75 and 1.25 cm from the base) into the packed substrate using an auger and the auger positioning tool (UMS, Munich, Germany). The base of the device, affixed with two tensiometers, was fitted precisely to the substrate placing each tensiometer into the bored holes. After the core containing the substrate was affixed with degassed tensiometers, the sample was placed on a scale (Kern EG-2200, Kern & Sohn GmbH, 29
61 Balingen, Germany) and connected to a computer to record water potential of the two tensiometers and total weight of the device with affixed sample every 10 min using Tensioview software (UMS, Munich, Germany). These measurements continued until water in the upper tensiometer cavitated as a result of exceeding theoretical water potential limits ( -850 hpa) or from a loss of connectivity between the water in the tensiometer and water in the surrounding substrate. Once analysis was complete, substrate was removed from the core, dried in a forcedair oven at 105 C for 48 h and weighed. Data were fit using HypropFit software (UMS, Munich, Germany) to generate curves depicting the relationships between ϴ and Ψ. Data Analysis. Data were analyzed using R:3.2.0 ( Since the assumptions of parametric test are not always met for all cases, to keep our results comparable and consistent, reproducibility of results were analyzed using several non-parametric statistical methods including (1) the Kolmogorov Smirnov test (Conover, 1999) to determine whether ϴ from any two replicates are from the same continuous distribution and (2) the Kruskal-Wallis rank sum test (Hollander and Wolfe, 1973) to determine whether significant differences existed among samples. In both methods, we grouped ϴ by discretized suction levels, where the range of suction levels were divided into small intervals and the calculated the average water contents at each interval, since the evaporative method measures Ψ based on time, and assumed each series of observations was an independent sample. We further strengthened our analysis by fitting curves of each replicate of each substrate using a smoothing spline. Since the MCCs have similar trends and shapes, the percent difference of areas under the curves was calculated as a measurement of the difference amongst any two curves. Moreover, since the difference in suction levels can be viewed as a sequence of time elapsed, a series alignment for each replicate 30
62 of each substrate was computed employing dynamic time warping (DTW) algorithm, which optimally deforms one (query) of the two input series onto the other (Giorgino, 2009). A 0.05 significance level was used for hypothesis testing. Data from the evaporative method were truncated (Ψ 0 to Ψ 300 ) and utilized to contrast the two methods since the pressure plate data in this experiment concluded at a suction of 300 hpa. The Kolmogorov Smirnov test was again used to conclude non-parametrically whether the two methods yielded similar data. The Kruskal-Wallis rank sum tests were also used to contrast the MCCs from the two methodologies. The percentage difference in area under the curves was also calculated using formulation [1]. Where AUC1 denoted the area under the first curve, which was chosen as our baseline; and AUC2 denoted the area under the second curve, then the percentage differences are defined as: After noting that differences in methodologies exist for the bark substrate, we further investigated the change point (i.e. the suction level beyond which the curve measured via evaporative method starts to diverge from the curved measured via pressure extraction method). Replicates of MCCs from both the peat and bark substrate analyzed via evaporative and pressure extraction methods were fit with a constrained van Genuchten model (van Genuchten, 1980) using SWRC Fit program (Seki, 2007), to observe variation in model parameters between the two methods. Results and Discussion Comparison of Evaporative Method Replicates. There was no significant difference between any two replicates (peat substrate: P > , bark substrate: P > ) regardless of substrate as 31
63 per the Kolmogorov Smirnov test. In addition, the three replications of the peat substrate measured (Fig. 1) were not significantly different from each other according to the Kruskal- Wallis rank sum test [χ2 (2) = , P = ]. Furthermore, comparing area under curves for the individual replications showed no two replicates were more than 3.5% different from another (3.48%, 1.94%, and 1.46%). Utilizing DTW to observe the difference amongst the three peat substrate replicates (Fig. 2 A-C), it was concluded that only negligible differences exist. The individual replicates of the bark substrate were also analyzed for differences via the Kruskal-Wallis rank sum test, and as with the peat substrate, no differences were observed [χ2 (2) = , P = ]. Area under the curve analysis showed slightly larger differences amongst the individual replicates of the bark substrate (12.55%, 7.07%, and 5.11%) than those of the peat substrate, yet the authors consider the variation low enough to assume similarity amongst curves (Fig. 1). Dynamic time warping comparisons of the bark substrate replicates (Fig. 2 D-F) also illustrate more dissimilarity amongst the individual curves than in the peat substrate. It is important to note that in all comparisons, the third replicate of the bark substrate was responsible for the majority of the differences between the individual reps, and it can be seen as more visually different. This was likely a response to the increased variation of the size and shape of the bark particles relative to that of the peat substrate. This may lead to interference when installing tensiometers, thus resulting in incomplete connection between tensiometer and water, when employing the device with coarse irregular shaped materials. Comparison of Pressure Plate Extraction Method Replicates. Neither of the substrates exhibited any difference amongst any two replicates when analyzed with the Kolmogorov Smirnov test (peat substrate: P>0.9883, bark substrate: P>0.9883). When the data were pooled across 32
64 replications and analyzed with the Kruskal-Wallis rank sum test, no differences could be detected in both the peat substrate [χ2 (3) = , P = ] and the bark substrate [χ2 (3) = , P = ]. When comparing area under the curves of the individual replicates, no two replicates were more than 6.67% different for the peat substrate and 2.95% different for the bark substrate. Therefore, the pressure plate extraction method is extremely consistent amongst replicates with the same bulk densities and initial MC. Unlike with the evaporative method, the irregularity and coarseness of the particles had negligible influence on the differences among the replicates. Contrasting Evaporative vs. Pressure Extraction Method. The two methods, evaporative and pressure plate extraction, produced similar data from Ψ 0 to Ψ 300 when comparing curves of the peat substrate with the Kolmogorov Smirnov test (P = ; Fig. 1). The most notable difference was ϴ at Ψ 0 (i.e. TP). The observed values for 0 and 3.8 hpa were generally underrepresented for organic soilless substrates measured via the pressure extraction. To correct for the under representation of these two points, values for TP and CC (92.6% and 82.6% respectively; Table 1) from porometer analysis were used in place of measurements from the pressure plates (87.8% and 73.5%, respectively) as described by Milks et al. (1989). The mean value for Ψ 0 in the evaporative method analysis of the three peat substrate replicates was 83.8%, thus the difference between the evaporative method and porometer analysis was greater than the difference between the pressure extraction method and porometer analysis. In order to draw statistical comparisons between the two methods, data from the evaporative method had to be truncated to values from Ψ 0 to Ψ 300, as the pressure extraction method data did not extend beyond pressures of 300 hpa. As with the individual replicates, the 33
65 two methods were similar over the defined suction range in the peat substrate according to the Kruskal-Wallis rank sum test [χ2 (1) = , P = ]. For the peat substrate, the difference in area under the curves for the two methodologies was low (0.004%), even less than differences between replicates for the evaporative method. This is hypothesized to be an outcome of the particle size distribution being comprised of a low proportion of particles above 2 mm diameter, resulting in a more uniform distribution of pore sizes (Table 1). The two MCC measurement methods differed more noticeably in the bark substrate according to the Kolmogorov Smirnov test (P = ). The difference in ϴ at Ψ 0 between the two methods was more distinct in the bark substrate than in the peat substrate. The evaporative method analysis predicted a ϴ of 64.1% at Ψ 0, which is considerably lower than 79.0% and 83.4% ϴ measured by porometer and pressure extraction method for the bark substrate, respectively. The inability of the evaporative method to accurately measure values for saturation and subsequent TP in the coarse bark is likely due to the rapid drainage of water resulting from the large proportion of particles with larger than 2mm diameter and increased macropore volume. The corresponding values attained from the pressure extraction analysis were replaced with CC and TP values from porometer analysis, as they were with the peat substrate, to correct for limited free drainage of water from the plates. The air entry point (inverse of α) is measured to be much higher via evaporative method for both substrates (Table 2), thus again alluding to more initial rapid drainage prior to initiating measurements. Because both methodologies produce dissimilar measurements of ϴ between Ψ 0 and Ψ 3.8, neither of these processes should be relied upon for measurements of static physical properties. According to the Kruskal-Wallis rank sum test (with data truncated from 0 to -300 hpa) the curves generated via the two methodologies in the bark substrate were different [χ2 (1) = 34
66 3.8765, P = ]. Furthermore, there was a 26.5% difference in the area under the two curves representing the bark substrate. Aside from the difference in ϴ at Ψ 0, which will not strongly affect area under the curve analysis, there is an observable difference in the shape of the curves. While the curve from the pressure extraction analysis becomes constant at a given ϴ between Ψ 65 and Ψ 100, the curve from the evaporative method continues to experience a decrease in ϴ as suction increases. The leveling of the MCC between Ψ 65 and Ψ 100 may be attributed to loss in hydraulic connectivity between the coarse bark sample composite and the ceramic plate within the VPPE. Many researchers have observed similar issues with highly porous and coarse materials when pressures such as 1.5 MPa (15,000 hpa) are applied (Fields et al., 2014; Fonteno and Bilderback, 1993; Gee et al., 2002; Stevenson, 1982). Research herein supports the concept that some of the substrate materials, which the authors believe are those with the highest proportions of coarse particles, can also lose the connection of water between the sample and the plate at relatively low pressures. In order to determine where the curves differ, we plotted the percentage difference in ϴ against suction (Fig. 3). There is 9.6% difference between the curves at Ψ 100, and a 23.7% difference of at Ψ 300, in the bark substrate. The peat substrate differed by approx. 15% at Ψ 35 as a result of slight divergence in the two curves. However, the difference in the peat substrates is inflated due to the larger ϴ at which the divergence takes place. Furthermore, when the data were fit with a van Genuchten model without forcing the endpoint through the residual volumetric water content (ϴr; the theoretical point where the change of the moisture characteristic function [ϴ(Ψ)] approaches closest to zero), the evaporative method allows for calculations of ϴr values near zero, while the pressure plate method in both the peat and bark substrate were higher (Table 2). 35
67 The authors hypothesized that as the coarseness of material was increased along with a subsequent increase in pore size, the risk of unsuccessful evaporative analyses because of the potential lack of continuous connectivity between the tensiometer and liquid water was amplified. This likely results from an increased risk of having the ceramic tip of the tensiometer being fixed within a large pore and not connecting with the substrate matrix, or only a lesser fraction of the surface area of the ceramic tip being in contact with the substrate matrix, and therefore liquid water was unable to maintain an undisturbed hydraulic connection. Tensiometers that have a larger portion of their surface area exposed to air and not substrate particles or water generally cavitate more readily and may provide unreliable measurements (Nemali et al., 2007). However, this trend cannot be supported with the data solely from this research, as only two levels of substrate coarseness were analyzed. When poor connectivity between the substrate matrix and the tensiometer tip causes an unsuccessful analysis, the data should be discarded and new measurements initiated. As a result of better connection with particles, the MCC of the peat substrate (Fig. 1) extends to approx. Ψ 700 suction, while the MCC of the bark substrate only extends to approx. Ψ 600 as a result of tensiometer cavitation due to a lower degree of connectivity with the substrate particles. Moisture characteristic curves from evaporative method analysis may extend to Ψ 850 (the vaporization point of water) and theoretically beyond if tensiometers are completely degassed and there is sufficient contact between capillary water and the ceramic tip. Furthermore, analyses tended to extend to lower Ψ with increased proportion of the tensiometer s ceramic tip in contact with capillary or hygroscopic substrate water. The evaporative method shows continued loss in ϴ with subsequent increasingly negative Ψ values beyond the point where the reduction of ϴ in the pressure extraction measurements 36
68 ceases. The accepted idea is that measurements between Ψ 10 and Ψ 100 are the most informative region of the MCC based on research by de Boodt and Verdonck (1972). The pressure extraction method provides useful data. However, as we progress into the future, more efforts will have to be afforded to reducing water use in order for production settings to stay economically and environmentally viable (Fulcher et al., 2016) resulting in a need to redefine and extend the range of water availability when possible. As a result, the authors believe this region of the MCC, primarily beyond Ψ 100, may provide information to further understand substrate water availability and inform irrigation decisions when producing containerized crops with less water or during water restrictions. In finer materials, such as peat moss, the pressure extraction method would likely measure decreases in ϴ as pressures above 300 hpa are applied; however, applying higher pressures would increase the total time required for analysis. For this experiment the authors chose to only apply pressures that are conventionally used to stay within a two week time frame, which is similar to the total analysis of the evaporative method. Thus the authors conclude that the evaporative method provides more information as to the water dynamics of the substrate at lower ϴ values within the same duration of time. The increased data density associated with the MCCs from evaporative method analysis also provides researchers more detailed information in regards to the entire shape of the curve, and at what Ψ the more abrupt slope changes occur. An inherent difference in the two methodologies was that MCCs were measured when the substrates were at equilibrium or at their respective steady state condition in pressure extraction analysis, while the evaporative method involves measuring water potential continually when the water in the sample was under transient conditions. Moreover, when applying pressure to samples during pressure extraction analysis, some voids may be filled with air and trap water within what become inaccessible pores that would normally be drained at a given applied 37
69 pressure. Thus these pores are assumed to be smaller than the actual pore and never drain, underestimating available water. Drzal et al. (1999) described the use of MCCs to determine pore size distributions of soilless substrates; however, Hunt et al. (2013) calls into question this approach when proposing the concept of virtual pores. Hunt describes virtual pores as pores that exist in the form of water trapped inside solid matrices and unable to drain when their respective pressure is equaled, due to exit channels being controlled by smaller diameter pores (i.e. higher pressures must be achieved to expend water from surrounding pores prior to water expulsion from the pore in question). The authors hypothesize that the use of the evaporative method may reduce the prevalence of this phenomenon by eliminating the requirement of equilibrium between each measurement. However, there is a distinct possibility that a considerable proportion of the water lost from the substrate in the evaporative method is a result of vaporization water in the upper substrate layer, as opposed to primarily liquid water movement from the near the lower surface. Thus the water redistribution within the substrate sample may not have functioned as the method would assume. The authors believe that the movement of water within the core should be further explored in future research as it could impact other measurements that can be measured utilizing the evaporative method, namely unsaturated hydraulic conductivity. Both methods provided dissimilar measurements of soilless substrate static physical properties from that which can be quickly attained via porometer analysis. However, it is understood that these properties are only representative of a substrate in a 7.5 cm core and are most representative of a substrate at the time of initial planting, as the physical arrangement of a substrate in a container will be altered during the growing season (Allaire-Leung et al., 1999) primarily through particle shrinkage and settling (Bures et al., 1993; Bruckner, 1997), organic 38
70 matter breakdown (Nash and Laiche, 1981), and root exploration (Altland et al., 2011; Judd et al., 2015). Static properties in sample cores are utilized more often to compare substrates relative air and water capacity at the point of free drainage, which will change based on the height of a container (Bilderback and Fonteno, 1987; Owen and Altland, 2008). Conclusions The evaporative method requires 2 weeks to complete an analysis, which is similar to the time required to conduct the conventional measurements via pressure extraction method, with both yielding usable data. The evaporative method describes the relationship between ϴ and Ψ with a greater density of data (i.e. our evaporative analysis yielded 100 data points vs 10 data points with our pressure extraction analysis) and extends the relationship up to Ψ 850, without additional time or efforts included, reducing the need for extrapolation of the curves. Both methods have limitations, primarily involving hydraulic connectivity, when analyzing highly porous substrates. The pressure extraction method provides useful information until hydraulic connectivity is interrupted, which when coupled with static physical properties from porometer analysis is a powerful tool for substrate scientists. However, the utilization of the evaporative method allows for more data acquisition beyond the Ψ where hydraulic connectivity would be broken between sample and pressure plate for the individual substrate. Using more dynamic approaches to characterizing soilless substrates such as incorporating measurements of ϴ beyond Ψ 100 may provide more in depth information of soilless substrates to help better understand how to engineer substrates with properties that enhance water mobility and subsequent water availability. Based on this, with the evaporative method s 39
71 ability to measure ϴ up to Ψ 850 (and theoretically beyond) while still providing greater data density at between Ψ 10 and Ψ 100, the authors conclude that the evaporative method is a viable alternative to the traditional pressure plate extraction method and may provide additional benefits for soilless substrate research. Literature Cited Allaire-Leung, S.E., J. Caron, and L.E. Parent Changes in physical properties of peat substrates during plant growth. Can. J. Soil Sci. 79: Altland, J.E., J.S. Owen, Jr., and M.Z. Gabriel Influence of pumice and plant roots on substrate physical properties over time. HortTechnology 21: Bilderback, T.E. and W.C. Fonteno Effects of container geometry and media physical properties on air and water volumes in containers. J. Environ. Hort. 5: Bilderback, T.E., S.L. Warren, J.S. Owen, Jr., and J.P. Albano Healthy substrates need physicals too! HortTechnology 15: Bunt, A.C Some physical properties of pot-plant composts and their effects on growth. Plant and Soil 13: Bruckner, U Physical properties of different potting media and substrate mixturesespecially air-and water capacity. Acta Hort. 450: Bures, S, F.A. Pokorny, and O.G. Ware Estimating shrinkage of container media with linear and/or regression models. Commun. Soil Sci. Plant Anal. 24: Caron, J., S. Pepin, and Y. Periard Physics of growing media in a green future. Acta Hort. 1034:
72 Conover, W.J Practical nonparametric statistics, 3rd Edition, New York: John Wiley & Sons. Dane, J. and J. Hopmans Water retention and storage/laboratory, p In J.H. Dane and G.C. Topp (eds.). Methods of Soil Analysis, Part 4, Physical Methods. Soil Sci. Soc. Am., Madison, WI. de Boodt, M. and O. Verdonck The physical properties of substrates in horticulture. Acta Hort. 26: Drzal, M.S., W.C. Fonteno, and K.D. Cassel Pore fraction analysis: a new tool for substrate testing. Acta Hort. 481: Fields, J.S., W.C. Fonteno, and B.E. Jackson Plant available & unavailable water in greenhouse substrates: Assessments and considerations. Acta Hort. 1034: Fulcher, A. and T. Fernandez Sustainable nursery irrigation management series: Part I. Water use in nursery production. Bulletin W287, Univ. of Tennessee. Fulcher, A., A.V. LeBude, J.S. Owen, Jr., S.A. White, and R.C. Beeson The next ten years: strategic vision of water resources for nursery and greenhouse producers. HortTechnology. 26: Fonteno, W.C. and T.E. Bilderback Impact of hydrogel on physical properties of coarsestructured horticultural substrates. J. Amer. Soc. Hort. Sci. 118: Fonteno, W.C. and C.T. Harden North Carolina State University Horticultural Substrates Lab Manual. North Carolina State University. Gee, G.W., A.L. Ward, Z.F. Zhang, G.S. Campbell, and J. Mathison Influence of hydraulic nonequilibrium on pressure plate data. Vadose Zone J. 1:
73 Giorgino, T Computing and Visualizing Dynamic Time Warping Alignments in R: The dtw package. J. Stat. Software, 31:1-24. Hollander, M. and D.A. Wolfe Nonparametric Statistical Methods. New York: John Wiley & Sons. Hunt, A.G., R.P Ewing, and R. Horton What s wrong with soil physics? Soil Sci. Soc. Amer. J. 77: Judd, L.A., B.E. Jackson, and W.C. Fonteno Rhizometer: An apparatus to observe and measure root growth and its physical effect on container substrate physical properties over time. HortScience. 50: Klute, A., Methods of Soil Analysis, Part I, Physical and Mineralogical Methods. 2nd ed. Soil Sci. Soc. Am., Madison, Wis. Milks, R.R., W.C. Fonteno, and R.A. Larson Hydrology of horticultural substrates: I. Mathematical models for moisture characteristics of horticultural container media. J. Amer. Soc. Hort. Sci. 114: Nash, V.E. and A.J. Laiche Changes in the characteristics of potting media with time. Commun. Soil Sci. Plant Anal. 12: Nemali, K.S., F. Montesano, S.K. Dove, and M.W. van Iersel Calibration and performance of moisture sensors in soilless substrates: ECH2O and theta probes. Scientia Hort. 112: Owen, Jr., J.S., and J.E. Altland Container height and Douglas Fir bark texture affect substrate physical properties. HortScience 43: Peters, A., and W. Durner Simplified evaporation method for determining soil hydraulic properties. J. Hydrology 356:
74 Raviv, M. and J.H. Lieth Soilless culture: Theory and practice. Elsevier s Publishing, San Diego, CA. Schelle, H., L. Heise, K. Janicke, and W. Durner Water retention characteristics of soils over the whole moisture range: a comparison of laboratory methods. Euro. J. Soil Sci. 64: Schindler, U., Ein Schnellverfahren zur Messung der Wasserleitfa higkeit im teilgesa ttigten Boden an Stechzylinderproben. Arch. Acker-u. Pflanzenbau u. Bodenkd. Berlin 24, 1 7. (English Translation) Schindler, U., W. Durner, G. von Unold, and L. Muller Evaporation method for measuring unsaturated hydraulic properties of soils: Extending the measurement range. Soil Sci. Soc. Am. J. 74: Schindler, U., L. Mueller., and F. Eulenstein Measurement and evaluation of the hydraulic properties of horticultural substrates. Arch. Agron. and Soil Sci. 62: Schindler, U. and L. Muller Simplifying the evaporation method for quantifying soil hydraulic properties. J. Plant Nut. Soil Sci. 169: Seki, K SWRC fit - a nonlinear fitting program with a water retention curve for soils having unimodal and bimodal pore structure. Hydrol. Earth Syst. Sci. Discuss. 4: Stevenson, D.S Unreliabillities of pressure plate 1500 kilopascal data in predicting soil water contents at which plants become wilted in soil-peat mixes. Can. J. Soil Sci. 62:
75 U.S. Department of Agriculture Census of agriculture, Census of horticultural specialties. 15 Dec < Online_Resources/Census_of_Horticulture_Specialties/HORTIC.pdf>. van Genuchten, M.T A closed-form equation for predicting the hydraulic conductivity of unsaturated soils. Soil Sci. Soc. Amer. J. 44: Wendroth, O., W. Ehlers, J.W. Hopmans, H. Klage, J. Halbertsma, and J.H.M. Wo sten Reevaluation of the evaporation method for determining hydraulic functions in unsaturated soils. Soil Sci. Soc. Am. J. 57: Wind, G.P., Capillary conductivity data estimated by a simple method. In: Rijtema, P.E., Wassink, H. (eds.). Water in the Unsaturated Zone, vol. 1. Proceedings of the Wageningen Symposium, June Int. Assoc. Sci. Hydrol. Publ. (IASH), Gentbrugge, The Netherlands and UNESCO, Paris. 44
76 Figure captions Figure 1. Consistency of three replicate moisture characteristic curves for A) Sphagnum peat : perlite and B) aged pine bark with 10% sand (by volume) substrate measured with the evaporative method (blue circles), and the pressure extraction method (red circles). Each curve represents an individual replicate. Only three replicates of the pressure extraction method are included in the figure. Figure 2. Pair-wise comparison of replicate moisture characteristic curves measured via evaporative method for Sphagnum peat moss : perlite (A-C) and aged pine bark with 10% sand (by volume; D-F) using dynamic time warping analysis for each comparison. A) peat substrate replicate 2 vs 1, B) peat substrate replicate 3 vs 1, C) peat substrate replicate 3 vs 2, D) bark substrate replicate 2 vs 1, E) bark substrate replicate 3 vs 1, and F) bark substrate replicate 3 vs 2. This analysis involves providing an optimal alignment between two nonlinear series by querying one replicate against a reference replicate. The similarities between the two replicates can be estimated based on the distance between each line, with the greater the distance resulting in increased dissimilarities between each curve replicate. Figure 3. Depiction of the percentage difference between the moisture characteristic curve from the volumetric pressure plate extractor and the moisture characteristic curve from the evaporative method across the suction range from 0 to 300 hpa. Aged pine bark with 10% sand (by volume; solid line) and peat with perlite (dashed line). Shaded region represents the corrected values in the volumetric pressure plate extraction method (i.e. total porosity value and container capacity value). 45
77 Table 1. Static physical properties and particle size distribution of commercially available Sphagnum peat: perlite substrate and an conventional nursery substrate composed of aged pine bark with 10 % sand (by volume). z Physical parameters Sphagnum peat substrate Aged pine bark substrate Static physical properties Container capacity y (percent volume) Air space w (percent volume) Total porosity v (percent volume) Bulk density u (g cm 3 ) 82.6 ± 0.1 x 54.8 ± ± ± ± ± ± ± 0.01 Particle size distribution t X-Large (> 6.3 mm) 0.48 ± ± 2.61 Large (2-6.3 mm) ± ± 2.73 Medium ( mm) ± ± 1.75 Fines (< 0.71 mm) ± ± 3.51 z Substrate analysis conducted utilizing three replicates for each analysis at Virginia Tech Hampton Roads Agricultural Research and Extension Center, Virginia Beach, VA y Container capacity is percentage of the sample volume occupied by water after allowing sample to drain for 1h. x Standard error = standard deviation /square root of number of replicates w Air space is the percent of the sample volume occupied by air after allowing to drain for 1h. v Total porosity is the percent of the sample volume not occupied by solid particles (air space + container capacity). u Bulk density is the dry weight of the sample (solid particles) total sample volume. t Particle size distribution values are mean percent dry mass of a three oven dried replicates. 46
78 Table 2. Mean van Genuchten parameter values attained from data from modeled moisture characteristic curves from commercially available greenhouse Sphagnum peat: perlite substrate and conventional nursery substrate composed of aged pine bark with 10% sand (by volume) via pressure extraction method z and evaporative method y, using SWRC Fit (Seki, 2007) to attain models. Method of analysis Constrained van Genuchten model parameters (m=1-1/n) Data fit to model ϴs x ϴr w α v n u R 2t Sphagnum peat moss with 25% perlite (by volume) Pressure extraction 96.3 ± 0.21 s 24.5 ± ± ± Evaporative 87.4 ± x10-6 ± 4.98x ± ± Aged pine bark with 10% sand (by volume) Pressure extraction 94.0 ± ± ± ± Evaporative 65.0 ± ± ± ± z Applying incremental pressures to a sample on a porous ceramic plate, collecting water expelled at each pressure. y Allowing a hydrated sample to slowly dry due to evaporation while continually measuring volumetric water content and water potential. x The volumetric water content at saturation as modeled by the van Genuchten model and representative of total porosity. w Residual water, the theoretical volumetric water content where the change of the moisture characteristic function [ϴ(Ψ)] approaches closest to zero. v A parameter in the van Genuchten model that equals the inverse of the air entry point. u A curve fitting parameter that is influenced by the pore size distribution of the sample. t A measure of how well the curves fit to the data, as provided by the SWRC Fit model. s Represents standard error (the quotient of the standard deviation by the square root of the number of observations). 47
79 Figure 1. A 48
80 49 B
81 Figure 2. 50
82 Figure 3. 51
83 CHAPTER III The Influence of Engineered Soilless Substrate Hydrology on Plant Water Status for an Ornamental Containerized Crop Grown Under Optimal Water Conditions Formatted to fit style guide for publication in Plant and Soil 52
84 Abstract. As water use becomes increasingly scrutinized, more water efficient soilless substrates should be engineered to work in concert with new irrigation technologies and water management strategies. We investigated soilless substrate hydrology by manipulating substrate hydraulic properties in order to determine their influence on crop growth and plant water status. Aged pine bark was screened or blended with fibrous materials to engineer seven experimental substrates, all with differing hydrophysical properties. Hibiscus rosa-sinensis Fort Myers plugs were planted in each of the seven substrates and maintained at optimal substrate water potentials (between -50 and -100 hpa). After a salable crop was produced, plants were allowed to dry until completely wilted while simultaneously measuring water content plants ceased withdrawing water from the substrate. It was determined that pore uniformity and connectivity could be increased by both fibrous additions and particle fractionation, which resulted in increased substrate hydraulic conductivity and shifts in substrate air-water balance. Crop morphology and total water used could be both positively and negatively influenced by substrate hydrology. Increased substrate hydraulic conductivity positively impacted crop water use resulting in subsequent increases in crop growth. Moreover, lower substrate hydraulic conductivities during production resulted in increased crop water stress as measured by plant growth measures. Measurements of plant water availability showed that the substrate water potential at which the crop ceases to withdraw water varied among substrates. The plants withdrew water from substrate until substrate water potential reached extremely low water potentials prior to ceasing water uptake in the engineered substrates, whereas the plants in the unaltered pine bark ceased transpiration at higher substrate water potentials. The results suggest that soilless substrates with enhanced hydraulic properties can be used to create more sustainable production systems that can help reduce the water footprint of containerized specialty crops. 53
85 Introduction Container production, an expanding sector of specialty crop production, accounted for nearly 66% of the total nursery crop production within the United States (U.S. Department of Agriculture, 2015). Container production primarily utilizes soilless substrates to produce marketable crops. Soilless substrates were first introduced for container crop production to increase drainage by maintaining a relatively large proportion of air space (AS) as compared to previously utilized mineral soil substrates (Raviv and Lieth, 2008). These highly porous, initially disease free, substrates were essential to growers in previous decades. Thus, soilless substrates were designed to ensure ample AS regardless of irrigation practices or weather. This has led to excess water application for container crops to eliminate any risk of under-watering (Mathers et al., 2005). Moreover, this excess water application leads to inefficient use of water resources and subsequent leaching and/or runoff of applied agrichemicals (Million et al., 2007). Fresh water is a finite resource, a fact recognized by both the public at large and specialty crop producers. Currently, 70% of the freshwater consumed in the world is used for agricultural purposes and nearly 40% of the freshwater withdrawn in the US is used to irrigate crops (Kenney et al., 2009). Containerized specialty crop producers continue to be more conscious of water use, whether it is due to economic decisions, governmental restrictions, or increased environmental stewardship (Fulcher et al., 2016). Water savings could be realized through re-engineering soilless substrates with increased hydraulic conductivity, coupled with reduced irrigation, to increase water efficiency of containerized specialty crop production. Recently Fulcher and Fernandez (2013) showed that container nurseries apply upwards m 3 of water per hectare per day during the periods of high water demand. Varied efforts to 54
86 reduce the water load in ornamental container production include: different irrigation schemes (Warsaw et al., 2009), crop water use modeling (Million et al., 2010), crop spacing and arrangement variation (Beeson and Yeager, 2003), and sensor driven irrigation (Chappell et al., 2013), albeit without a clear alternative to overhead irrigation in container nursery production (Fulcher et al., 2016). Approximately 50% of container nurseries currently utilize overhead irrigation, without capability of utilizing more sustainable irrigation delivery methods (Beeson et al., 2004). Therefore, research should, in part, move toward engineering new soilless substrates to increase substrate water efficiency. Current best management practices (BMPs; Bilderback et al., 2013) for container production of ornamental nursery crops in the Southeastern United States recommend static physical properties with a large proportion of AS (10 to 30 %) and relatively low container capacity (CC; 45 to 65 %). Instead of solely utilizing recommended static measures (AS and CC), dynamic hydraulic properties, including the inherent relationship between volumetric water content (VWC), water potential ( ) and hydraulic conductivity (K), can provided greater insight in determining suitability of soilless substrates (Caron et al., 2014). Moisture characteristic curves (MCC), which represent the relationship between VWC and of a porous media are utilized by researchers to not only determine static physical properties (Milks et al., 1989), but also provide information regarding degree of water availability (de Boodt and Verdonck, 1972) and pore structure (Drzal et al., 1999). Campbell and Campbell (1982) discussed the importance of high hydraulic conductivity (K) to allow roots to access water from greater distances within mineral soil matrices. da Silva et al. (1993) discussed the merits of measuring K in soilless substrates primarily composed of 55
87 Sphagnum peat moss to create more efficient irrigation scheduling to help reduce water stress. Raviv et al. (1999) deemed decreasing K as the primary limiting factor for water uptake by roots in soilless substrates; however, they noted that in situ measurements of substrate K are not easily obtained and relationships between K and VWC or substrate should be better understood to make predictions of water availability in containers. Researchers have observed minimal reductions in substrate VWC can result in great reductions in unsaturated K (Wallach et al., 1992). These changes become more pronounced as VWC decreases further away from saturation in peat based substrates (O Meara et al., 2014). The overarching objective of this research is to determine if basic modifications of soilless substrate hydrophysical properties can increase water retention or enhance root accessibility of substrate water and subsequently increase crop water efficiency while retaining or improving crop growth. This objective was accomplished by 1) determining the influence of substrate modifications on hydraulic properties, 2) assessing the effects of hydraulic properties on containerized crop water dynamics for crops grown in substrate water potentials between -50 and -100 hpa, and 3) measuring how water availability for a containerized crop is affected by varying hydraulic properties. The authors hypothesized that increased soilless substrate hydraulic conductivity will allow for increased growth and vigor by allowing crops access to higher proportions of water thereby reducing crop water stress when substrates are maintained at lower. Materials and Methods Substrate preparation. On 17 Mar m 3 of stabilized (aged between four and six months) loblolly pine bark (PB; Pinus taeda L.) screened through a 12.6 mm screen was attained 56
88 from a commercial nursery substrate company (Pacific Organics, Henderson, NC, USA). The bark was further separated into four different size fractions by sieving through a shaker rotating at approximately eight oscillations per 1 s (Custom Fabricated Shaker, Steve s Welding, Williamston, SC) with 6.3, 4.0, and 2.3 mm screens (W.S. Tyler, Mentor, OH) at the Substrates Processing and Research Center located at North Carolina State University, Raleigh NC. The process entailed incrementally placing 0.05 m 3 of PB ( % moisture content measured via random sampling throughout the screening process) into the shaker tray, smoothing the PB to an even depth of 6 cm, shaking through a 6.3 mm screen for 90 s, and then placing particles that did not pass ( 6.3 mm) and which passed through (<6.3 mm) the screen into separate 0.19 m 3 drums. Once 0.38 m 3 of each substrate was collected, the process was repeated on the bark that passed through the initial screen using 4.0 mm and 2.3 screen to collect 0.19 m 3 of each size fraction. This process resulted in four particle size fractions of PB: > 6.3 mm (PF6), mm (PF4), mm (PF2), and 2.3 mm (PF0). Additionally, 0.38 m 3 of unscreened pine bark (UPB) was placed in sealed drums for later use. All substrates were then transported to the Virginia Tech Hampton Roads Agricultural Research and Extension Center in Virginia Beach, VA for analysis and experimentation. Compressed bales of Sphagnum peat moss (Fafard, Agawam, MA) and coconut coir (FibreDust, LLC, Glastonbury, CT) were hydrated, reconstituted, and stored individually in sealed plastic tubs for 24 h to allow for moisture equilibrium. Peat and coir were blended with PF6 to produce two additional substrates: 65% (by vol.) PB : 35% (by vol.) peat (P35) and 60% (by vol.) PB : 40% (by vol.) coir (C40) with the goal of shifting the majority of substrate particles < 6.3 mm from platy in texture (typical of pine bark particles) to a more fibrous texture 57
89 (Sphagnum peatmoss and coconut coir), and thus affecting pore connectivity and subsequent water movement or availability. Static physical properties. Porometer analysis (Fonteno and Harden, 2010) was conducted to determine static physical properties, including AS, CC, total porosity (TP) and bulk density (Db), for each of the seven substrates. Particle size distributions of three replicates for each substrate were then determined by shaking 100 g of oven dried substrate for 5 min with a Ro-Tap shaker (Rx-29; W.S. Tyler, Mentor, OH) equipped with 6.30, 2.00, 0.71, 0.50, 0.25, and 0.11 mm sieve and a pan. Particles remaining on each sieve or in the pan after agitation were weighed and used to determine particle size distribution by weight. The particles sizes were then grouped into three texture classes based on diameter including large (> 2.00 mm), medium (between 2.00 and 0.71 cm), and small (<0.71 cm) particles. Hydraulic properties. Saturated hydraulic conductivity (K s ) measurements were attained on three replicates of each of the seven substrates using a commercial research system (KSAT, Decagon Devices, Pullman, WA). This measurement consisted of packing each substrate into three aluminum cores (250 cm 3 ) using an assembled column (lower 250 cm 3 core attached below the sample core, with two further 250 cm 3 cores fixed above the sampling core) that was filled to the top, lifted, and dropped from 5 cm height five times. This ensured constant Db for each individual substrate throughout all laboratory analyses. The bottom of each packed core was covered with cheesecloth, placed into a plastic tub, saturated stepwise from the bottom, and left for 24 h to equilibrate. After equilibration, sample cores were affixed with a collar and appropriate upper and lower screen (all included with the KSAT device) to prevent particles from escaping and ensuring all water was passed through the substrate instead of passing outside of the core. Samples were then affixed into the KSAT device and were again saturated from the 58
90 base to replace any water lost during preparation. Utilizing the KSAT device, K s was measured for each replicate three sequential times in the constant head measurement mode prior to being removed from the device. Volumetric water content of each substrate was measured at low (<-1000 hpa or -0.1 MPa) via a dewpoint hygrometer (WP4C; Decagon Devices), following procedures described by Fields (2013). Stainless steel sampling dishes (Decagon Devices) were filled approximately half way ( five mm depth) to completely cover the bottom surface of the dish and allowed to air dry to different degrees of dryness (to ensure varying moisture content in each dish prior to measurement). Each dish was then sealed in the drawer of the dewpoint hygrometer and was measured in Precise Mode. After measurement the dishes were removed and immediately weighed, and dried in a forced air drying oven at 105 C for 48 h. This process was repeated until seven measurements between -1.0 and -3.0 MPa were attained. The VWC of the samples were calculated utilizing measured Db to provide the substrate VWC within the range. Moisture characteristic curves were developed for each of the seven substrates via the evaporative method utilizing a Hyprop (UMS, Munich, Germany) following the procedures described by Fields et al. (2016). Each substrate was packed to the same Db as for porometer analysis to ensure uniformity and mimic substrates in planted containers. Along with the relationship between VWC and, the evaporative method provides measurements of the relationship between K and both VWC and for a given porous media. Data for each substrate were then compiled with HypropFit software (UMS, Munich, Germany), along with values > MPa (from dewpoint hygrometry), TP (from porometer), and K s (from KSAT). With these 59
91 added points included, data were then modeled (SAS v9.3, SAS Institute, Cary, NC), to fit the Brooks and Corey (1964) moisture tension model: Brooks and Corey (1964) model: [1] Where, or effective saturation, and h is substrate tension (-hpa). Fitting parameters within the model are measures of pore size distribution uniformity (λ; unit less parameter) and air entry point (H b ), that provide more information towards substrate hydraulic properties than other models. Other parameters include ϴs which is the VWC at saturation, and ϴr, which is the VWC when increased no longer results in significant reductions in VWC (Stephens and Rehfeldt, 1985). Utilizing the modeled MCC data, easily available water (EAW), the water held between - 10 and -50 hpa, and water buffering capacity (WBC), the water held between -50 and -100 hpa, were calculated for each of the seven substrates (de Boodt and Verdonck, 1972). The Brooks and Corey parameter λ was used to make inferences into the relative pore size uniformity of each substrate, with larger values representing more uniform pore size distributions (Brooks and Corey, 1964). The MCC data based on effective saturation measured via the evaporative method were utilized along with the K(Ψ) measurements to fit a K(Ψ) model in HypropFit. This model predicted K across the measured tension range and weighted the actual K(Ψ) measurements to produce the strongest fit. The fit was computed (in HypropFit) with a nonlinear regression 60
92 algorithm that minimized the sum of weighted squared residuals between model prediction (based on MCC measures) and measured K(Ψ) data. Greenhouse trial. On 5 May 2015, previously sealed drums were rolled horizontally on the ground to ensure homogenization and uniform moisture distribution for each of the seven substrates, and 0.14 m 3 of each substrate was amended with 5.60 kg m -3 of 15.0N-3.9P-9.9K controlled-release fertilizer [CRF; ] 3-mo Osmocote Plus (micronutrients), The Scotts Co. LLC, Marysville, OH] and 4.15 kg m -3 lime (1:1 crushed: pulverized; by wt.) by shovel turning the 0.14 m 3 piles three times, to ensure homogenization. Each substrate was used to fill 27 #1 (3.8 L) containers (C400; Nursery Supplies, Chambersburg, PA) loosely to the lip and packed by lifting and dropping from a 5 cm height three times to provide a density comparable to the density of the cores packed in the laboratory portions of this research. Each filled container was planted with Hibiscus rosa-sinensis L. Fort Myers plugs (Hatchett Creek Farms, Gainesville, FL). Each plant was placed in the center of the container and the container was dropped once from a height of 5 cm to complete planting. Five additional containers of each substrate were filled as previously described and left fallow. These fallow containers were immediately oven dried to determine substrate dry weight and Db. The 189 planted containers (7 substrates x 27 containers) were moved into a shaded mist house, overhead irrigated by hand, and left in the mist house for 48 h. On 8 May 2015, all planted containers were randomly placed on one of three benches in a climate controlled glass-greenhouse. Each bench was separated into seven irrigation zones, with each zone consisting of a solenoid valve controlling 10 individual pressure compensating spray stakes (Netafim USA, Fresno, CA; Plum color; 12.1 L h -1 ) used to water nine planted containers and a water collection vessel to measure irrigation volume. In addition, a lysimeter was randomly 61
93 placed in each irrigation zone. Lysimeters were built by attaching cm 2 square Plexiglas plates on either side of a load cell (LSP-10; Transducer Techniques, Temecula, CA). Plants were watered overhead as needed to establish roots within the container. During establishment, 150 ml liquid fertilizer solution made of 12 g L -1 of soluble 20.0N-13.2P-16.6K ( , JR Peters, Inc. Allentown, PA) was applied to each container on 18 May, 28 May, and 15 June On 29 June 2015, plants were fertilized with 150 ml liquid fertilizer solution (prepared the same as previous solutions), and automated irrigation was initiated. This is considered the production portion of the experiment, at which time plant growth index [GI; (height + widest width + perpendicular width)/3] was measured on each plant approximately every 14 d thereafter until harvest. Lysimeters connected to a data logger (CR3000 Micro-logger, Campbell Scientific, Logan, UT) via a multiplexer (AM16/32B Multiplexer, Campbell Scientific, Logan, UT) were used to record the weight of one container per replication every 5 min and to actuate solenoids, turning on 10 spray stakes (one replication), via two relays (SDM-CD16AC, Campbell Scientific). Water was applied to a replication (nine containers and 1 collection vessel) when the minimum weight of the container was equal to a weight corresponding to a water content with of -100 hpa and irrigated until substrate reached a calculated weight corresponding to a of -50 hpa. Water potential was determined using the calculated substrate dry weight from the fallow containers to calculate VWC, and the MCCs were utilized to convert VWC to. Since discussed in this study were not directly measured, but instead calculated through total water in substrate, they represent corresponding to the average VWC of the entire container. 62
94 The critical range utilized corresponds with substrate WBC first described by de Boodt and Verdonck (1972), in which plant water is considered to be readily available (Pustjarvi and Robertson, 1975). Each zone was prevented from initiating irrigation more than once every three hours to prevent excess watering. Additionally, air temperature (T) and relative humidity (RH) at canopy height were measured and recorded every five min with a sensor (HMP60, Vaisala, Vantaa, Finland) via the data logger, and used to calculate vapor pressure deficit (VPD). The water lost from the containers via evapotranspiration (ET) was calculated from lysimeter data every five min throughout the duration of the study and compiled and averaged hourly, as was VPD. Water volume applied via the spray stake was measured periodically for each irrigation zone, which was used to confirm water application values measured via lysimeters. Integrated pest management procedures were used in the greenhouse during the experiment which included applications of insecticide (Safari, Valent BioSciences Corp., Libertyville, IL; 1 July 2015) and miticide (Judo OHP, Inc., Mainland, PA; 31 July 2015) to prevent pest damage. Instantaneous water relations measurements. On 19 July 2015 a portable photosynthesis system (LI-6400XT; LI-COR Biosciences, Lincoln, NE) with a light-emitting diode(led)-lit gas exchange chamber was used to measure leaf gas flux including net photosynthesis (Pn), stomatal conductance (g s ) and transpiration (E). Data were measured between 1045 HR and 1245 HR with the atmospheric and environmental parameters as follows: T = 33.4 ± 1.6 C SD; RH = 40 ± 5% SD; photosynthetic active radiation (PAR) = 1300 ± 0.8 µmol m -2 s -1 SD. One randomly selected plant in each replication was utilized for instantaneous gas exchange measurements. The leaf chamber was clamped onto an apical mature leaf ensuring that the leaf was not contorted nor was the midrib in the clamped chamber, with the entire area of the chamber (6 cm 2 ) covered with leaf 63
95 tissue. This process was done quickly to minimize any possible shading that may affect the system or the plant. The chamber was set to mimic the PAR of the sunlight, temperature, and RH of the greenhouse environment at the initiation of measurements. The CO 2 concentration within the LED-lit chamber was held at µmol mol -1 ± 0.1 SE. Containers were weighed prior to measuring gas exchange to ensure each was within the -50 to -100 hpa substrate range. Instantaneous water use efficiency (WUE) of the treatments was calculated by dividing Pn by transpiration. Harvest. On 6 Aug the final data collection and plant harvest was initiated. The irrigation control plant (on the lysimeter) in each zone had its leaves removed, leaf area (LA) measured (LI-3100C Area Meter; LI-COR Biosciences, Lincoln, NE), and total leaf number counted. Leaf length, which is influenced by cell elongation (Pallardy, 2008), of the three most apical mature leaves, was measured from base to tip (excluding petiole) as an indicator of water stress throughout the experiment. Growth index was measured one last time on every plant in trial, and the difference between the initiation GI and harvest GI was calculated (ΔGI). Shoots were severed at the surface of the substrate and roots were washed free of substrate. All plant tissue was dried in a convection oven at 58 C for 7 d prior to being weighed. An additional two plants per replication were harvested as described above. The five most apical leaves on the two plants were separated and dried (dry weights were later added back to total shoot dry weight), so as to have 10 leaves from each zone. The leaves were sent to the University of Georgia Stable Isotope Ecology Lab (Athens, GA, USA) for 13 C isotope discrimination (δ13c) analyses. Carbon-13 discrimination was used as an estimator of integrated WUE as it is an indicator of g s over the duration of crop growth (Farquhar et al., 1989). Root to shoot ratio of dry mass (R:S) was then measured and utilized as an estimator of carbon allocation. Plant compactness was calculated as 64
96 the ratio of shoot dry mass to shoot height, so that larger values represent more compact plants (van Iersel and Nemali, 2004). Integrated WUE was also calculated by dividing total plant dry biomass by ET. The hourly ET measures were plotted against hourly calculated VPD, with nighttime values removed (when little ET was occurring). This was done to provide insight into the ability of the substrate to move water when environmental (both rooting and atmospheric environment) demand increased. Plant water availability. On 11 Aug. 2015, the three remaining plants in each replication had the spray stakes removed. One randomly selected remaining plant in each replicate was placed on the respective lysimeter. Container system weight, T, and RH were recorded every five min to calculate water status of the plant-substrate system and VPD, respectively. Plants were irrigated overhead by hand until each had reached effective CC (the maximum water holding capacity possible through overhead irrigation). Water was then withheld from each plant for 2 weeks, at which time every plant was completely wilted and water loss was negligible for >2 d. As plants dried down, the lysimeter measured water loss. The reduction in VWC over each 24 h period (from 0000 hr to 0000 hr) were plotted against the starting VWC for that period. Data were regressed to calculated the critical point where the daily water use shifted to stable reductions in VWC. This allows inferences into the VWC where water loss shifts from ET (large reductions in VWC), to primarily evaporation (constantly low reductions in VWC), in an effort to estimate at what VWC each plant stopped transpiring. The water remaining in the substrate when plants ceased transpiring was considered to be the unavailable (O Meara et al. 2014). This critical VWC was then converted to utilizing MCC data for each substrate. Data analysis. Data presented in tables with associated statistics were analyzed in JMP Pro (12.0.1, SAS Institute, Inc.; Cary, NC) utilizing Tukey s Honestly Significant Difference (α = 65
97 0.05) to separate means across all seven substrates. Substrates PF6, PF4, PF2 and PF0 were further analyzed to detect any potential linear or quadratic relationships that may exist between measurements and substrate mean particle diameter (PF6 = 4.66 mm, PF4 = 2.58 mm, PF2 = 2.07 mm and PF0 = 0.69 mm; based on dry mass) to understand the effect of particle size fractionation. A t-test was utilized to specifically compare peat and coir, to determine how the two fibers influence substrates differently. The data in tables without accompanying statistics are computed from fitted Brooks and Corey (1964) models and therefore do not have any associated statistics. Correlation data, when used, were calculated using Pearson product-moment correlation coefficient in JMP Pro (12.0.1). Regression for determining critical transition between water loss primarily from transpiration (ET) to water loss primarily from evaporation in the water availability study was calculate. To determine the breakpoint in water availability, reductions in VWC over a 24 h period were plotted against substrate VWC, and the point where the data shifted to asymptotic was selected by the intersection of regression lines. To further determine at what Ψ the shift from ET to evaporation occurred, VWC measures at midnight (oooo hr), were plotted against dry down duration (Appendix B). Data were fit to a model in SAS (9.3 SAS Institute, Cary, NC) to determine the VWC where water loss shifted from nonlinear (ET) to linear (evaporation). This was to make inferences into the water loss based on when the substrate-plant system was under steady state conditions (no observable flux) utilizing a segmented line analysis model. A piecewise regression model was then fit to the data, with the decrease in VWC (initial water loss resulting from ET) fitted to a natural logarithmic function, and the loss in VWC after the transition to primarily evaporation only fitted to a linear function. The transition between the two functions, considered to be the breakpoint was quantified, and 66
98 95% confidence intervals for each were computed. The VWC breakpoints for the seven substrates were then transformed to associated utilizing MCC for each substrate. Results & Discussion Hydrophysical properties. Mean particle diameter exhibited a strong relationship with all three texture classes (R 2 = 0.996, 0.959, and for large, medium, and small respectively; Table 1). This is an inherent result of the substrate processing, as the act of screening bark separates particles by size. There was no detectable difference in texture or Db between the fiber-amended substrates (P35 and C40; Table 1). The quantity of small and medium texture particles in the P35 and C40 substrates was much lower than in the UPB (by dry mass); however, the fibrous additions resulted in greater (P35) or similar (C40) CC values (Table 2). The substrate composite is influenced by the differing particle geometries of the individual components, corresponding to the ability of the fibrous materials to effect composite pore sizes differently than the plate-like particles when used to create a composite with coarse bark particles. Thus, the addition of the fibrous materials resulted in the substrates being able to hold more water than UPB. due to resulting pore structure and surface area. The geometry and structure of wood substrate particles, and subsequent relative surface area has been shown to influence substrate water holding capacity (Fields et al., 2014b). Additionally, to decrease total pore size and CC, the peat and coir amendments were almost completely composed of particles in the small texture class when the components were measured individually (data not presented). The fibrous additions resulted in static physical properties (CC, AS, and TP) most closely resembling that of the UPB, which was our goal (Table 2). The UPB had AS values in-between 67
99 PF0 and PF2, yet similar to that of the fiber amended substrates (P35 and C40), and CC values representing the median of all seven substrates. The PF0 had a CC of 58.5 which was greater than the other substrates and nearly two times that of the other three particle fractions (PF2, PF4 and PF6), similar to the observations made by Richards et al. (1986), where the removal of pine bark particles >2 mm increased water holding capacity. There was a quadratic relationship between mean particle diameter and CC, with increasing particle diameter resulting in decreased CC. Conversely, an inverse relationship with respect to AS was detected. The PF6 and PF4 have the largest AS, while the PF2 has lower AS than PF6. Across the static physical properties for the particle fractionation we see a strong quadratic relationship based on mean particle diameter (R 2 = 0.984, 0.996, 0.996, for CC, AS, and TP respectively; Table 2). Among the fibrous addition materials, P35 had higher AS than C40 (P = ) while C40 has higher CC than P35 (P = ). The PF0 has approximately less than one-third the AS compared to the PF6, PF4 and PF2. These relationships of the air and water holding characteristics of the particle size fractionated substrates coincides with similar relationships between mineral soils based upon their relative particle size due to the inherent differences in surface area, as well as the pore size distribution (Jury and Horton, 2004). PF0 was the only substrate with the recommended properties as reported in the Southern Nursery Association s BMP manual (Bilderback et al., 2013), with the PF6, PF4 and PF2 substrates having greater AS and lower CC than recommended, and the UPB, P35, and C40 having slightly greater AS than recommended. There was no detectable difference in K s between the two substrates with fibrous particles added, nor was any relationship observed between K s and mean particle diameter (Table 2). The K s values for the PF6, PF4, and PF2 were greater than that of the PF0, UPB or fiber amended substrates. This is similar to results shown by Heiskanen (1999) in peat-based substrates, who 68
100 noted that the presence of larger particles increase K s. This is due to the increased percentage of the porosity occupied by macropores, reducing water flow retardation. The PF2, PF4, and PF6, engineered with intent to reduce the phenomena of hysteresis by creating more uniform pore sizes, have inherently reduced tortuosity when hydrated, and allow an increased rate of water flow at optimal container growing Ψ (substrate water potentials between -50 and -100 hpa). With the inclusion of greater proportions of fine sized particles in a substrate, smaller diameter pores are formed, which restrict water movement to a greater degree than larger diameter pores, resulting in increased substrate tortuosity when hydrated, thus increased physical retardation of water as it passes through the substrate. However, as VWC is decreased, the water must move along particle surfaces, and tortuosity is increased (Fonteno, 1993). Therefore, we hypothesize that tortuosity would increase more in the coarse materials than the fine materials as substrates dry. Dewpoint hygrometry resulted in increased (less negative) Ψ at low VWC for substrates with fibrous additions then when measured with tensiometers and the evaporative method (C40 and P35; Fig. 1F and G). This is hypothesized to be a result of the small sample size utilized in analysis. Utilizing a coarse bark in dewpoint hygrometry and small substrate volumes ( 5 cm3) results in samples that may not structurally mimic the composite substrate in the 250 cm3 cores or substrate in the container where the volume would be dominated by large bark particles, further influencing the VWC at each tension. Another possible explanation for the discrepancy between dewpoint hygrometry and low tension evaporative measures is degrading hydraulic connectivity between substrate particles and the tensiometers as the sample dries. Evaporation from the sample is a transient process, which does not allow the sample to reach equilibrium at each measure, and thus poor contact may establish during measurements. 69
101 Moisture characteristic curves for each substrate were fit to a model (Brooks and Corey, 1964; Fig. 1) which provides pore size uniformity index, λ. The PF6 substrate exhibited the lowest λ (0.19; Table 3) representing the least uniform pore size distribution. The UPB, P35, PF2, PF4, and C40 had larger λ values, with PF0 exhibiting the maximum observed pore size uniformity (0.69). The intent of the particle fractionation was to create a range of pore uniformity, in order to understand subsequent effects on substrate water dynamics. Pore uniformity was increased in all engineered substrates except the PF6 substrate, which was comprised of primarily coarse particles, when compared to UPB. The Brooks and Corey model predicted the lowest air entry pressures for the PF4 and PF6 substrates. This air entry pressure is generally indicative of the largest diameter non-hysteretically restricted pore when assuming the capillary bundle theory. However, this theory may not be indicative of the true nature of the porous substrate, as many measured pores can be virtual, due to hysteretic effects influencing at what tension water is released from pores (Hunt et al., 2013). The model fit extremely small bubbling pressures for PF4 and PF6 (0.085 hpa and hpa, respectively; Table 3), indicating the inability of these substrates to retain water in pores even against miniscule tensions. Furthermore, this would suggest that the perched water table in these two substrates (PF4 and PF6) would likely be infinitesimal (unmeasurable). This, along with impractically large measures of K s and static physical properties, is why these substrates are considered to be water inefficient under conventional cultural practices (i.e. regular irrigation) because the high proportion of macropore volume increased drainage resulting in lower water holding capacity (Argo, 1998). The difference in VWC between CC and Ψ 100 in the P35 and C40 implies that coir improves the rate of drainage and aeration at conventional production hydration levels. This is also observable with the increased AS in C40 as compared to that of P35. However, ϴr values 70
102 from modeled MCCs show that the VWC of C40 (0.11 cm 3 cm -3 ) was greater at low Ψ when compared to P35 which is approaching 0 (3.3 x 10⁻⁷ cm 3 cm -3 ; Table 3). This indicates that while coir will increase aeration within conventional production ranges to a greater degree than peat, when extreme dry situations occur, coir will retain more water which may help prevent crop death if water is purposely or accidently withheld. A similar observation was made by Fields et al. (2014b), where a 100% coir substrate exhibited greater VWC compared to a 100% peat substrate at -300 hpa and -1.5 MPa. Furthermore, coir has been shown to remain hydrophilic, unlike peat which becomes hydrophobic, when allowed to dry (Fields et al., 2014a). This phenomenon contributes to the increased water availability in coir substrates at low Ψ. The K(Ψ) data measured via the evaporative method were plotted between 0 and -300 hpa (Fig 2A), fit to a model that utilized MCC and K(Ψ) measures, and plotted for Ψ between - 50 and -100 hpa, corresponding to the WBC range (Fig. 2B). The RMSE for the models to all the data points was low (RMSE = 0.13, 0.19, 0.16, 0.04, 0.12, 0.12, and 0.18 log 10 cm/d for the PF0, PF2, PF4, PF6, UPB, P35, and C40, respectively), indicating good fits. The P35 had K two orders of magnitude greater than the other experimental substrates across WBC range. This indicates that the addition of peat to a coarse substrate can greatly increase K at Ψ between -50 and -100 hpa. The K of the C40 was less than the P35, while being similar to P35 in most other hydrophysical properties. With both P35 and C40 similar in K s, CC, and TP, the reduced K between Ψ -50 and Ψ -100 suggests that coir, as a substrate component, conducts water to a lesser degree than peat. The curves for the four particle fractionation substrates follow a similar trend (Fig. 2); however, the K of the PF4 substrate was lower across the range than the PF6. It is hypothesized that the sieving process caused the PF4 fraction to have more uniform medium texture particles and less small texture particles from the double screening process than the 71
103 previously screened PF6 bark. While this phenomenon also occurs in the PF2 fraction, the particles are smaller than in the PF6 and PF4, thus increase K, while also increasing surface area, which allowed for an increase in the proportion of extremely fine sized particles (<0.11 mm dia.) in the hydrated screening process (data not shown). To further compare the K(Ψ) curves, the values of K at -75 hpa [K(Ψ 75 )] for each substrate were calculated [UPB = -2.72, PF0 = -2.60, PF2 = -2.95, PF4 = -3.20, PF6 = -3.06, P35= -0.74, C40 = -2.80; all K values are Log 10 K (cm/d)] from the fit model. The UPB and C40 substrate were similar at K (Ψ 75 ) to the PF0 and PF2 substrates. However, the mean slope of UPB, was the most negative across the -50 to -100 hpa range ( cm d -1 hpa -1 ; Fig. 2). The K for the UPB decreased to below that of the C40 at -88 hpa over the -50 to -100 hpa range (Fig 2b). The values of K between -50 and -100 hpa are 10-3 lower than that of measured K s values. This agrees with previous findings for peat-based soilless substrates that showed substrate K decreases by three orders of magnitude over the 0 to -25 hpa substrate water potential range (da Silva et al., 1993; Wallach et al., 1992), and that K for peat and bark sharply decline at -30 and -50 hpa, respectively (Naasz et al., 2005). This indicates rapid decline in the ability of a substrate to conduct water, and therefore reduced water availability to the plant. Additionally, Londra (2010) found perlite amended with coir to have higher unsaturated K than perlite amended with peat at 40% VWC, which would be at a higher (less negative) Ψ than that used in our data. The K s values for the C40 were larger than that of the P35. Therefore, we expect coir-amended substrate to have higher K than peat-amended substrate as Ψ approaches 0 hpa, and a more dramatic decrease in K in coir-amended substrates between saturation and -50 hpa. However, substrate K becomes less limiting for water movement as Ψ approaches 0 hpa. Researchers will often measure K s as opposed to unsaturated K, due to the relative ease of 72
104 measurements (Caron and Elrick, 2005); however, measurements of K s, did not correlate strongly with K(Ψ 75 ) values (r = 0.32, P = ), and thus do not provide insight into production ranges. Consequently, it is believed that measures of unsaturated K, especially within traditional production ranges, should be relied upon to provide information towards the watersubstrate interactions. Plant responses and water status. Leaf samples were sent to an analytical laboratory to test for any differences in foliar nutrition during the study, with no differences in N (P = ) and K (P = ) and a slight treatment effect on foliar P (P = ). The plants grown in PF0 and P35 had the greatest ΔGI (Table 4). While plants grown in PF0 substrate had a greater ΔGI, crop ΔGI in P35 was similar to that of plants in C40 and UPB. While each of these substrates resulted in salable crops (author observations), the greatest ΔGI came from plants grown in the only substrate to conform to all the BMPs for static physical properties (citation Southern Nursery Association s). No difference in R:S was observed among plants grown in the seven substrates (Table 4), suggesting that while some substrates were able to produce larger crops, water availability was sufficient to ensure none of the substrates caused any shifts in carbon allocation between roots and shoots (i.e. variation in R:S). Moreover, leaf length revealed no differences among treatments (P = 0.94), providing further evidence that none of the substrates imposed serious water stress on the plants. The lack of stress indicators is likely a result of all crops being grown at equivalent Ψ ranges. Conversely, there were differences among the plants grown in different substrates in regards to canopy compactness and LA (Table 4). Leaf area of crops produced in the P35 and C40 substrates were greater than when produced in PF6 substrate (Table 4). No differences were found for compactness with any of the engineered substrates when compared to UPB utilizing Tukey s HSD, as UPB provided the median compactness 73
105 measurement. Within the engineered substrates; more compact plants occurred in P35, C40, and PF0 substrates than when grown in PF4 and PF6 substrates. Increased compactness in H. acetosella has been linked to higher substrate moisture (Bayer et al., 2013). This indicates the increased ability for the plants grown in substrates with higher K in this study to be able to withdraw water more readily. Additionally, there was a strong quadratic relationship amongst mean particle size and both LA (R 2 =0.986) and compactness (R 2 = 0.999; Table 4). However, compactness had a quadratic relationship with K(Ψ 75 ), suggesting that the hydraulic conductivity influenced crop morphology (R 2 = 0.71). Higher values of δ13c indicate less discrimination between 12C and 13C, which indicates more stomatal closure and a lower WUE (Farquhar et al., 1989). However, Tukey s HSD was unable to detect any difference in δ13c amongst the plants grown in the seven substrates when separating means (Table 4). The strict nature of Tukey s HSD dictates that in order to reduce the possibility of detecting false positives; occasionally slight treatment effects are undetected. An analysis of variance prior to means separation did suggest treatment effects across all seven substrates (P = ). Furthermore, δ13c correlated with ΔGI (r = -0.64; P = ), LA (r = -0.65; P = ), compactness (r = -0.59; P = ), and R:S (r = 0.49; P = ), suggesting that the substrate, which was shown to influence these morphological and physiological parameters, also influenced δ13c of the leaf tissue. Previously, Egilla et al. (2005) observed a decrease in δ13c in drought-stressed container-grown H. rosa-sinensis L., and concluded that WUE increased with drought stress. Thus from δ13c measures, we conclude that the substrate treatments influenced plant WUE, despite equivalent production substrate Ψ. However, δ13c was not correlated with K(Ψ 75 ) or calculated intrinsic WUE (r = -0.19, P = , and 0.08, P = , respectively). 74
106 Tukey s HSD was unable to detect any treatment effects within instantaneous measures of gs, Pn, and E; however, instantaneous measures of E showed a trend of increasing particle size resulting in decreased instantaneous E (P = 0.051; Table 5). Instantaneous measurements leaf gs for the plants grown in the particle fractionation substrates aligned in the same sequence with mean particle diameter, resulting in a linear relationship between leaf gs and mean particle diameter (R 2 = 0.844). Instantaneous Pn, gs, and E measurements were similar for plants grown in UPB compared to plants grown in PF4 and PF6, which were lower than the remaining treatments (Table 5). There was no difference in instantaneous WUE (Pn E) among the treatments (P = 0.34). The calculated ET across the entire experiment followed a similar trend to the instantaneous measurements of E, with PF0 using 12.5 L more water than PF6 (Table 4). There was a quadratic (R 2 = 0.998) relationship between mean particle diameter and ET, and there was no difference between P35 and C40 (P = 0.65). The water use in PF2, PF4, and PF6 substrates were all < 7.75 L per plant, the P35, C40, and PF0 used to L per plant, and the UPB 8.83 L per plant, continuing the trend of UPB producing the median value. Producing salable crops with under 20 L H 2 O per plant (and as low as 5.31 L per plant) could represent a significant reduction in water use in commercial container production versus production systems using less efficient irrigation systems. There was no detectable difference in water use efficiency (biomass accumulation/ ET) with a mean of 3.18 ± 0.18 g L -1. However, clear differences amongst the treatment were observed when plotting ET vs VPD (Fig. 3) after removing values occurring at night when water loss was minimal. Assuming VPD as an estimator of evapotranspirational demand that is experienced equally amongst all replicates, the slope of the linear fit was analyzed as the ability 75
107 of the water in the substrate to be moved based on increased VPD. This measure is likely influenced by both the velocity water can be moved at and the distance it can travel. The authors made an assumption that the stomata reacted to the VPD similarly across all treatments as the regulation of transpiration by stomatal closure would be the primary resistance in this water continuum, based on instantaneous leaf gs measures. The three substrates with the highest ET: VPD ratios were P35, PF0, and C40 (due to larger plants utilizing more water), while the three substrates with the lowest substrate water conductance were PF4, PF6, and PF2. The ET:VPD slopes correlate with K(Ψ 75 ) values (r = 0.73, P = ). The only inconsistency in the sequence compared to K(Ψ 75 ) was UPB (10.36 L kpa -1 ). The K(Ψ 75 ) of UPB was larger than that of the C40; however, between the -50 to -100 hpa range the K of the two substrates did intersect (Fig. 2), so while the unscreened bark had a higher K(Ψ 75 ), the C40 K was larger as Ψ approached -100 hpa. It is likely that the increased K over the production range allowed water to move greater distances within the substrate. As Ψ decreased (whether through surface evaporation or from root uptake), water moved with less inhibition from low pore connectivity or from less uniform pore size distributions possibly causing hysteretic restrictions in the substrates with increased production K. These differences may indicate potential for translocating water within a given substrate. Plant size likely impacts this measure as the ΔGI of the plants follows the same sequence across treatments as the K(Ψ 75 ) and ET:VPD slopes. These are interrelated as increased K allowed for greater growth, which creates stronger sinks and therefore drives water uptake. Plant water availability. The effective CC, maximum water held by the substrate after hand watering in situ, was recorded, and compared to CC observed in porometers when bottom saturated. Across the seven substrates, there was a linear relationship between effective CC 76
108 exhibited and porometer-measured CC and were < 5 % different (Fig. 4). Unscreened pine bark was the only substrate that was completely outside of the 95 % confidence interval. This is in part due to the uniformity and connectivity of the pores in the six experimental substrates mitigating the hysteretic effects of the substrate resulting in more uniform water distribution throughout the container in the six experimental substrates than with UPB, thus achieving in situ effective CC more resembling the CC values measured in laboratory analyses via porometer. Reduction in volumetric water content breakpoints from when transpiration was a primary driver of water loss to evaporation of primary water loss occurred from 0.14 m 3 m -3 (P35) to 0.08 m 3 m -3 (PF6), with the PF0, P35, and C40 at higher VWC than those in produced in the PF2, PF4, and PF6 (Fig. 5). The breakpoint for the plants grown in UPB was the median value among the seven substrates (0.12 m 3 m -3 ). The VWC breakpoint occurred at Ψ corresponding Ψ -1.5 MP with the exception of UPB and P35, based on converting VWC to Ψ via Brooks and Corey models fit to MCC data (Fig. 1). The breakpoint of the UPB occurred at a Ψ of MPa. The PF4 and PF6 substrates, which were dominated by large particles and subsequently large macropore volumes, had VWC breakpoints that occurred at Ψ of and MPa respectively, based on the MCC models, when water loss was primarily from evaporation. These extreme values of Ψ are not direct measures and as a result, it is not expected that these plants were able to withdraw water at and MPa, and these values should be cautiously considered. Small reductions in substrate VWC result in massive reductions in Ψ, at low Ψ, which results in nearly asymptotic nature of the MCC. Thus, with the coarse nature of the particles, relatively little water exists on particle surfaces, and Ψ decreases to extremely low tensions with the loss of little water. This can be observed from Ψ for or MPa to have 95% confidence intervals from to and to MPa, respectively 77
109 (Appendix B). The mean VWC of the substrates over time while the plants were allowed to dry down was presented with VPD to show relative consistent diurnal flux in Appendix B. Furthermore, we hypothesize the extreme low Ψ reached by these substrates is a result of the pore distribution shifting the physical classification of water present in the substrate. The relatively small surface area and large macropore volume in the PF4 and PF6 result in reduced hygroscopic (adsorbed to particles) and increased gravitational (moving from gravitational forces) water. Both hygroscopic and gravitational water are generally considered more unavailable to plants than capillary water (water held in pores). The drainage of the gravitational water and relatively little hygroscopic and capillary water results in substrates reaching very low Ψ more rapidly. The particle fractionation substrates which resulted in a shift in pore sizes from gravitational to capillary and hygroscopic (PF2 and PF0) had larger proportions of water unavailable. However, there was increased water present, which allowed plants to continue to grow and utilize water, as the gravitational water readily drains from the substrates. Plants produced in PF4 and PF6 may also have developed stress memory as a result of the low substrate water volumes provided throughout the study (Bruce et al., 2007). While substrate Ψ was held constant, the PF4 and PF6 had lower volumes of water within the container (Table 2). Fleta-Soriano and Munne-Bosch (2016) recently reviewed many aspects of drought stress memory in plants, and discussed the ability of a plant to alter its physiology over the course of a season, within minutes or even seconds as a result of non-optimal water conditions. The resulting reduced total water quantities that were applied to these two treatments to maintain Ψ between -50 and -100 hpa, as well as reduced K restricting plant water access, may have caused the plants in these substrates to alter their water uptake or transpirational mechanisms. This is similar to the practice of deficit irrigation. which is often being utilized more in 78
110 agronomic and fruit production to combat water restrictions (Ferres and Soriano, 2007), has been described for containerized nursery crops (Davies et al., 2016). Since the P35 was considered to have produced some of the best growing plants based on morphological data (Table 4) and possessed the highest K values in the WBC range, we surmise that the increased ability for the plants to uniformly access water throughout the container volume, and the ability of the substrate to deliver water easily across a distance when Ψ decreased allowed for more rapid growth. As a result, we hypothesize that increased substrate K within the WBC range may result in a quicker production period reaching salability in less time. However, it is also apparent that while there was little wasted water (from leaching). Plants herein were grown under optimal conditions, and the addition of peat did not sustain plant vigor at low Ψ similar to the other engineered substrates utilized herein. Therefore, it is possible that the high K in the P35 allowed plants to remove water uniformly from the entirety of the substrate. Consequently, it is possible that other substrates were able to sustain plant vigor via a small hydrated region in the substrate that may not have been able to be utilized until direct contact with roots occurred. Conclusions Pine bark-based substrate K, both saturated and unsaturated, can be manipulated either by mechanical processing and subsequent fractionating or by amending with fibrous materials like peat or coir, with both methodologies affecting various aspects of soilless substrate hydrology. While K s often utilized by researchers due to the ease of measurement, there was no correlation between K s and unsaturated K (within the optimal production range). Therefore, unsaturated K should be utilized to make informed decisions as production K impacts crop morphology and 79
111 ability of the plant to access water. Increasing production range K resulted in increased plant growth based on growth index, and reduced water stress based on compaction and LA. Unsaturated K within WBC can be increased with the addition of peat to a coarse bark, as opposed to the addition of coir. Decreasing mean particle size also increased unsaturated K within the WBC range. When maintaining a constant optimal substrate Ψ, crop water stress is not substantially impacted based on substrate hydrology; however, crop morphology was observed, likely as a result of total water volume available. The plants in substrates with higher K(Ψ 75 ) showed greater growth and vigor while producing the more desirable (marketable) crops (personal observation). Peat amending did not allow plants to withdraw water at lower Ψ compared to other engineered substrates, but instead water became inaccessible to plants grown in the peat amended bark at higher Ψ (-0.6 MPa) than all substrates in the experiment except for UPB. The particle fractionation and the addition of coir to the coarse bark resulted water held in substrates to reach Ψ < -1.5 MPa prior to shifts in trends of VWC reduction. Thus, the authors believe that in optimal growing conditions, the addition of peat will result in improved water distribution and delivery to plant roots. Although, the addition of coir, while improving aeration and retaining sufficient water in the optimal growing Ψ range, will allow for higher proportions of water to be utilized at low Ψ in a water deficit event. Moreover, as the relationship between substrate K as Ψ is dynamic, additional research involving measurements of substrate K at Ψ breakpoints where plants stop removing water from substrates is needed to understand the effect of substrate K on water availability. Furthermore, the degree of water availability as described by de Boodt and Verdonck (1972) was measured on peat based substrates. With the differences in water availability observed in this 80
112 research, it would be beneficial to understand how the degree of water availability as a function of Ψ differs for individual substrates. Literature Cited Argo, W.R Root medium physical properties. HortTechnology. 8: Bayer, A., I. Mahbub, M. Chappell, J. Ruter, and M.W. van Iersel Water use and growth of Hibiscus acetosella Panama Red grown with a soil moisture sensor-controlled irrigation system. HortScience 48: Beeson, Jr., R.C., and T.H. Yeager Plant canopy affects sprinkler irrigation application efficiency of container-grown ornamentals. HortScience. 38: Beeson, Jr., R.C., M.A. Arnold, T.E. Bilderback, B. Bolusky, S. Chandler, H.M. Gramling, J.D. Lea-Cox, J.R. Harris, P.J. Klinger, H.M. Mathers, J.M. Ruter, and T.H. Yeager Strategic vision of container nursery irrigation in the next ten years. J. Environ. Hort. 22: Bilderback, T., C. Boyer, M. Chappell, G. Fain, D. Fare, C. Gilliam, B.E. Jackson, J. Lea-Cox, A.V. LeBude, A. Niemiera, J. Owen, J. Ruter, K. Tilt, S. Warren, S. White, T. Whitewell, R. Wright, and T. Yeager Best management practices: Guide for producing nursery crops. Southern Nursery Association, Inc., Acworth, GA Brooks R.H. and A.T. Corey Hydraulic properties of porous media. Colorado State Univ., Hydro. Paper 5 Bruce, T.J.A., M.C. Matthes, J.A. Napier, and J.A. Pickett Stressful memories of plants: evidence and possible mechanisms. Plant Sci. 173:
113 Chappell, M., S.K. Dove, M.W. van Iersel, P.A. Thomas, and J. Ruter Implementation of wireless sensor networks for irrigation control in three container nurseries. HortTech. 23: Campbell, G.S., and M.D. Campbell Irrigation scheduling using soil moisture measurements: theory and practice. Adv. Irr. 1: Caron, J. and D.E. Elrick Measuring unsaturated hydraulic conductivity of growing media with a tension disk. Soil Sci. Soc. Amer. J. 69: Caron, J., S. Pepin, and Y. Periard Physics of growing media in a green future. Acta Hort. 1034: da Silva, F.F., R. Wallach, and Y. Chen Hydraulic properties of sphagnum peat moss and tuff (scoria) and their potential effects on water availability. Plant and Soil. 154: Davies, M.J., R. Harrison-Murray, C.J. Atkinson, and O.M. Grant Application of deficit irrigation to container-grown hardy ornamental nursery stock via overhead irrigation, compared to drip irrigation. Agri. Water Mgmt. 163: de Boodt, M. and O. Verdonck The physical properties of substrates in horticulture. Acta Hort. 26: Drzal, M.S., W.C. Fonteno, and K.C. Cassel Pore fraction analysis: a new tool for substrate testing. Acta Hort. 481: Egilla J.N., Davies, Jr., F.T., and T.W. Button Drought stress influences leaf water content, photosynthesis, and water-use efficiency of Hibiscus rosa-sinensis at three potassium concentrations. Photosynthetica 43: Farquhar, G.D., J.R. Ehleringer, and K.T. Hubick Carbon isotope discrimination and photosynthesis. Annu. Rev. Plant Physiol. Plant mol. Biol. 40:
114 Fereres, E. and M.A. Soriano Deficit irrigation for reducing agricultural water use. J. Exp. Bot. 58: Fields, J.S Hydrophysical properties and Hydration Efficiency of Traditional and Alternative Greenhouse Substrate Components. M.S. Thesis, N.C. State Univ., Raleigh, NC. Fields, J.S., J.S. Owen, Jr., L. Zhang, and W.C. Fonteno Use of the evaporative method for determination of soilless substrate moisture characteristic curves. Scientia. Horticulturae. 211: Fields, J.S., W.C. Fonteno, and B.E. Jackson. 2014a. Hydration efficiency of traditional and alternative greenhouse substrate components. HortScience 49: Fields, J.S., W.C. Fonteno, B.E. Jackson, J.L. Heitman, and J.S. Owen, Jr. 2014b. Hydrophysical properties, moisture retention, and drainage profiles of wood and traditional components for greenhouse substrates. HortScience 49: Fleta-Soriano, E. and S. Munne-Bosch Stress memory and the inevitable effects of drought: a physiological perspective. Front. Plant Sci. 15: February Fonteno, W.C Problems and considerations in determining the physical properties of horticultural substrates. Acta Hort. 342: Fonteno, W.C. and Harden, C.T North Carolina State University Horticultural Substrates Lab Manual. North Carolina State University. Fulcher, A. and T. Fernandez Sustainable nursery irrigation management series: Part I. Water use in nursery production. Bulletin W287, Univ. of Tennessee. 83
115 Fulcher, A., A.V. LeBude, J.S. Owen, Jr., S.A. White, and R.C. Beeson The next ten years: strategic vision of water resources for nursery and greenhouse producers. HortTechnology. 26: Heiskanen, J Hydrological properties of container media based on sphagnum peat and their potential implications for availability of water to seedlings after outplanting. Scand. J. For. Res. 14: Hunt, A.G., R.P. Ewing, and R. Horton What s wrong with soil physics? Soil Sci. Soc. Am. J. 77: Jury, W.A., and R. Horton Soil physics. John Wiley & Sons. Kenney, J.F., N.L. Barber, S.S. Hutson, K.S. Linsey, J.K.. Lovelace, and M.A. Maupan Estimated use of water in the United States in US Geological Services circular Londra, P.A Simultaneous determination of water retention curve and unsaturated hydraulic conductivity of substrates using a steady-state laboratory method. HortScience. 45: Mathers, H.M., Yeager, T.H., and Case, L.T Improving irrigation water use in container nurseries. HortTechnology 15:8-12. Milks, R.R., W.C. Fonteno, and R.A. Larson Hydrology of horticultural substrates II: predicting properties of media in containers. J. Amer. Soc. Hort. Sci. 114: Million, J., Yeager, T., and J. Albano Consequences of excessive overhead irrigation on runoff during container production of sweet viburnum. J. Environ. Hort. 25:
116 Million, J.B., T.H. Yeager, and J.P. Albano Evapotranspiration-based irrigation scheduling for container-grown Viburnum odoratissimum (L.) Ker Gawl. HortScience. 45: Mualem, Y A new model for predicting hydraulic conductivity of unsaturated porous media. Water Resource Res. 12: Naasz, R, J.C., Michel, and S. Charpentier Measuring hysteretic hydraulic properties of peat and pine bark using a transient method. Soil Sci. Soc. Amer. 69: O Meara, L., M.R. Chappell, and M.W. van Iersel Water use of Hydrangea macrophylla and Gardenia jasminoides in response to a gradually drying substrate. HortScience. 49: Pallardy, S.G Physiology of Woody Plants. S.G. Pallardy (ed) Third Edition, San Diego: Elsevier. Pustjarvi, V. and R.A. Robertson Physical and chemical properties. pp In: Peat in Horticulture. Academic Press, London, England. Raviv, M., R. Wallach, A. Silber, S. Medina, and A. Krasnovsky The effect of hydraulic characteristics of volcanic materials on yield of roses grown in soilless culture. J. Amer. Hort. Sci. 124: Raviv, M. and J.H. Lieth Soilless Culture Theory and Practice. San Diego: Elsevier. Richards, D., M. Lane, and D.V. Beardsell The influence of particle-size distribution in pinebark: sand: brown coal potting mixes on water supply, aeration and plant growth. Scientia Horticulturae. 29:1-14. Stephens, D.B., and K.R. Rehfeldt Evaluation of closed-form analytical models to calculate conductivity in a fine sand. Soil Sci. Soc. Amer. J. 49:
117 U.S. Department of Agriculture Census of agriculture, Census of horticultural specialties. 15 Dec < Online_Resources/Census_of_Horticulture_Specialties/HORTIC.pdf>. van Iersel, M.W. and K.S. Nemali Drought stress can produce small but not compact marigolds. HortScience. 39: Wallach, R., F.F. da Silva, and Y. Chen Hydraulic characteristics of tuff (Scoria) used as a container medium. J. Amer. Soc. Hort. Sci. 117: Warsaw, A.L., R.T. Fernandez, B.M. Cregg, and J.A. Andersen Container-grown ornamental plant growth and water runoff nutrient and volume under four irrigation treatments. HortScience, 44:
118 Figure Captions Figure 1. Measured moisture characteristic curve data (points) fit to Brooks and Corey (1964) models (line) for seven substrates including unscreened pine bark (A), bark particles that pass through a 2.3 mm screen (B), a 4.0 mm screen but not a 2.3 mm screen (C), 6.3 mm screen but not a 4.0 mm screen (D), and pine bark particles that do not pass through a 6.3 mm screen (E) while at 65% moisture content, and bark particles that do not pass through a 6.3 mm screen while at 65% moisture content amended with fibrous materials including 35% Sphagnum peat (F) and 40% coconut coir (G) by volume. Data measured utilizing porometer, evaporative analysis, and dewpoint potentiametry for saturation, -1 to hpa, and <-1000 hpa respectively. Model fit parameters are presented in Table 3. Figure 2. Unsaturated hydraulic conductivity data for seven experimental substrates including unscreened pine bark (UPB), bark particles that pass through a 2.3 mm screen (PF0), a 4.0 mm screen but not a 2.3 mm screen (PF2), 6.3 mm screen but not a 4.0 mm screen (PF4), and pine bark particles that do not pass through a 6.3 mm screen (PF6) while at 65% moisture content, and bark particles that do not pass through a 6.3 mm screen while at 65% moisture content amended with fibrous materials including 35% Sphagnum peat (P35) and 40% coconut coir (C40) by volume. Individual data points (A) measured via evaporative method via difference in tension between two depths in core as moisture evaporates, and B) models representing hydraulic conductivity data between substrate water potentials of -50 and -100 hpa (water buffering capacity) attained from fitting moisture tensions measures to a Mualem (1976) model while weighting for actual data measures in (A). 87
119 Figure 3. Water loss through evapotranspiration vs. vapor pressure deficit for seven substrates including unscreened pine bark (A), bark particles that pass through a 2.3 mm screen (B), a 4.0 mm screen but not a 2.3 mm screen (C), 6.3 mm screen but not a 4.0 mm screen (D), and pine bark particles that do not pass through a 6.3 mm screen (E) while at 65% moisture content, and bark particles that do not pass through a 6.3 mm screen while at 65% moisture content amended with fibrous materials including 35% Sphagnum peat (F) and 40% coconut coir (G) by volume. Line represents the best linear fit. Figure 4. Relationship between in situ effective container capacity for seven experimental substrates in 3.8 L containers and laboratory measured (porometer) container capacity. Substrates included unscreened pine bark (UPB), bark particles that pass through a 2.3 mm screen (PF0), a 4.0 mm screen but not a 2.3 mm screen (PF2), 6.3 mm screen but not a 4.0 mm screen (PF4), and pine bark particles that do not pass through a 6.3 mm screen (PF6) while at 65% moisture content, and bark particles that do not pass through a 6.3 mm screen while at 65% moisture content amended with fibrous materials including 35% Sphagnum peat (P35) and 40% coconut coir (C40) by volume. The dark shaded region represents a 95% confidence interval, while the light shaded region represents a 95% prediction interval. The equation for the line of fit is:. Root mean square error for line of fit = 5.57 percent by vol. and R 2 = Figure 5. The reduction in volumetric water content of seven experimental pine bark-based substrates used to produce Hibiscus rosa-sinensis plantes. Substrates included unscreened pine bark (UPB), bark particles that pass through a 2.3 mm screen (PF0), a 4.0 mm screen but not a 2.3 mm screen (PF2), 6.3 mm screen but not a 4.0 mm screen (PF4), and pine 88
120 bark particles that do not pass through a 6.3 mm screen (PF6) while at 65% moisture content, and bark particles that do not pass through a 6.3 mm screen while at 65% moisture content amended with fibrous materials including 35% Sphagnum peat (P35) and 40% coconut coir (C40) by volume. Substrates with fully rooted plants were watered to effective container capacity (maximum water holding capacity after overhead irrigation) prior to allowing to dry past permanent wilt until the plant ceased withdrawing water from the substrate. Daily reduction in substrate volumetric water contents were plotted against volumetric water content for each substrate to illustrate at what volumetric water content evapotranspiration shifts to primarily evaporation due to plant water uptake diminishing. 89
121 Tables Table 1. Particle size distribution (dry weight basis) grouped into three texture classes (large, medium, small) and bulk density for seven experimental pine bark based substrates. Large Medium Small Bulk density Substrate (>2 mm) (2.0 mm mm) (<0.7 mm) (g cm 3 ) Control Unscreened a 50.8 e b 32.3 b 16.0 b 0.18 b Particle size fractionation c PF0 1.1 f 59.4 a 39.5 a 0.32 a PF d 33.3 b 5.1 cd 0.19 bc PF b 12.6 d 4.5 d 0.15 cd PF a 4.5 e 3.0 d 0.15 bcd Linear d < Quadratic e < < < < Fiber additions f P cd 25.3 c 6.5 cd 0.14 cd C c 21.7 c 8.6 c 0.13 d Pval g a Stabilized pine bark (Pinus taeda) screened through a 12.6 mm screen prior to acquisition from a commercial nursery substrate supplier (Pacific Organics, Henderson, NC, USA). b Means separated across all seven substrates within column utilizing Tukey s HSD with α = c Substrate comprised of pine bark particles that pass through a 2.3 mm screen (PF0), a 4.0 mm screen but not a 2.3 mm screen (PF2), 6.3 mm screen but not a 4.0 mm screen (PF4), and pine bark particles that do not pass through a 6.3 mm screen (PF6) while at 65% moisture content. d P-value for testing the hypothesis of a linear relationship between particle fractionation substrates based on mean particle diameter. e P-value for testing the hypothesis of a quadratic relationship between particle fractionation substrates based on mean particle diameter. f Substrate engineering process involving amending pine bark particles that do not pass through a 6.3 mm screen while at 65% moisture content with fibrous materials to match static physical properties of unscreened bark. g P-value of t-test between two fiber addition substrates. 90
122 Table 2. Hydrophysical properties for seven pine bark-based substrates including, unscreened bark (UBP), four screened barks, and substrates comprised of 6.3 mm bark amended with 35% (by vol.) Sphagnum peat (P35) or 40% (by vol.) coconut coir (C40). Easily available water, water buffering capacity and permanent wilt point are computed from data fit to a Brooks and Corey (1964) model, and therefore have no associated statistics outside of their respective models. Substrate Container capacity a (m 3 m -3 ) Air space b (m 3 m -3 ) Total porosity c (m 3 m -3 ) Easily available water d (m 3 m -3 ) Water buffering capacity e (m 3 m -3 ) Control 91 Total container water load f (cm 3 ) Saturated hydraulic conductivity g (Log 10 cm/d) VWC at -1.5 MPa h (m 3 m -3 ) UPB i c j cd bc c 3.91 bc Particle fractionation k PF a e d a 3.79 c PF d b c c 4.76 a PF de ab c d 4.68 ab PF e a c d 4.72 a Linear l NA NA NA Quadratic m < < NA NA < NA Fiber additions n P b d ab a 3.58 c C bc c a b 3.72 c Pval o NA NA NA a Container capacity is the maximum percentage of substrate volume occupied by water after allowing to drain for one hour, b Air space is the minimum percentage of substrate volume occupied by air after allowing to drain for one hour. c Total porosity is the percentage of substrate volume not occupied by solid particles; often calculated as TP = CC + AS. d Percentage of substrate volume occupied by water that is released between -10 and -50 hpa of tension. e Percentage of substrate volume occupied by water that is released between -50 and -100 hpa of tension. f Volume of water held between -50 and -100 hpa of tension for a 3.9 L container. Calculated based on moisture characteristic curves and individual container substrate volumes. g A quantitative measure of the substrate s ability to transmit water when subjected to a hydraulic gradient. h Volumetric water content of a substrate when substrate water potential is -1.5 MPa. *Continued on next page.
123 i Aged pine bark screened through a 12.6 mm screen prior to acquisition from a commercial nursery substrate supplier (Pacific Organics, Henderson, NC, USA). j Means separated across all seven substrates (entire column) utilizing Tukey s HSD, α=0.05. k Substrate comprised of pine bark particles that pass through a 2.3 mm screen (PF0), a 4.0 mm screen but not a 2.3 mm screen (PF2), 6.3 mm screen but not a 4.0 mm screen (PF4), and pine bark particles that do not pass through a 6.3 mm screen (PF6) while at 65% moisture content. l Probability of linear relationship amongst particle fractionation substrates based on mean particle diameter. m Probability of quadratic relationship amongst particle fractionation substrates based on mean particle diameter. n Substrate engineering process involving amending pine bark particles that do not pass through a 6.3 mm screen while at 65% moisture content with fibrous materials to match static physical properties of unscreened bark. o Results of t-test to observe differences amongst the two fiber addition substrates. 92
124 Table 3. Fit model parameters for the relationship between volumetric water content and substrate water potential for seven experimental pine bark-based substrates. Data were fit to a Brooks and Corey (1964) porous media moisture tension model. Substrate a ϴs b (cm 3 cm -3 ) ϴr c (cm 3 cm -3 ) d H b (hpa) λ e R 2 RMSE f (cm 3 cm -3 ) UPB x PF PF PF PF P x C a Substrates include unscreened pine bark (UPB), substrates engineered through sieving pine bark while at 65% moisture content through a series of screens. Particles that pass through a 2.3 mm screen (PF0), a 4.0 mm screen but not a 2.3 mm screen (PF2), 6.3 mm screen but not a 4.0 mm screen (PF4), and pine bark particles that do not pass through a 6.3 mm screen (PF6) while at 65% moisture content, and Substrate engineering process involving amending pine bark particles that do not pass through a 6.3 mm screen while at 65% moisture content with fibrous materials to match static physical properties of unscreened bark utilizing 35% Sphagnum peat (P35) and 40% coconut coir (C40) by volume. b Volumetric water content at saturation. c Volumetric water content when increasing moisture tension does not further reduce volumetric water content. d Bubbling pressure (tension which air first enters the substrate). e Pore size distribution uniformity index, larger values represent increased pore uniformity. f Root mean square error of the predictive model compared to the observed data. 93
125 Table 4. Plant growth and water status metrics of Hibiscus rosa-sinensis Fort Myers grown in seven pine bark-based substrates including, unscreened bark (UBP), four screened barks, and substrates comprised of 6.3 mm bark amended with 35% (by vol.) Sphagnum peat (P35) or 40% (by vol.) coconut coir (C40). All plants produced while holding substrate matric potential between -50 and -100 hpa. Substrate Growth index increase a (cm) Leaf area b (cm 2 ) Compactness c (g cm -1 ) Control Root : shoot dry mass ratio d Total water volume used e (L) δ 13 C f UPB g b h 2190 ab abc a 8.83 ab a Particle size fractionation i PF a 2610 ab ab a a a PF c 1344 ab bc a 7.72 ab a PF c 1286 ab c a 6.14 ab a PF c 1065 b c a 5.31 b a Linear j Quadratic k Fiber additions l P ab 3094 a a a ab a C b 2897 a ab a ab a Pval m a Difference between growth index at the culmination and initiation of the study b Total leaf area per plant at culmination of the study. c Shoot dry weight shoot height at culmination of the study. d Ratio of dried root mass to dried shoot mass for individual plants at culmination of study. e The total quantity of water that was provided to the individual containers throughout the study. Considered to be representative of total evapotranspiration over the same duration. f The difference in 13 C: 12 C isotopes in newly mature foliar samples for each treatment and a Pee Dee Belemnite control sample. g Stabilized pine bark (Pinus taeda) screened through a 12.6 mm screen prior to acquisition from a commercial nursery substrate supplier (Pacific Organics, Henderson, NC, USA) h Means separated across all seven substrates (entire column) utilizing Tukey s HSD, α=0.05. i Substrate comprised of pine bark particles that pass through a 2.3 mm screen (PF0), a 4.0 mm screen but not a 2.3 mm screen (PF2), 6.3 mm screen but not a 4.0 mm screen (PF4), and pine bark particles that do not pass through a 6.3 mm screen (PF6) while at 65% moisture content. j Probability of linear relationship amongst particle fractionation substrates based on mean particle diameter. k Probability of quadratic relationship amongst particle fractionation substrates based on mean particle diameter. l Substrate engineering process involving amending pine bark particles that do not pass through a 6.3 mm screen while at 65% moisture content with fibrous materials to match static physical properties of unscreened bark. m Results of t-test to observe differences amongst the two fiber addition substrates. 94
126 Table 5. Instantaneous water status measurements made with a portable photosynthesis system a on Hibiscus rosa-sinensis Fort Myers plants grown in seven bark-based substrates. Plants were irrigated such that substrate water potentials were maintained between -50 and -100 hpa. Net photosynthesis Stomatal conductance Transpiration Substrate μmol CO 2 m -2 s -1 mol H 2 O m -2 s -1 mmol H 2 O m -2 s -1 Control Unscreened b ± 0.71 c 0.16 ± ± 1.0 Particle size fractionation d PF ± ± ± 1.6 PF ± ± ± 1.0 PF ± ± ± 4.3 PF ± ± ± 1.2 Linear e Quadratic f Fiber additions g P ± ± ± 1.2 C ± ± ± 2.5 Pval h a LI-COR 6400xt measurements with temperature = 33.4 C, relative humidity = 40.5%, and photosynthetic active radiation = 1300 µmol m -2 s -1. b Aged pine bark screened through a 12.6 mm screen prior to acquisition from a commercial nursery substrate supplier (Pacific Organics, Henderson, NC, USA). c Standard error of the mean. d Substrates engineered through sieving pine bark while at 65% moisture content through a series of screens. Particles that pass through a 2.3 mm screen (PF0), a 4.0 mm screen but not a 2.3 mm screen (PF2), 6.3 mm screen but not a 4.0 mm screen (PF4), and pine bark particles that do not pass through a 6.3 mm screen (PF6) while at 65% moisture content. e Probability of linear relationship amongst particle fractionation substrates based on mean particle diameter. f Probability of quadratic relationship amongst particle fractionation substrates based on mean particle diameter. g Substrate engineering process involving amending pine bark particles that do not pass through a 6.3 mm screen while at 65% moisture content with fibrous materials to match static physical properties of unscreened bark. h Results of t-test to observe differences amongst the two fiber addition substrates. 95
127 Figure 1. 96
128 97
129 Figure 2. 98
130 99
131 Figure
132 101
133 102

134 Figure
135 Figure
136 CHAPTER IV The Influence of Substrate Hydraulic Conductivity on Plant Water Status of Ornamental Container Crop Grown in Sub-Optimal Substrate Water Potentials. Formatted to fit style guide for publication in HortScience 105
137 Abstract. Soilless substrates are inefficient with regards to water (i.e. high porosity and low water holding capacity), which provides an excellent opportunity to increase water efficiency in containerized production. We suggest that increasing hydraulic conductivity in the dry range of substrate moisture content occurring during production can increase water availability, reduce irrigation volume, and produce high quality, marketable crops. Three substrates were engineered using screened stabilized pine bark, and amending with either Sphagnum peatmoss or coconut coir to have higher unsaturated hydraulic conductivity between water potentials of -100 and -300 hpa. There was no correlation with the unsaturated hydraulic conductivity and saturated hydraulic conductivity (r = 0.04, P = ). Established Hydrangea arborescens Annabelle plants were grown in the three engineered and a conventional (control) pine bark substrates exposed to sub-optimal irrigation levels (i.e. held at substrate water potentials between -100 and hpa) for 32 days. The plants in the engineered substrates outperformed the control in every growth and morphological metric measured, as well as showing fewer (or none) drought stress signs compared to the control. We observed increased vigor measures in plants grown in substrates with higher unsaturated hydraulic conductivity, as well as greater water acquisition. The coir increased unsaturated hydraulic conductivity and provided increased air space when incorporated into coarse bark versus peat at the same ratio by volume. Increasing pine bark hydraulic conductivity, through screening or fiber amending, in concert with low irrigations can produce marketable, vigorous crops while reducing water consumed and minimizing water wasted in ornamental container production. 106
138 Introduction Fresh water is a limited resource that is necessary for the production of all plants, a fact recognized by both the public and specialty crop producers. Forty percent of freshwater withdrawn in the United States is used for irrigation of crops (Kenney et al., 2009). Plants in an intensive controlled container production systems must receive quality fresh water daily or multiple times in day, in the absence of precipitation, to prevent actual or perceived plant water stress. Because of this, growers often apply excess water to container crops to alleviate concerns of under watering that could render the plant unmarketable or delay time to sale (Mathers et al., 2005). This has led to container nurseries applying upwards of 180 m 3 of irrigation per hectare per day during the warm season (Fulcher and Fernandez, 2013). With water restrictions looming, growers will have to adopt more sustainable cultural practices to remain successful. Most container nurseries utilize overhead irrigation on all or a portion of their operation and do not have the infrastructure to switch to more sustainable irrigation systems (Beeson et al., 2004). Therefore, growers must expand their efforts beyond irrigation technology to increase water sustainability (Fulcher et al., 2016). One area where growers can make modifications that provide potential water savings, without additional infrastructure, is selecting more sustainable soilless substrates (Barrett et al., 2016). Substrates with increased sustainability would include those that increase water storage capacity or more effectively deliver stored water to the plant. Conventional soilless substrates were initially developed to provide growers with increased control over the container system. Substrates are highly porous so that they drain rapidly, prevent salt stress, and are pathogen free (Raviv and Leith, 2008). Furthermore, these substrates were developed to allow containers to receive excess water from precipitation without concerns of flood stress as observed in some mineral soils. As a result, current best management practices 107
139 (BMPs) for container nursery production recommend maximum water holding capacity or container capacities (CC) > 45% and air spaces (AS) < 30% of the container volume (45% to 65% by vol. and 10% to 30% by vol., respectively; Bilderback et al., 2013). These increased AS values, compared to a field soil, allude to the primary focus of substrate design being to release water as opposed to water retention or storage. Furthermore, conventional wisdom based on past research infers that the degree of water availability has strict cutoffs of easily available water (between -10 and -50 hpa substrate water potential; Ψ) and water buffering capacity (Ψ between -50 and -100 hpa), with all water held at Ψ <-100 hpa not readily accessible to plants (de Boodt and Verdonck, 1972; Pustjarvi and Robertson, 1975). We believe substrates should provide a better balance of sufficient drainage and water retention. Such substrates should retain water during and after irrigation events to reduce water volume required to grow containerized crops. As substrate science develops, understanding more about utilizing dynamic hydraulic properties as measures of substrate productivity as it relates to resource (i.e. water and mineral nutrient) sustainability is becoming imperative (Caron et al., 2014). The relationships between substrate water potential (Ψ), volumetric water content (VWC), and hydraulic conductivity (K) have been discussed as has their importance in substrate engineering and selection in previous chapters of this dissertation (Fields, Chapter 3). Moisture characteristic curves (MCC) are common examples of providing information on dynamic hydraulic properties that depict the relationship between VWC and Ψ (Bunt, 1961). Better defining the relationship between K and MCC provides information on substrate environmental sustainability (through increased resource retention; Naasz et al., 2005) and water availability (O Meara et al., 2014). While the relationships between substrate K and Ψ or VWC are not commonly measured, saturated hydraulic conductivity (Ks) is increasingly utilized. This is due to K being a limiting 108
140 factor for water uptake by roots in soilless substrates (Raviv et al., 1999) and field soils (Campbell and Campbell, 982). Unlike K s, unsaturated K remains difficult to accurately measure (Raviv et al., 1999). However, I reported in Chapter 3 that there was a little correlation (r = , P = ) between production K (Ψ = -75 hpa) and measured K s for bark based substrates. Additionally, measuring substrate K can aid in irrigation decisions and help reduce water stress in container production (da Silva et al., 1993). Utilizing more recent developments in measuring substrate properties, we may be able to maximize water distribution and use in container substrates, thereby reducing water consumption by container nurseries. One metric utilized to measure plant response to modified substrates in regards to water dynamics, is water use efficiency (WUE). Water use efficiency has been described numerous ways, from intrinsic (rate of carbon assimilation: rate of transpiration) to integrated (biomass produced: total transpiration) all of which provide useful information regarding plant-water interactions (Bacon, 2004). However, these measures may not be as important for ornamental growers, as growth alone may not be the most influential factor in sales. Another metric to measure plant-water response to modified substrates is water availability, which affects crop stress, time to market, and corresponding nutrient availability. Water availability is a measure of percentage of water held by a substrate that a plant can utilize to sustain life. This metric may be beneficial to producers attempting to grow with reduced water. Other metrics that should be considered are drought stress indicators, many of which are measurable. Each metric has value to researchers, and when used in concert, can provide information to the water dynamics of the substrate-plant system holistically. Drought stress can be achieved by allowing plants to reach low Ψ prior to rehydration (Brown et al., 1992). 109
141 The goal of this research was to determine if substrates engineered to have optimal hydraulic properties could continue to produce a quality, salable Hydrangea arborescens crop grown at Ψ previously considered unfavorable for container production. Furthermore, we wanted to determine how suboptimal Ψ influences crop physiology and morphology. Finally, we wanted to determine differences in plant water availability between the substrates engineered to have increased hydraulic conductivity versus an unaltered bark substrate. We hypothesized that these engineered substrates will provide the plant with access to higher proportions of water and increase WUE, while reducing indicators of drought stress common to plants grown at low Ψ, which plants grown in traditional bark substrate will exhibit. Moreover, the materials utilized for engineering substrates (i.e. fibrous materials added to the bark) will affect the plant-substrate water dynamics measured through subsequent plant physiology and morphology. Materials & Methods Substrate preparation. On 10 March 2016, we acquired 1.2 m 3 of aged loblolly pine bark (PB, Pinus taeda L.) passed through a 12.6 mm screen at a commercial bark processing plant (Pacific Organics; Henderson, NC). Bark was then separated into two particle size fractions by shaking it through a 4 mm screen (W.S. Tyler, Mentor, OH) rotating at approximately eight oscillations per s in a custom fabricated shaker (Steve s Welding, Williamston, SC) at the Substrates Processing and Research Center at North Carolina State University, Raleigh NC. The process entailed shoveling 0.1 m 3 of pine bark ( % SE moisture content) into the shaker tray to a depth of 7 cm and shaking for five min. The bark was then separated into two drums; stored bark that passed through the 4 mm screen, termed fine bark (FB), and bark that did not pass through the 4 110
142 mm screen into separate 0.19 m 3 drums. The screening process separated the bark by 50% by vol. (i.e. the volume of the bark that passed through the screen was equal to that did not pass through). An additional 0.19 m 3 drum was filled with <12.6 mm pine bark termed unprocessed bark (UB). All drums were sealed to prevent moisture loss, and transported to the Virginia Tech Hampton Roads Agricultural Research and Extension Center in Virginia Beach, VA for blending, analysis, and experimentation. Utilizing particles that did not pass through the 4.0 mm screen, we blended two additional substrates with 35% (by vol.) compressed Sphagnum peatmoss (BP; Fafard, Agawam, MA) or coconut coir 35% (by vol.) coir (BC; FibreDust, LLC, Glastonbury, CT) that were previously hydrated in sealed plastic tubs for 24 h to equilibrate. These component amendment ratios were based on preliminary analyses to mimic static physical properties to that of the unscreened bark, whilst keeping equal amendment ratios of the two fibrous additions (data not shown), even though approximately 50% of the volume of the unaltered bark was removed. These two substrates were then placed into 0.19 m 3 drums and sealed. Physical properties. Measurement included minimum air space (AS), container capacity (CC), total porosity (TP), and bulk density (Db) via porometer analysis (Fonteno and Harden, 2010) for three replicates of each substrate using a 347 cm 3 aluminum core. Particle size distributions (PSD) of three replicates were measured for each substrate by shaking 100 g of oven dried substrate for 5 min with a Ro-Tap shaker (Rx-29; W.S. Tyler, Mentor, OH) equipped with 6.30, 2.00, 0.71, 0.50, 0.25, and 0.11 mm sieve and a pan. Particles remaining on each sieve or in the pan after shaking were weighed and used to determine particle size distribution by weight. 111
143 Hydraulic properties. Saturated hydraulic conductivity (K s ) of each substrate was measured utilizing a KSAT device (Decagon Devices, Pullman, WA). Each substrate was filled from the top into a three-section column consisting of two 250 cm 3 cores attached below and above the 250 cm 3 sample core. The 250 cm 3 was lifted and dropped from 5 cm height five times to obtain uniform Db within the sample core for each substrate. The packed sample core was removed taking care not to disturb the bark at either opening prior to covering with cheesecloth. Cores were then placed into a plastic tub, saturated slowly from the bottom, and left for 24 h to equilibrate prior to being affixed with a collar and appropriate upper and lower screen (all included with the KSAT device). Samples were then placed into the KSAT device and again saturated from the base to replace any water lost during preparation. Saturated hydraulic conductivity was measured three sequential times for each of the three replicates in the constant head measurement mode prior to being removed from the device. Substrate water potentials < -1.0 MPa were measured via a dewpoint potentiameter (WP4C; Decagon Devices) following procedures described by Fields (2013). Each substrate was used to fill stainless steel sampling dishes (Decagon Devices) to completely cover the bottom surface of the dish ( 0.5 cm depth) and dried to different degrees (to ensure varying MC in each dish prior to measurement). Each dish was sealed in the dewpoint potentiameter drawer and substrate water potential ( ) was measured on Precise Mode. Dishes were immediately weighed after each measurement and then dried in a forced air drying oven at 105 C for 48 h. This process was repeated until five measurements between -1.0 and -4.0 MPa were attained for each substrate and corresponding volumetric water contents (VWC) were calculated utilizing measured Db. 112
144 Moisture characteristic curves (MCCs) and unsaturated hydraulic conductivity (K) curves were developed for each substrate via the evaporative method utilizing a Hyprop (UMS, Munich, Germany) following the procedures described by Fields et al. (2016). We packed each substrate utilizing a column assembly as with previous analyses. Data for each substrate, including TP, K s, and values obtained via dewpoint potentiametry, were then compiled with HypropFit software (UMS, Munich, Germany). Moisture characteristic data were modeled utilizing the Brooks and Corey (1964), model to generate predictive curves of MCCs. The measured K(Ψ) data were plotted, and the MCC data based on effective saturation measured via the evaporative method were utilized along with the K(Ψ) measurements to fit a K(Ψ) model in HypropFit. This model predicted K across the measured tension range and weighted the actual K(Ψ) measurements to produce the strongest fit. The fit was computed (in HypropFit) with a nonlinear regression algorithm that minimized the sum of weighted squared residuals between model prediction (based on MCC measures) and measured K(Ψ) data. Low water crop production. On June , the previously sealed drums containing the four substrates were agitated to ensure homogenization and uniform moisture distribution for each of the four substrates. A volume of 0.13 m 3 of each substrate was amended each with 5.63 kg m -3 controlled-release fertilizer (CRF; 15.0N-3.9P-9.9K 3-mo Osmocote Plus, 3 rd generation with micronutrients, The Scotts Co. LLC, Marysville, OH) and 4.15 kg m 3 lime [1:1 crushed (Rockydale Quarries Corp., Roanoke, VA): pulverized (Old Castle Lawn & Garden, Inc., Atlanta, GA) by wt.]. Thirty-two 3.8 L containers (C400; Nursery Supplies, Chambersburg, PA) were filled loosely to the lip with each substrate and dropped from a 5 cm height three times to provide a bulk density equivalent to that of the cores packed in the laboratory portions of this research. Hydrangea arborescens L. Annabelle liners (Carlton Plants, Dayton, OR) were 113
145 planted in 21 containers of each substrate. Each plant was placed in the center of the container and again dropped once from a height of 5 cm to complete planting. The remaining 11 containers of each substrate remained unplanted (fallow), and five of these fallow containers were immediately oven dried to determine substrate dry weight and Db. The 84 planted containers (4 substrates x 21 containers) and 24 fallow containers (4 substrates x 6 containers) were moved into a shaded mist house, hand watered, and left in the mist house for seven d to allow for root establishment. On 13 June 2016 all planted containers were moved onto an open air nursery gravel pad and placed under daily overhead irrigation (20 min/d) for 21 d to further. On 12 July 2016, plants were pruned to uniform size and placed on benches in a climate-controlled greenhouse. The benches had 12 separate irrigation zones. Each zone consisted of a solenoid valve controlling 10 individual pressure compensating spray stakes (Netafim USA, Fresno, CA; Plum color; 12.1 L h - 1 ) used to water nine containers and a water collection vessel, which measured application volume and frequency. Each irrigation zone was utilized for a single substrate (treatment) with three separate irrigation zones (replicate) assigned to each treatment. We placed one plant and one fallow container on two randomly located lysimeters in each replication connected to a data logger (CR3000 Micro-logger, Campbell Scientific, Logan, UT) via a multiplexer (AM16/32B Relay Multiplexer, Campbell Scientific) that recorded the weight of the container system every 5 min. Air temperature (T) and relative humidity (RH) at canopy height were measured every 5 min with a HMP60 probe (Vaisala, Vantaa, Finland) via the data logger. The total irrigation events for each replicate were logged and used to calculate irrigations per day and total applied water volume was used to calculate time average application rate (ml H 2 O per h). 114
146 One representative plant was harvested from each replicate on 14 July Data measured included leaf length (LL; from leaf tip to leaf base) of the four most apical mature leaves, leaf area (LI-3100C, LI-COR Biosciences, Lincoln, NE), leaf number, and root index [RI; (rooting depth + widest rooting width + perpendicular rooting width)/3]. Roots and shoots were separated, washed clean of debris, dried at 105 C for 7d, and weighed them.. Additionally, we measured growth index [GI; (height + widest width + perpendicular width) /3] of each plant, extracted pore water (LeBude and Bilderback, 2008) on three randomly selected plants in each replicate to determine initial electrical conductivity (EC) and ph. One hundred fifty ml of liquid fertilizer solution (12 g L -1 of soluble 20N-8.6P-16.6K fertilizer solution; JR Peters, Inc. Allentown, PA) was then applied to each container by hand to provide additional nutrition levels through the remainder of the study. On 15 July 2016 [0 Day after initiation (DAI)] automated irrigation control was initiated. A solenoid was actuated, via relays (SDM-CD16AC AC/DC Relay Controller, Campbell Scientific, Logan, UT) when the minimum weight of the plant-container system on a lysimeter was equal to a corresponding of -300 hpa. Plants continued to receive irrigated until substrate reached a calculated weight corresponding to a of -100 hpa. The critical weights (when irrigation was initiated and terminated) of each substrate was determined using each substrate dry weight from previously collected fallow containers and substrate MCCs. A leaching pan, with riser, was placed under a random plant in each replicate to measure volume of water leached after each irrigation. A single emitter from each zone was placed in a bottle to collect water application and leaching volumes daily. Growth index [GI; (shoot height + widest width + perpendicular width)/3]) was calculated approximately every 10 d (0 DAI, 11 DAI, 21 DAI, 32 DAI). 115
147 Instantaneous Water Use Measurements. On 17 and 32 DAI a portable photosynthesis system (LI-6400XT; LI-COR Biosciences, Lincoln, NE) with a light-emitting diode equipped gas exchange chamber was used to measure leaf gas flux including net photosynthesis (Pn), stomatal conductance (g s ) and transpiration. Data were measured between 1100 HR and 1215 HR on both days with the atmospheric and environmental parameters for the measurements on 17 DAI as follows: T = 30.1 C ± 1.2 SD; RH = 46.3% ± 3.0 SD; photosynthetic active radiation (PAR) = 980 µmol m -2 s -1 ± 494 SD, and for 32 DAI as follows: T = 29.6 C ± 0.7 SD; RH = 66.5% ± 2.3 SE; PAR = 1455 µmol m -2 s -1 ± 426 SD. One representative plant of each replicate was selected for measurement, and clamped the leaf chamber fluorometer onto an apical mature leaf ensuring that the leaf was not contorted, and the entire area of the chamber (6 cm 2 ) covered the leaf tissue. This process was done quickly (<90 s) to minimize any possible shadowing that may affect the system or the plant. The chamber mimicked the PAR, T, and RH of the greenhouse environment at the time of measurement. The CO 2 concentration within the chamber was set to and µmol mol -1 ± 0.2 SE for 17 and 32 DAI, respectively. In addition, a pressure chamber (Model 600, PMS Instrument Co., Albany, OR) was used to measure water potential of a severed apical stem consisting of three nodes ( 10 cm) at 32 DAI immediately following gas exchange measurements. Once severed, the stem was immediately fit into a rubber stopper with clay to create an air tight seal. The stem was then sealed in the pressure chamber with the severed surface exposed to the atmosphere. We incrementally increased pressure of the chamber utilizing compressed nitrogen (N 2 ) gas until liquid was first observed exiting the severed stem surface. The entire process in was conducted in < 120 s. 116
148 Harvest. On 32 DAI digital images were taken of representative plants from each treatment. Four plants in each replicate were harvested, including the plant used for instantaneous water status measurements and the plant used for irrigation control. The plant on the lysimeter of each replication had all leaves removed, leaf area (LA) measured (LI-3100C Area Meter; LI-COR Biosciences, Lincoln, NE), and total leaf number counted. Leaf length, as an indicator or plant water status throughout the experiment as impacted by cell elongation (Pallardy, 2008), of the four most apical mature leaves was measured from base to tip (excluding petiole) on all harvested plants. Shoots were severed (above substrate plant material) at the surface of the substrate and washed roots free of substrate. All plant tissue was dried in a convection oven at 58 C for 7 d. Plant water availability. We turned off irrigation, removed the spray stake, and hand watered two plants and a fallow container in each replication to effective CC. One plant and one fallow container were placed on a lysimeter in each irrigation zone. Water loss through evaporation and/or transpiration was recorded until all plants were completely wilted for >2 d beginning 32 DAI. Volumetric water content data were fit to a model which calculated the point where the transition from nonlinear (during ET) to linear (evaporation) occurred. The VWC determined to be the transition between ET and evaporation was then converted to water potential utilizing MCC data for each substrate. Daily reductions in substrate VWC were also plotted against VWC. Utilizing these data plots, the intersection where the data become asymptotic was used to determine when water loss switched from primarily transpiration to primarily evaporation. Data analysis. Data presented in tables with associated statistics were analyzed in JMP Pro (12.0.1, SAS Institute, Inc.; Cary, NC) utilizing Dunnett s test (α=0.05) to compare the engineered substrates to the UB (control). We separated the means of the three engineered 117
149 substrates with Tukey s Honestly Significant Difference (HSD; α=0.05). We fit substrate MCC data to an existing model (Brooks and Corey, 1964) utilizing HypropFit software. The MCC data based on effective saturation measured via the evaporative method were utilized along with the K(Ψ) measurements to fit a K(Ψ) model in HypropFit. This model predicted K across the measured tension range and weighted the actual K(Ψ) measurements to produce the strongest fit. The fit was computed (in HypropFit) with a nonlinear regression algorithm that minimized the sum of weighted squared residuals between model prediction (based on MCC measures) and measured K(Ψ) data. Root mean square error (RMSE) were computed to determine how strong the K(Ψ) model fit the measured K(Ψ) data. Data in tables without accompanying statistics was computed from raw data fit to, and therefore we did not have any further statistics associated. Correlation data, were calculated using Pearson product-moment correlation coefficient in JMP Pro (12.0.1). Nonlinear regression for determining critical transition between linear and nonlinear data in the water availability study was calculated utilizing PROC NLIN in SAS (9.3, SAS Institute, Cary, NC). Results and discussion Physical properties. The physical properties of FB and UB were within ranges recommended by BMPs (Bilderback et al., 2013). Minimum AS in BC and BP was outside of the BMP range (Table 1). Total porosity varied with FB and BP porosity being an average of 6.6% (by vol.) greater than UB and 3.3% less than BC. The BC had the largest TP, indicating increased porosity in when coarse bark is equally amended with coir and to peat, the coir amendment will form increased porosity. Minimum air space between BP, BC, and UB ranged from 30.7% to 40.6% 118
150 (by vol.; Table 1). The UB was near the upper limit of recommended AS. The screening process removed 50% of the volume from the coarse bark, which was replaced by only 35% of the fibrous materials, and therefore the BP and BC had a larger percentage of coarse bark particles. Pine bark screened to < 4 mm (FB) had an 18% shift in AS (18.2% by vol.) and CC (64.1% by vol.) increasing substrate water storage 650 ml compared to the other substrates in the study, when scaled up to a 3.9 L container. Bulk density of engineered substrates (FB, BP, BC) differed from conventional UB, with peat or coir amended bark being 0.06 g cm -3 less and FB being 0.05 g cm -3 greater (Table 1). This result demonstrates the dominance of the overall amount of pine bake in the container as seen in part by examining the particle texture class. Fine bark (FB) had approximately twice the amount of fine (< 0.7 mm) particles compared to the other substrates. The particle textures of UB increased by fine < medium < coarse particles, unlike the fiber amended substrates which had the largest percentage of coarse particles and lowest percentage of medium particles (Table 1). The removal of bark fines and subsequent replacement with fibrous materials (with lower Db than bark) resulted in reduced overall Db similar to previous observations by Pokorny et al. (1986). The Db of FB was greater than all other substrates resulting from reduced AS incurred from removing coarse particles. Bulk density is an important factor in developing soilless substrates, as lighter substrates are less costly to transport (Knox and Chappell, 2014). As a result, we believe that good growth and crop water dynamics in BP and BC may be more advantageous that those in FB. Hydraulic properties. The K models, calculated from MCC data and weighted with measured values, provided adequate fit for data against the measured K data within the Ψ range of 0 to hpa (RMSE = 2.7, 0.3, 3.6, and 3.3 log 10 cm/d for UB, FB, BP, and BC, respectively). The K 119
151 models revealed that the K- 200 (K at Ψ = -200 hpa) from greatest to least was FB, BC, BP, and UB. The resulting increased container capacity and fine particles from FB resulted in increased K -200 facilitating water movement within the substrate at lower ϴ (Table 1). We further plotted the models based on our substrate K(Ψ) measurements over the crop production range in this research [Kp (Ψ between -100 and -300 hpa); Fig. 1] since a primary objective of the substrate engineering process was to increase K when compared to UB. Across K(Ψ), the FB models had increased Kp by approximately an order of magnitude. We were unable to detect any differences in K s between UB and BP or FB. However, K s of BC was more than twice the value of any other substrate (Table 1). Additionally, we successfully increased Kp in all three engineered substrates (Fig. 1), compared to UB. We wanted to know if K s was correlated to Kp and as a result calculated the value of K -200 from the models represented in Table 1. We found little correlation (r = 0.04, P = ) between K -200 and K s. This leads us to believe that while K s is easily measured, knowing K s may not inform practitioners about Kp at least at lower Ψ. However, this hypothesis will need to be tested when utilizing other production Ψ, as often crops are produced closer to saturation than in this study. The MCCs of substrates with fibrous additions (BP, BC) fit using Brooks and Corey model (1964; Fig. 2 C & D) exhibit pronounced bimodal curvature, which is not observed in FB (Fig. 2B). We observe slight bimodal curvature in the UB (Fig. 2A). Therefore, the MCC shape leads us to theorize there is non-continuous pore size distribution likely due to variation in particle size between the largest fibrous particles and smallest plate-like (bark) particles. These shifts occur at Ψ between -25 and -75 hpa in both substrates at which point water is considered to be readily available to plants (Pustjarvi and Robertson, 1975). This indicates these substrates 120
152 would retain more water in these ranges. Increased tensions must be used to cause water to vacate pores associated with these tensions. The Brooks and Corey model parameters were further utilized to provide estimations of the largest pore diameter and pore uniformity. The models provided a strong fit to the data for all substrates (Table 2). The air entry pressure, considered to be representative of the largest pore diameter, can be transformed utilizing the kelvin equation (Hillel, 1998) to calculate the pore diameters of the largest free void space across substrates as follows: FB = 0.08 cm < UB = 0.14 cm < BC = 0.29 cm < BP = 0.51 cm. The greatest air entry point and corresponding smallest pore in FB was because of increased fine texture particles compared to UB. We observed that the replacement of fine bark particles in BP and BC with fibers allowed larger pores to form within the substrate, when compared to UB. We hypothesize this is a result of the physical form of the fibers themselves as coir tends to be more string-like when compared to the spongy peat fibers. Information on air entry and corresponding largest void space is informative for some metrics like gas diffusivity (Caron et al., 2005), it was weakly correlated to K s (r = -0.35, P = ), and correlated with K -200 (r = -0.71; ). This was unexpected as we would believe that BP, with the largest pore, would have the highest K s ; however, the nature of pore connectivity, pore accessibility likely influences K s more (Hunt et al., 2013). We can also calculate pore size distribution index (λ), in which a greater value indicates greater pore size uniformity; however, λ was weakly correlated with K -200 (r = 0.27, P = ) as well as with K s (r = -0.32, P = ) across substrates. Pore size distribution index, was shown previously in this dissertation (Chapter 3) to be correlated with K for Ψ between -50 and -100 hpa. We can also use the MCC models to predict the VWC of the substrates at various Ψ. For instance, Ψ = -1.5 MPa have been utilized by soil scientists and engineers to provide estimations 121
153 of unavailable water (UW) for agricultural crops. Utilizing the models, we predict the VWC at MPa for BP (9.65%) > BC (7.06%) > UB (5.44%) > FB (3.73%). These predictions correspond with previous research that fibrous materials will retain larger volumes of water at low tensions than bark (Fields et al., 2014). Furthermore, the increased Kp of the FB leads us to believe that since water moves more easily at lower tensions, less water will be retained at Ψ near -1.5 MPa, which is confirmed with the correlation between Kp and UW (r = -0.60, P = ). Initial baseline harvest. We were unable to detect any differences among the treatments for GI (P = ), LA (P = ), compactness (P = ), rooting depth (P = ), shoot dry weight (P = ), and root dry weight (P = ) at the initiation of the experiment. There were detectable differences among treatments in R:S (P = ) and LL (P = ). Tukey s HSD detected that BP had a higher R:S than UB (5.34 to 3.06, respectively), and that BC had greater LL than FB (99.2 to 74.2 mm, respectively). Aside from these two anomalies, which were likely a result of the improved rooting of liners in the fibrous materials, no other differences were detected between plants at the initiation of the study. No treatment differences were detected for EC (P = ); however, we did observe a difference in ph (P = ) with the BP having 1.2 lower ph than the rest of the treatments (5.5 as opposed to 6.7). The difference in ph was expected, as the peat reduces the substrate ph more than bark (Chong et al., 1994) or coir (Abad et al., 2002) due to the inherent lower ph in peat. Moreover, H. arborescens is known to be ph insensitive (Dirr, 2009) and all four values fall within or just above the optimal ph range of 5.5 to 6.5 (Halcomb and Reed, 2012). Low water crop production. Throughout the experiment the difference in GI (ΔGI = culmination GI - initiation GI) indicates plant growth in FB and BC accelerated after 11 DAI, while plants in 122
154 BP and UB grew slower. Hereon, Δ prior to a metric denotes the difference between values at 0 and 32 DAI. After 21 DAI, plants began to grow faster in BP than if produced in UB (Fig. 3). Substrate K -200 decreases from log cm/d (BC) to log cm/d (UB), in the same sequence as observed in final GI (data not shown). The ΔGI was correlated with K 200 (r = 0.69, P = ) which further provides evidence Kp impacts growth, possibly water stress, for container crops grown at Ψ between -100 and -300 hpa. However, the correlation between ΔGI and K s was weak (r = 0.15, P = ); therefore, we conclude that Kp is more informative in container production as opposed to K s which may be informative on water application rate and efficiency due localized pore saturation during initial irrigation. Crop ΔGI in FB and BC was greater than that of UB (P = ; Table 3). With the substrate water potential below optimal conditions, the UB (which aligns with the SNA BMP s for static physical properties) was unable to supply the plant with sufficient water to support equal growth as compared to the other treatments with increased K. This inability to access water in UB is not believed to be a result of root contact as there were no differences in final rooting depth (P = ) nor R:S (P = ; data not shown). There were no differences between treatments in Δ rooting depth, as nearly all plants had roots which reached the bottom of the container (Table 3). We observed increased ΔLL in FB plants when compared to those in UB, and increased difference in ΔLA in BC plants compared to UB plants (Table 3). We also observed overall treatment effects in ΔLA (P = ) and ΔLL (P = ) which indicate differences in water stress exhibited by the plants due to the substrate. Leaf area and reduced LL have been both shown to have direct relationship with moisture content and subsequent drought stress (van Iersel and Nemali, 2004) or as a metric of drought stress indicated by leaf expansion (McCree, 1986), respectively. The correlation of ΔLL 123
155 with K 200 (r = 0.68, P = ) illustrates that Kp can be utilized to estimate any potential effects of water stress perceived by plants. There were also treatment differences in ΔR:S (P = ), BP plants had more negative ΔR:S than UB plants (Table 3); however, this may be an artifact of the initial rooting differences. The plants grown in BC had increased Δ compactness than those in UB (P = ; Table 3). The increased compactness indicates more mass per canopy volume and has been linked to increased substrate moisture (Bayer et al., 2013). Moreover, we observed that plants in BC had larger Δ compactness than plants in BP, which points to the differences in the fiber amendments. We were unable to find any final morphological metrics with strong correlations to K s (r < in all cases). In fact, all final physiological metrics were more strongly correlated with K -200 than K s. On 32 DAI the treatment effects of total GI were more pronounced across all treatments (P <0.0001), with the total GI of the plants grown in BC (451.0 cm) was the greatest in the experiment, FB (426.5) and BP (376.9) were similar and UB (307.7) the lowest. Plant maximum growth may have occurred in BC versus FB because of superior air exchange throughout establishment, acclimation and experimentation. Plants grown in UB had the lowest final LA (P = ) and LL (P = <0.0001), as well as the lowest compactness (P = ) at the end of the study. As a result, the engineered substrates produced morphologically superior crops compared to the UB control (Fig. 4). Furthermore, the plants in BC had the greatest compactness, LA, and the plants in FB had the greatest LL. The plants produced in UB exhibited signs of drought stress in nearly every measured metric. We hypothesize that this is a result of increased Kp in FB, BP, and BC allowing water to be attained when needed but not restricting the air space necessary for healthy growth. Also, the plants in BC established more rapidly after transplant (personal observation) which may have been due to the added airspace. 124
156 Plants in all treatments received little water throughout the production cycle (< 6.7 L per plant; Table 4). Plants in FB and BC used 3 L more water than UB (2.8 L). This is a result of, ET being influenced by treatment (P = ; Table 4). Irrigation systems driven by Ψ have been shown to reduce water application (Scheiber and Beeson, 2006). Additionally, we were able to detect differences between plants in UB and those in both FB and BC in ET and plant dry mass), as well as treatment effects for ΔC (P = ; Table 4). Even with these effects, when we calculate WUE over the experiment (ET Δ plant dry mass) we are unable to detect any treatment effects (P = ; Table 4). Therefore, we did not effectively alter the WUE of plants by altering substrate hydrophysical properties. Conversely, plants in UB had the lowest shoot dry mass, indicating sub-optimal irrigation (P = ; Klock-Moore and Broschat, 2001). All treatments had leaching fractions (water leached water applied) < 0.09, which shows that between 91% and 99% of the water applied, was used by the plants or evaporated from the container (Table 4). The irrigation system provided water on demand when Ψ reached hpa. We observed that plants in FB and BC were irrigated more frequently than plants in UB (Table 4). Additionally, data was used to calculate time average application rate (P = ; Table 4) which confirmed rate of water application was greatest to crops produced in BC (8.6 ml h -1 ), and least in UB, (3.9 ml h -1 ) indicating the increased Kp allowed these plants to readily draw water from the substrate at Ψp, thus increasing total irrigations over production. Conversely, there were no differences in irrigation frequency amongst the treatments (Table 4). Net photosynthesis, measured 17 DAI, differed between crops grown in the FB and UB (P = ) utilizing Dunnett s test (Table 5). There were no other differences among the three engineered treatments in Pn, gs, and transpiration. Still correlations between K 200 and Pn, gs, and 125
157 transpiration existed (r = 0.67, 0.61, and 0.66, respectively, P = , , and , respectively), further indicating the influence of Kp on crop growth when Ψ remained suboptimal. At 32 DAI, instantaneous gas exchange measurements of crops grown in UB and FB differed (Table 5). Additionally, g s and transpiration were more strongly correlated with K 200 than on 17 DAI (r = 0.71 and 0.74 respectively; P = and , respectively), with Pn correlation nearly identical (r = 0.65, P = ), alluding to the increasing importance of Kp as the crop grows and requires more resources. The difference in gas exchange between 17 and 32 DAI is likely an artifact of increased vigor plants, as increased LA indicates increased transpiration (Vertessy et al., 1995). Stem water potential measures on 32 DAI were not influenced by treatment (P = ), nor was there a strong correlation with K 200 (Table 5). Conversely, stem water potential correlated with Pn, gs, and transpiration on 32 DAI (r between 0.64 and 0.67 for all three metrics). These instantaneous measures should be utilized as relative measures to compare treatments, and not make assumptions of total crop performance as they are only indicative of the plants at that point in time. Plants in the FB treatment had the largest measured Pn, gs, and transpiration of all the treatments at 32 DAI. Instantaneous WUE (Pn transpiration) values for UB (17 DAI 3.55, 32 DAI 2.69), FB (17 DAI 2.89, 32 DAI 2.67), BP (17 DAI 3.56, 32 DAI 3.05), and BC (17 DAI 3.76, 32 DAI 2.01) indicates that plants in all treatments were using water more efficiently on 17 DAI than 32 DAI, which is hypothesized to be a result of increased growth and vigor (LA and GI), but could be an artifact of varying environmental conditions. Also, FB and BC grew faster and with increased vigor when compared to other plants, but the plants in BP were consuming the least water per carbon fixed at 32 DAI. 126
158 Instantaneous WUE was greatest in plants grown in PB at 32 DAI; however, this may have been a result of less developed plants grown in UB skewing measures (Fig.4). While all three engineered substrates (excluding UB) were capable of producing marketable crops at this Ψp (Fig. 4), the BC and FB produced marketable plants quicker than the BP, reducing time to market. Since the difference in water per plant was not extreme and the leaching fractions (water wasted) was minimal across all treatments, it would likely be worth the added water inputs to push plants to marketable levels sooner, which in itself would reduce water consumption. The UB, which was within the BMP recommendations for physical properties, was unable to maintain proper hydration throughout the experimental portion of the study. We hypothesize that this is likely a result of reduced Kp, which we believe will become more critical as Ψ is reduced in even drier production scenarios. Plant available water. The plant utilized water in FB for d, after being irriagted to effective CC and water withheld, at which point water loss was primarily due to evaporation (Table 6). This was the least time for a plant to reach this point; however, this is likely a result of increased plant size. The plants in PB, BC, and UB followed in sequence. This timing follows similar sequences as K 200, aside from the reversal of PB and BC, which is likely a result of an inverse relationship between K of peat and coir additions at Ψ > -100 hpa (Chapter 3). Therefore, since the plant experienced a wide range of Ψ prior to ceasing water uptake, and over the entire Ψ, the K of BP may be larger than K of BC. The final GI and LA of the plants would also be a major driver of time taken to reach the VWC that transpiration reduces and water loss is primarily driven by evaporation, However, since there was no difference in final GI between plants grown in FB and BC, we hypothesize that the increased K allows for the plants to absorb water from the substrate at a higher rate, consuming available water more readily. 127
159 The reductions in VWC over each 24 h period (from 0000 hr to 0000hr) were plotted against the total VWC for the substrate (Fig. 5). These data show a clear switch to an asymptotic relationship at the same calculated VWC critical point. The change in this relationship was equal to the nonlinear to linear breakpoint in VWC over time regression. We observed that the UB and BP were at similar VWC when water loss transitioned from ET to evaporation ( 13.0%). Plants in FB and CB also ceased water uptake at similar VWC (10.1; Table 6). The increased K in the FB and CB may have allowed for more water to be removed; however the slight difference between the four substrates may correspond with the lack of difference of final R:S, which has been known to indicate water availability (Harris, 1914). Further conversions of the VWC critical points, utilizing MCC models, we see that the plants in the UB and FB ceased withdrawing water at Ψ of MPa, and the plants in BP and BC were at MPa when plants stopped removing water from the substrate. These values were much higher than we had hypothesized based on previous research (Chapter 3), as none of the crops approached Ψ of -1.5 MPa as we provided previously in this dissertation (Chapter 3). This to be a species-specific trait. Hydrangea sp. are known to flag, or readily wilt without continuous water during high temperatures (O Meara et al., 2014). There was no correlation between Ψ at which plants stopped absorbing water and K 200 or K s. Conversely, the VWC critical point was correlated with K 200 (r = -0.78, P = ). Both these values are based on models and therefore based on low total data points (n = 4). Conclusions Measurement of substrate Kp was correlated to measured parameters of crop morphology and physiology, suggesting it is a meaningful metric for evaluating and comparing substrates. Substrate K s, while more commonly measured, is not correlated to Kp, nor strongly correlated to 128
160 any physiological or morphological metric, and therefore does not yield information that will help predict crop success as measured by growth and appearance. Furthermore, increased substrate Kp will allow plants to access water necessary to not only sustain vigor, but also produce marketable crops utilizing less water. The increased Kp likely allows for quicker time to market for ornamental containerized crops. Crops can be produced with minimal water loss from leaching when specialized, engineered substrates with increased K are used and irrigation is managed to hold crops at Ψ between -100 and Additionally, the low volumes of water the plant receives will provide growers with water savings during production. We also observed that lower production Ψ did not enable plants to continue withdrawing water at low Ψ unlike previous research and hypothesize that this is more of a species artifact. From previous research we understand that substrate K is different over Ψ ranges and therefore all substrates are not suitable for every Ψ range. The coir fiber seems to increase K more than the peat fiber when at Ψ < -100 hpa, and provides more AS which will benefit gas exchange if crops become over hydrated. The high percentage of fine particles in FB, which was designed for this irrigation scenario, produced high quality plants in this research. However, if utilized in traditionally irrigated systems or in production that includes precipitation, gas exchange would likely be limiting and deleteriously influence crop vigor. Further research into utilization of substrate K, VWC, Ψ relationships will lead to development of substrates that hold more sufficient when dry but continue to allow ample drainage readily when in higher moisture systems. 129
161 Literature Cited Abad, M., P. Noguera, R. Puchades, A. Maquieria, and V. Noguera Physio-chemical and chemical properties of some coconut coir dusts for use as a peat substrate for containerized ornamental plants. Bioresource Tech. 82: Bacon, M Water use efficiency in plant biology. Oxford: Blackwell Publishing Ltd., ISBN Barrett, G.E., P.D. Alexander, J.S. Robinson, and N.C. Bragg Achieving environmentally sustainable growing media for soilless plant cultivation systems - A review. Scientia Horticulturae 212: Bayer, A., I. Mahbub, M. Chappell, J. Ruter, and M.W. van Iersel Water use and growth of Hibiscus acetosella Panama Red grown with a soil moisture sensor-controlled irrigation system. HortScience 48: Beeson, Jr., R.C., M.A. Arnold, T.E. Bilderback, B. Bolusky, S. Chandler, H.M. Gramling, J.D. Lea-Cox, J.R. Harris, P.J. Klinger, H.M. Mathers, J.M. Ruter, and T.H. Yeager Strategic vision of container nursery irrigation in the next ten years. J. Environ. Hort. 22: Bilderback, T., C. Boyer, M. Chappell, G. Fain, D. Fare, C. Gilliam, B.E. Jackson, J. Lea-Cox, A.V. LeBude, A. Niemiera, J. Owen, J. Ruter, K. Tilt, S. Warren, S. White, T. Whitewell, R. Wright, and T. Yeager Best management practices: Guide for producing nursery crops. Southern Nursery Association, Inc., Acworth, GA Brooks R.H. and A.T. Corey Hydraulic properties of porous media. Colorado State Univ., Hydro. Paper 5 130
162 Brown, R.D., J. Eakes, B.K. Behe, C.H. Gilliam Moisture stress: an alternative method of height control to B-nine (daminozide). J. Environ. Hort. 10: Bunt, A.C Some physical properties of pot-plant composts and their effects on growth. Plant and Soil 13: Campbell, G.S., and M.D. Campbell Irrigation scheduling using soil moisture measurements: theory and practice. Adv. Irr. 1: Caron, J., Riviere, L.M., and G. Guillemain Gas diffusion and air-filled porosity: effect of some oversize fragments in growing media. Can. J. Soil Sci. 85: Caron, J., S. Pepin, and Y. Periard Physics of growing media in a green future. Acta Hort. 1034: Chong, C., R.A. Cline, and D.L. Rinker Bark- and peat-amended spent mushroom compost for containerized culture of shrubs. HortScience 29: da Silva, F.F., R. Wallach, and Y. Chen Hydraulic properties of sphagnum peat moss and tuff (scoria) and their potential effects on water availability. Plant and Soil. 154: de Boodt, M. and O. Verdonck The physical properties of substrates in horticulture. Acta Hort. 26: Dirr, M.A Manual of Woody Landscape Plants: Their identification, ornamental characteristics, culture, propagation, and uses. Sixth Ed. Fields, J.S Hydrophysical properties and hydration efficiency of traditional and alternative greenhouse substrate components. North Carolina State Univ., Raleigh, NC MS Thesis. 131
163 Fields, J.S., J.S. Owen, Jr., L. Zhang, and W.C. Fonteno The use of the evaporative method for determination of soilless substrate moisture characteristic curves. Scientia Horticulturae 211: Fonteno, W.C. and Harden, C.T North Carolina State University Horticultural Substrates Lab Manual. North Carolina State University. Fulcher, A. and T. Fernandez Sustainable nursery irrigation management series: Part I. Water use in nursery production. Bulletin W287, Univ. of Tennessee. Fulcher, A., A.V. LeBude, J.S. Owen, Jr., S.A. White, and R.C. Beeson The next ten years: strategic vision of water resources for nursery producers. HortTechnology 26: Harris, F.S The effect of soil moisture, plant food, and age on the ratio of tops to roots in plants. J. Amer. Soc. Agron. 6: Halcomb, M. and Reed. S Hydrangea production. Univ. Ten. Coop. Ex. Serv. Hillel, D Environmental Soil Physics 2 nd ed Academic Press, San Diego, CA Hunt, A.G., R.P. Ewing, and R. Horton What s wrong with soil physics? Soil Sci. Soc. Amer. J. 77: Kenney, J.F., N.L. Barber, S.S. Hutson, K.S. Linsey, J.K.. Lovelace, and M.A. Maupan Estimated use of water in the United States in US Geological Services circular Klock-Moore, K.A. and T.K. Broschat Effect of four growing substrates on growth of ornamental plants in two irrigation systems. HortTechnology 11:
164 Knox, G.W. and M. Chappell Alternatives to petroleum-based containers for the nursery industry. Florida Coop. Ext. Serv. ENH1193. LeBude, A.V. and T.E. Bilderback Pour-through extraction procedure: A nutrient management tool for nursery crops. North Carolina Coop. Ext. AG-717-W, 08/2009 BS. Mathers, H.M., Yeager, T.H., and Case, L.T Improving irrigation water use in container nurseries. HortTechnology 15:8-12. McCree, K.J Whole plant carbon balance during osmotic adjustment to drought and salinity stress. Austral. J. Plant Physiol. 13: Mualem, Y A new model for predicting hydraulic conductivity of unsaturated porous media. Water Resource Res. 12: Naasz, R., J.C. Michel, and S. Charpentier Measuring hysteretic hydraulic properties of peat and pine bark using a transient method. Soil Sci. Soc. Amer. J. 69: O Meara, L., M.R. Chappell, and M.W. van Iersel Water use of Hydrangea macrophylla and Gardenia jasminoides in response to a gradually drying substrate. HortScience. 49: Pallardy, S.G Physiology of Woody Plants. S.G. Pallardy (ed) Third Edition, San Diego: Elsevier. Pokorny, F.A., P.G. Gibson, and M.G. Dunavent Prediction of bulk density of pine bark and/or sand potting media from laboratory analyses of individual components. J. Amer. Soc. Hort. Sci. 111:
165 Pustjarvi, V. and R.A. Robertson Physical and chemical properties. pp In: Peat in Horticulture. Academic Press, London, England. Raviv, M., R. Wallach, A. Silber, S. Medina, and A. Krasnovsky The effect of hydraulic characteristics of volcanic materials on yield of roses grown in soilless culture. J. Amer. Hort. Sci. 124: Raviv, M. & Lieth, J. H., Soilless Culture Theory and Practice. San Diego: Elsevier. Scheiber, S., and R.C. Beeson Petunia Growth and Maintenance in the Landscape as Influenced by Alternative Irrigation Strategies. HortScience 41: van Iersel, M.W. and K.S. Nemali Drought stress can produce small but not compact marigolds. HortScience 39: Vertessy, R.A., R.G. Benyon, K.S. O Sullivan, and P.R. Gribben Relationships between stem diameter, sapwood area, leaf area, and transpiration in a young mountain ash forest. Tree Physiol. 15:
166 Figure Captions Figure 1. Hydraulic conductivity models for substrate water potential between -100 and -300 hpa, based off data from evaporative moisture tension and hydraulic conductivity measures of four experimental bark-based substrates. Substrates include a control (UB), bark particles < 4 mm (FB), bark > 4 mm with 35% by vol. Sphagnum peat moss (BP), and bark > 4 mm with 35% coconut coir (BC). Figure 2. Moisture characteristic data (points) fit to a Brooks and Corey (1964) model (line) for four experimental bark-based substrates. Data measured via evaporative method, porometer, and dewpoint potentiametry. Substrates include a control unscreened bark (A), bark particles < 4 mm (B), bark > 4 mm with 35% by vol. Sphagnum peat moss (C), and bark > 4 mm with 35% coconut coir (D). Figure 3. Growth index of containerized plants grown in four experimental substrates at substrate water potentials between -100 and -300 hpa for 32 days. Plant growth index was normalized to at the initiation of the research to demonstrate changes over the experimental production period. Substrates include a control (UB), bark particles < 4 mm (FB), bark > 4 mm with 35% by vol. Sphagnum peat moss (BP), and bark > 4 mm with 35% coconut coir (BC). Figure 4. A digital image of a representative plant from each of the four experimental substrate treatments collected 33 days after initiation of the low substrate water potential irrigation management. Substrates include an unscreened control bark (UB), bark particles < 4 mm (FB), bark > 4 mm with 35% by vol. Sphagnum peat moss (BP), and bark > 4 mm with 35% coconut coir (BC). 135
167 Figure 5. The reduction in volumetric water content of four experimental pine bark-based substrates used to produce Hydrangea arborescens plantes. Substrates included unscreened pine bark (UB), bark particles that pass through a 4.0 mm screen (FB), bark particles that do not pass through a 4.0 mm screen while at 65% moisture content amended with fibrous materials including 40% Sphagnum peat (BP) and 40% coconut coir (BC) by volume. Substrates with fully rooted plants were watered to effective container capacity (maximum water holding capacity via spray stake irrigaiton) prior to allowing to dry past permanent wilt until the plant ceased withdrawing water from the substrate. Daily reduction in substrate volumetric water contents were plotted against volumetric water content for each substrate to illustrate at what volumetric water content evapotranspiration shifts to primarily evaporation due to plant water uptake diminishing. 136
168 Table 1. Hydrophysical properties for four bark substrates maintained at low substrate water potentials. Substrates include a control (UB), bark particles < 4 mm (FB), bark > 4 mm with 35% by vol. Sphagnum peatmoss (BP), and bark > 4 mm with 35% coconut coir (BC). Substrate Static physical properties a Hydraulic conductivity Particle texture classes b Minimum air space (percent vol.) Container capacity (percent vol.) Total porosity (percent vol.) Bulk density (g cm -3 ) Saturated (cm/d) Water potential = -200 hpa (log 10 cm/d) Coarse (g g -1 ) Med (g g -1 ) Unscreened (UB) Fine (g g -1 ) Fines (FB) 18.2 a c * d 64.1 b* 82.3 b* 0.24 a* 8530 b b* 0.50 a* 0.32 a* Bark-peat (BP) 37.0 b* 45.6 a 82.6 b* 0.13 b* 7731 b a* 0.16 b* 0.13 b Bark-coir (BC) 40.6 b* 45.1 a 85.7 a* 0.13 b* a* a* 0.18 b* 0.11 b Pval < < < NA < < a Measured via porometer analysis. Total porosity = minimum air space + maximum water holding (container capacity) b Percent of particle dry weight occupying coarse > 2.0 mm, 2.0 > medium > 0.7, and fine <0.7 mm. c Letters denote detected differences among means of three engineered substrates (FB, BP, and BC) utilizing Tukey s HSD (α = 0.05). d Asterisk denotes detected differences between treatment and UB (control) e Measures of overall treatment effects utilizing ANOVA analysis. 137
169 Table 2. Model parameters and measures of fit for moisture characteristic data fit to a Brooks and Corey model (1964) for four bark substrates. Substrates include a control (UB), bark particles < 4 mm (FB), bark > 4 mm with 35% by vol. Sphagnum peat moss (BP), and bark > 4 mm with 35% coconut coir (BC). Model parameters Measures of fit Substrate Saturation water content ϴs (cm 3 cm -3 ) Residual water content ϴr (cm 3 cm -3 ) Air entry point h b (1/cm) Pore size dist. index λ R 2 RMSE a (cm 3 cm -3 ) Unscreened (UB) Fines (FB) x Bark-peat (BP) x Bark-coir (BC) a Root mean square error of predicted (model) data vs observed (measured) data points. Table 3. Differences in plant physiological and morphological measures from initiation to culmination of low substrate water potential production (i.e. value at 32 DAI - 0 DAI). Root vigor rating is a subjective measure only of the final rooting determined by an author at harvest (32 DAI). Substrates include a control unscreened bark (UB), bark particles < 4 mm (FB), bark > 4 mm with 35% by vol. Sphagnum peat moss (BP), and bark > 4 mm with 35% coconut coir (BC). Substrate Leaf length a (mm) Leaf area b (cm 2 ) Root depth c (mm) Root: Shoot d Compactness e (g cm -1 ) Growth index f (cm) Unscreened (UB) Root vigor rating Fines (FB) 48.6* g ab h 169.5* 2.8* Bark-peat (BP) * b Bark-coir (BC) * a* 151.0* 2.5* Pval i a Distance between leaf tip and base (excluding petiole). b Total area of leaves measured with a Leaf Area Meter (LI-3300c; LI-COR Biosciences) c Deepest depth in container explored by root system. d Dry mass of root system dry mass of shoot system. e Shoot dry mass shoot height. f Canopy volume, calculated as [(height + widest width + perpendicular width) 3] g Asterisk denotes detected differences between treatment and UB (control) h Letters denote detected differences among means of three engineered substrates (FB, BP, and BC) utilizing Tukey s HSD (α = 0.05). i Measures of overall treatment effects utilizing ANOVA analysis. 138
170 Table 4. Irrigation and water use efficiency (WUE) metrics for 32 d of containerized plant production for four substrates held at substrate water potentials between -100 and -300 hpa. Plants were irrigated with pressure compensating spray stakes based on lysimeter readings. Substrates include a control unscreened bark (UB), bark particles < 4 mm (FB), bark > 4 mm with 35% by vol. Sphagnum peat moss (BP), and bark > 4 mm with 35% coconut coir (BC). Substrate Evapotranspiration a (L) Leaching fraction b (cm 3 cm -3 ) Increase in plant dry mass c (g) Irrigation frequency (irrigations/d ) Time average application rate d (cm 3 h -1 ) WUE e (g -1 cm 3 ) Unscreened (UB) Fines (FB) 5.3* f b g * * Bark-peat (BP) b Bark-coir (BC) 6.3* a* * Pval h a Water loss by substrate-plant system (excluding leaching) measured by lysimeter. b Water leached water applied. c The difference in plant dry mass between initiation and culmination of the low substrate water potential production portion of this experimentation. d Volume of water applied time of production e Measured as evapotranspiration carbon acquisition over low water potential production f Asterisk denotes detected differences between treatment and UB (control) g Letters denote detected differences among means of three engineered substrates (FB, BP, and BC) utilizing Tukey s HSD (α = 0.05). h Measures of overall treatment effects utilizing ANOVA analysis. 139
171 Table 5. Instantaneous measures of plant water relations for four experimental bark substrates. Substrates include a control (UB), bark particles < 4 mm (FB), bark > 4 mm with 35% by vol. Sphagnum peat moss (BP), and bark > 4 mm with 35% coconut coir (BC). Data were measured on 17 and 32 days after initiation (DAI) of an experiment where substrate water potential was held between -100 and -300 hpa. Data were measured with a portable photosynthesis meter (LI-COR 6400xt). 17 DAI 32 DAI Substrate Net photosynthesis (mmol m -2 s -1 CO 2 ) Stomatal conductance (mol m -2 s -1 H 2 O) Transpiration (mmol m -2 s -1 H 2 O) Net photosynthesis (mmol m -2 s -1 CO 2 ) Stomatal conductance (mol m -2 s -1 H 2 O) Transpiration (mmol m -2 s -1 H 2 O) Stem water potential a (-MPa) Unscreened (UB) Fines (FB) 9.99* b * * 2.65* 1.03 Bark-peat (BP) Bark-coir (BC) Pval c r - K 200 d a Measured on apical stem consisting of three nodes immediately after severing, utilizing a Model 600 pressure chamber (PMS Instruments, Albany, OR). b Asterisk denotes difference detected between representative treatment and the control (UB) according to Dunnett s test (α = 0.05). c Measures of overall treatment effects utilizing ANOVA analysis. d Pearson s correlation constant between substrate hydraulic conductivity at water potential = -200 hpa and the metric being analyzed. 140
172 Table 6. Plant water uptake cutoff points for four experimental bark substrates. Substrates include a control (UB), bark particles < 4 mm (FB), bark > 4 mm with 35% by vol. Sphagnum peat moss (BP), and bark > 4 mm with 35% coconut coir (BC). Planted substrate watered to maximum water holding capacity and allowed to dry down until plant stopped withdrawing water from substrate. Substrate Unscreened (UB) Fines (FB) Bark-peat (BP) Bark-coir (BC) Water content (m 3 m -3 ) a (0.120, 0.133) b (0.095, 0.107) (0.128, 0.140) (0.095, 0.109) Water potential (-MPa) c 0.09 (0.07, 0.10) 0.11 (0.09, 0.13) 0.32 (0.25, 0.39) 0.37 (0.29, 0.47) RMSE d (g) a Values in parentheses represent a 95% confidence interval from the mean value. b Volumetric water content calculated at time of cessation of water withdrawal. c Substrate water potential utilizing substrate moisture characteristic data modeled to Brooks and Corey model for conversions. d Root mean square error of the data points to the nonlinear to linear regression model, based on container system mass 141
173 Figure 1 142
174 Figure
175 Figure

176 Figure 4 145
177 Figure 5 146
178 CHAPTER V Utilizing the HYDRUS Model as a Tool for Understanding Soilless Substrate Water Dynamics Formatted to fit style guide for publication in Acta Horticulture Presented at the International Society for Horticultural Sciences, International Symposium on Growing Media, Composting, and Substrate Analysis Vienna, Austria, September 9, 2015 Citation: Fields, J.S., J.S. Owen, Jr., R.D. Stewart, and J.L. Heitman Utilizing the HYDRUS model as a tool for understanding soilless substrate water dynamics. Acta Hort. (in press) 147
179 Abstract. Water is a finite resource that is essential for production of containerized crops. Understanding water dynamics within soilless substrates is an essential step in maximizing crop water use efficiency. How water is transported through or within the substrate profile and interacts with the void spaces as shaped by the individual substrate component particles is poorly understood. In an effort to bridge this knowledge gap, computer models were implemented to predict water dynamics within substrates comprised of different components. The soil water model HYDRUS can predict water movement through a porous media during transient (irrigation) and steady state (between irrigations) conditions. In our initial efforts, water dynamics in both Sphagnum peat and pine bark (Pinus taeda L.) based substrates were modeled while progressing towards equilibrium and during a simulated irrigation event (pulse of water) resulting in predictions with expected and realistic outcomes that coincide with observations from prior experiments. The model results showed that the pine bark substrate achieved equilibrium in less time and exhibited a steeper moisture gradient during steady state conditions than did the peat substrate. This is likely a result of larger saturated hydraulic conductivity and lower water holding capacity in the bark-based substrate. During transient conditions, water distribution in the peat substrate was predicted to be uniform, as opposed to rapid preferential movement (channeling) predicted in the pine bark substrate. These results imply that it is possible to engineer more water efficient soilless substrate and also to enact more informed irrigation scheduling, which when combined can increase water retention and subsequent crop water use efficiency. Future applications of HYDRUS could allow researchers to evaluate new substrates before use in production, and improve understanding of how water interacts with substrate particles and pores. 148
180 Introduction There is limited information regarding the movement and distribution of water within soilless substrates during containerized crop production. Conventionally, horticulturists and scientists focus on the increase in water content with decreases in height along the profile of a container due to gravitational forces and the perched water table that forms at the lower container boundary (Bilderback and Fonteno, 1987; Owen and Altland, 2008). Pore water is held between particles in the substrate via surface tension and cohesion, with smaller pores capable of maintaining greater tension, which translates to a more extensive capillary fringe and subsequently increased water holding capacity (Drzal et al., 1999). Furthermore, water content and subsequent availability within the substrate is constantly fluctuating through irrigation events and evapotranspiration. Water mobility and subsequent plant availability is directly related to the energy required for water to overcome gravity and in situ physiochemical forces. Understanding the dynamic distribution of water in a container, as opposed to static physical properties like container capacity (CC) and air space (AS) is critical when engineering substrates to increase water availability. Water dynamic models such as HYDRUS-1D (Simunek et al., 1997) have been widely adopted, yet there is relatively little information available about using such models to describe and contrast water dynamics within soilless substrates. Raviv et al. (2004) noted the need to determine the change in substrate water dynamics of the rhizosphere during and between irrigation events. In 2005, Naasz et al. developed hydrodynamic substrate models to understand influence of water and oxygen balance in peat substrates. Recently, Caron (2013) discussed utilizing models such as HYDRUS to numerically solve the Richards equation (Richards, 1931), which describes the movement of water in unsaturated porous media. Wever et al. (2004) used 149
181 HYDRUS-2D to observe transport of water in substrates consisting solely of perlite. Anlauf and Rehrmann (2012) successfully used HYDRUS-1D to model water movement within a peat substrate irrigated via ebb-and-flow. This model was specifically employed to predict the capillary rise in substrate. Building on the current body of knowledge, it should be feasible to model and compare one dimensional water movement and distribution in traditional bark-based and peat-based soilless substrates. Therefore, our goal is to model water movement during irrigation event and its eventual distribution after equilibration. The specific objective of this paper was to describe a HYDRUS-1D model for two container substrates, a peat-based and a bark-based substrate, that are widely used to produce nursery and greenhouse crops in the eastern US. The model was then used to compare and contrast water dynamics during transient and steady state conditions. Materials and Methods Substrate Characterization HYDRUS-1D (version ; Simunek et al., 2008) models were created for a pine bark-based [9 parts aged pine bark (Pinus taeda L., Carolina Bark Products, Seaboard, NC) to 1 part sand (Heard Aggregates, Waverly, VA) by vol.] and a peat-based (Fafard 1P, Sun Gro, Agawam, MA) commercially available soilless substrate (comprised primarily of Sphagnum peat moss and perlite; specific ratios not provided). These two substrates were chosen to represent nursery and greenhouse container substrates conventionally utilized in the mid-atlantic and southeastern United States. The hydraulic properties of each substrate, including moisture characteristic curves and hydraulic conductivity, were determined using a Hyprop device (UMS, Munich, Germany), which employs the evaporative method as first described by Wind (1968) 150
182 and later refined by Schindler (1980). Saturated hydraulic conductivity was determined using a KSAT device (Decagon Devices; Pullman, WA) utilizing both constant (pine bark substrate) and falling head (peat-based substrate) measurements. Static physical properties, including CC, AS, total porosity (TP), and bulk density were determined using a porometer following procedures of Fonteno and Hardin (2010). The moisture characteristics, with the TP and saturated hydraulic conductivity were fit to models using HypropFit software (UMS, Munich, Germany) and provided all the following model parameters needed to utilize HYDRUS. The moisture characteristic curves as a function of volumetric water content (VWC) curves were fit to constrained van Genuchten (1980) model, as functions of VWC. The MCC data was the used to predict hydraulic conductivity by substrate water potential, while weighting actual hydraulic conductivity measures from the Hyprop analysis.the models and subsequent parameters used in HYDRUS are as follows: Van Genuchten model: Substrate ϴr ϴs n Ks (mm 3 /mm 3 ) (mm 3 /mm 3) (1/mm) (mm/sec) Pine bark Sphagnum peat Where Se represents effective saturation, ϴ represents VWC at both saturated (ϴs) and residual (ϴr) states, α and n are curve fitting parameters in the van Genuchten function, h is the pressure head, K s represents hydraulic conductivity at saturation, and is the tortuosity parameter in the conductivity function (Simunek et al.,2008). 151
183 Equilibration to Steady State Conditions In addition to hydraulic parameters, the HYDRUS model requires specification of the domain length, boundary conditions, and initial condition. The domain was modeled as a container of 250 mm height, representing a trade #1 container (Nursery Supplies Inc., Kissimmee, FL). The systems were being modeled as fallow (unplanted) containers in which the substrate had no water loss from evapotranspiration to exclude any differences that may arise from the presence of roots or atmospheric environment. The upper boundary condition was set as an atmospheric boundary condition and a surface layer, which allowed ponding of water to 20 mm. The lower boundary condition was set as a seepage face with a pressure head threshold of 0 mm. The initial moisture content of the substrates was set at the CC of the substrate, without any moisture gradient throughout the profile. The model was then allowed to run over a 24-hour period to determine steady state conditions (i.e. water distribution throughout the profile at equilibrium). Transient Flow post Equilibration A new model was then produced for both of the substrates with all conditions being the same as the previous, except the steady state conditions (i.e. moisture gradient) from the former model were incorporated into the model as the initial moisture conditions at model initiation at which time a layer of water (15 mm over one second) was applied. The layer of water was incorporated into the system and observed as it moved through the profile of each substrate. 152
184 Data analysis and Interpretation For all models, seven virtual observation nodes were placed throughout the profile to observe water movement at each node. Observation nodes were set at 0 (bottom of container), 10, 63, 125, 188, 240, and 250 mm (upper surface of substrate). Results and Discussion Equilibration to Steady State Conditions The model for the peat-based substrate was initiated at 0.83 VWC cm 3 cm -3 without any gradient in moisture from the top to the bottom. After initiation, the model predicts water redistribution due to gravitational forces over time resulting in an observed shift in water downward creating the expected moisture gradient within the one dimensional, 250 mm tall container. Within one-second water begins to redistribute from the upper surface downward (Fig. 1A). The rate of modeled water movement was relatively linear for 15 min, at which time the rate of water movement began to slow rapidly. Concurrently, the bottom of the container reached saturation within 15 seconds, yet it took over 1 hour for the upper surface (0 mm) to reach equilibrium. Equilibrium is approached after 1 hour throughout the profile; however, we see it takes approximately 165 min. for water to cease movement and reach steady state conditions (Fig. 1A). There was a temporary increase in water content at 188 mm depth as water from shallower depths drained to lower portions of the container (Fig. 2A). Nevertheless, at 153
185 equilibrium, there was an overall decline in water content compared to the initial condition, in the profile from the upper three-quarters (188 mm) of the column as a result of gravity. The model for the aged pine bark-based substrate was initiated at 0.54 cm 3 cm -3 VWC without any gradient in moisture from the top to the bottom, and shows similar trends compared to that of the aforementioned peat-based substrate. Water starts moving downward in the column within one-second; however, in bark the movement is slowed after the first 5 min of the simulation (Fig. 1B). Moreover, the profile approaches equilibrium within 15 min. The lower surface takes approximately 12 min. to reach saturation (Fig. 2B), much longer compared to the peat-based substrate (Fig. 1A). This is likely a result of a significantly larger proportion of the water needing to move from CC at the lower surface to saturation, as expected from the relatively low CC of the bark-based substrate, coupled with larger pore tortuosity in the pine bark-based substrate. The final steady state conditions for the pine bark-based substrate exhibit a steeper moisture gradient throughout the profile (Fig. 1B), retaining less water compared to the peatbased substrate (Fig. 1A). It is hypothesized that this is a result of the difference in pore size distribution (PSD) among the two substrates, with the peat-based substrate having a more heterogeneous PSD with more fine pores and the pine bark-based substrate having more homogeneity within its PSD along with much larger pore diameters. It is further hypothesized that the shorter time to reach equilibrium in the pine bark-based substrate is a result of greater hydraulic conductivity. Transient Flow post Equilibration 154
186 Application of a 15 mm pulse of water to the model allowed for observation of water movement over time as surveyed by change in VWC throughout the one-dimensional substrate profile. The models were started post equilibration to ensure steady state conditions. One second after the 15 mm pulse of water is introduced into the profile, the peat-based substrate at the upper surface (0 mm) is saturated (Fig. 3A). All 15 mm of water is unable to infiltrate the surface resulting in ponding, which maintains saturation of the top 15 mm for 5 seconds. After 15 seconds the VWC at the surface had decreased by 5% below saturation and the water pulse moved down approximately 65 mm. After 5 min, the pulse had completely infiltrated the substrate surface and made its way to the lower boundary of the container, which subsequently initiates the leaching of water out the bottom of the container, as the seepage face pressure head was overcome. After 15 min. the container approached steady state conditions (equal to that of the initial conditions). Within one-hour after the pulse of water was applied moisture conditions approached the original steady state distributions. The pine bark-based substrate followed similar patters when a pulse of water was introduced into the system. In the case of the pine bark-based substrate, there was no observable ponding at the surface of the container after 5 seconds (Fig. 3B), which was expected due to the larger pores and higher hydraulic conductivity. Within 15 min the water pulse had dispersed to approximately 175 mm down the profile followed by a subsequent loss in water out the bottom of the container while a concurrent decrease in water within the upper half of the container occurred. Unlike in the peat-based substrate, water began to be displaced almost instantly from the pine bark-based substrate, coupled with a rapid reduction in bottom flux. Conclusions 155
187 Water distributions within container substrates have primarily been studied using static physical properties. Water inputs versus water outputs and mass balance have been measured and observed in great detail. Water dynamics within soilless substrates have been studied less. Water distribution over space and time can be visually predicted using porous media models such as HYDRUS-1D. The HYDRUS model is able to use hydraulic parameters that are commonly or easily assessed by substrate scientists in order to predict water distribution within a containerized substrate during both steady state and transient conditions. HYDRUS allows researchers to simulate pulses of water as they move through the substrate, as well as providing a prediction of the final distribution of the moisture within the substrate. Initial models have provided plausible outcomes for the two soilless substrates modeled in this research. The incorporation of additional data, including hysteretic properties of substrates, into HYDRUS will likely lead to more accurate predictions. Utilization of the one-dimensional model allows for the observation of water distribution in a vertical plane. In the future, 2D and 3D models could allow for improved prediction of lateral water redistribution and preferential flow throughout the container. Incorporation of data for evaporation, transpiration, and root water uptake may also increase reliability of models used to simulate substrate water flux in production settings. The ability to incorporate models, long utilized in soil science, into soilless substrate science may open a new research paths for the future. 156
188 Literature Cited Anlauf, R., Rehrmann, P., and Scharat, H. (2012). Simulation of water and air distribution in growing media. J. Hort. For. 4, Bilderback, T.E., and Fonteno, W.C. (1987). Effects of container geometry and media physical properties on air and water volumes in containers. J. Environ. Hort. 5, Caron, J., Pepin, S., Periard, Y. (2013). Physics of growing media in a green future. Acta Hort. 1034, Drzal, M.S., Fonteno, W.C., and Cassel, K.D. (1999). Pore fraction analysis: a new tool for substrate testing. Acta Hort. 481: Fonteno, W.C. and Harden, C.T. (2010). North Carolina State University Horticultural Substrates Lab Manual. North Carolina State University. Mualem, Y. (1976). A new model for predicting hydraulic conductivity of unsaturated porous media. Water Resource Res. 12, Naasz R., Michel J.C., and Charpentier S., (2008). Modelling oxygen and water flows in peat substrates with root uptakes. ISHS-IPS, International Symposium on Growing media, September , Angers, France. Acta Hort. 779, Owen Jr., J.S., and Altland, J.E. (2008). Container height and Douglas Fir bark texture affect substrate physical properties. HortScience 43, Raviv, M., Wallach, R, and Blom, T.J. (2004). Effects of physical properties of soilless media on plant performance - a review. Acta Hort. 644, Richards, L.A. (1931). Capillary conduction of liquids through porous mediums. Physics 1:
189 Schindler, U. (1980). A rapid method for measuring the hydraulic conductivity of partially saturated soils from cores samples Arch. Acker- u. Pflanzenbau u. Bodenkunde, 24,1 7. Simunek, J., Huang, K., & Van Genuchten, MT. (1997). The HYDRUS-ET software package for Simulating the One-Dimensional Movement of Water, Heat and Multiple solutes in variably-saturated Media, Version 1.1 pp Bratislava: Inst Hydrology Slovak Acad. Sci. Simunek, J., Sejna, M., Saito, H., Sakai, M., & van Genuchten, MT. (2008). The HYDRUS-1D software package for simulating the movement of water, heat, and multiple solutes in variably saturated media, version 4.0, HYDRUS software series 3. Department of Environmental Sciences, University of California Riverside, Riverside, California, USA, 315 th Van Genuchten, M.T. (1980). A closed-form equation for predicting the hydraulic conductivity of unsaturated soils. Soil Sci. Soc. Amer. J. 44, Wever, G., Nowak., J.S., De Sousa Oliveira, O.M. and van Winkel, A. (2004). Determination of hydraulic conductivity in growing media. Acta Hort. 648, Wind, G.P. (1968). Capillary conductivity data estimated by a simple method. In: Rijtema, P.E., Wassink, H. eds., Water in the Unsaturated Zone, vol. 1. Proceedings of the Wageningen Symposium, June Int. Assoc. Sci. Hydrol. Publ. (IASH), Gentbrugge, The Netherlands and UNESCO, Paris. 158
190 Figures Figure 1. HYDRUS-1D output depicting water distribution in a 250 mm tall container of A) peat-based substrate and B) pine bark-based substrate. Substrates started at container capacity representing the horizontal line at 0.83 cm 3 cm -3 volumetric water content (A; peat-based substrate) and 0.54 cm 3 cm -3 volumetric water content (B; pine bark-based substrate). Each subsequent line off the vertical (initial moisture content) line represents in situ redistribution of water at 1, 5, 15, 30, 60, 120, 300, 900, 1800, and 3600 seconds. Figure 2. HYDRUS-1D output depicting water distribution in a 250 mm tall container of A) peat-based substrate and B) pine bark-based substrate. Substrates started at container capacity representing the horizontal line at 0.83 cm 3 cm -3 volumetric water content (peat-based substrate) 159
191 and 0.54 cm 3 cm -3 volumetric water content (pine bark-based substrate). Each data series represents a depth in the container with 0 representing the upper surface of the substrate and 250 representing the lower surface. Figure 3. HYDRUS-1D output depicting a pulse of water moving through a 250 mm tall container of A) peat-based substrate and B) pine bark-based substrate. The line to the furthest right represents 1 sec duration of the model and each subsequent line back to the equilibrium line represents predicted moisture gradient at 5, 15, 30, 60, 120, 300, 900, 1800, 3600 seconds. 160
192 CHAPTER VI Simulating Water Movement in a Peat and Pine Bark Substrate. Formatted to fit style guide for publication in Vadose Zone Journal 161
193 Abstract. The use of computational models to predict water flux through a porous media is commonplace in many fields of study. However, there is little research employing computational models in soilless substrate research and none reported for bark-based substrate in containerized systems. With the task of continually developing soilless substrates engineered for improved resource sustainability in containerized crop production, soilless substrate research can benefit from adoption of water movement simulations to inform researchers of substrate water dynamics. The purpose of this research was to determine if researchers could utilize readily attainable model parameters from different methods to generate a three dimensional HYDRUS models that can accurately simulate water flow through a hydrated (maximum water holding) and dry (pressure head = 100 cm) peat-based or a bark-based soilless substrate within the confines of a 3.9L container. Model predictions were generated using van Genuchten and Mualem hydraulic parameters from sorption, desorption, hysteretic curve, and evaporative measures. Methods were compared to measurements made in situ using a mass balance, inflow and outflow, approach to determine model accuracy. Model sensitivity to individual hydraulic parameters was tested. It was determined that the model predictions were most sensitive to saturated volumetric water content. The model was optimized for each substrate in the hydrated scenario based on observations in the greenhouse and compared to water simulations under the dry scenario. The hydraulic parameters calculated from desorption or hysteretic curve resulted in an inaccurate model to simulate water flux. Sorption alone provided the most accurate simulation of the water balance observed in either substrate. This was hypothetically due to the decreased saturated volumetric water content used by the model that accounted for the immobile phase of the container void space that included inaccessible pores (trapped air, hygroscopic water, and hysteretically blocked pores) that subsequently reduced water velocity and increased storage 162
194 capacity. We concluded that HYDRUS models can be used to predict water flux through containers, if appropriate measurement techniques are utilized. Furthermore, models should be calibrated to each individual scenario to provide the most accurate predictions. 163
195 Introduction Specialty crop production has begun a shift from in-field production to containerized production to incorporate more sustainable production practices (Caron et al., 2015a). Historically, ornamental crops including small shrubs and floriculture have primarily utilized containers for production (Raviv and Leith, 2008). However, as agricultural practices progress, larger woody ornamental crops (Gillman et al., 2010), small fruit (Kuisma et al., 2014), vegetable (Mininni et al., 2012), and even fruit tree (Bernardi et al., 2015) producers are switching to container production. The cause for these shifts include ease of transportation (Knox and Chappell, 2014), reduction of pathogens (Carlile et al., 2015), precise use of resources (Fonteno, 1993), and the use of regional agricultural and industrial waste products (Raviv, 2013), all with the intent of creating more environmental stewardship (Barrett et al., 2016; Caron and Rochefort, 2013). Container production utilizes soilless substrates to grow crops. Soilless substrates are often composites of organic (e.g. Sphagnum peat, pine bark) and inorganic materials (e.g. perlite, sand), blended to create highly porous substrates that provide adequate air-filled porosity coupled with gravitational drainage to alleviate what is known as the container effect. This container effect phenomenon describes how the use of field soils in containers limits water drainage due to gravitational head not being large enough to overcome matric tensions holding water within pores, resulting in inhibition of root growth (Bilderback, 1980). The use of soilless substrates thus ensures that waterlogged conditions do not dominate the container system and increase the risk of pathogens and growth stunting (Bradford et al., 1982). Sufficient drainage is also important because container producers often apply excess water to reduce risk of water stress (Mathers et al., 2005). 164
196 Soilless substrates have been thoroughly researched (Raviv and Leith, 2008) using conventional tools such as the porometer (Fonteno and Bilderback, 1993) to measure static physical properties to ensure values are within criteria (Bilderback et al., 2013) based on the container effect. However, increased efficiency must be employed to conform to potential water resource restrictions (Fulcher et al., 2016; Gordon et al., 2010). As a result, the importance of dynamic substrate properties, such as unsaturated hydraulic conductivity and gas diffusivity, must be reconsidered when engineering substrates of the future (Caron et al., 2013). Additionally, researchers are increasingly measuring how substrate physical (Altland et al., 2011; Cannavo et al., 2011) and hydraulic properties (Kerloch and Michel, 2015) change during production cycles, and within a given irrigation event (Raviv et al., 1999), noting the change in air-water ratio as the pore distribution rearranges, particles break down, or roots occupy void space. For research to progress, a basic understanding of dynamic properties and how to manipulate them is needed. Nonetheless, there is still fundamental lack of understanding of 1) how to best quantify these dynamic properties; 2) which properties are best correlated with plant success; and 3) how to manipulate substrates so as to optimize their properties for use by growers. Computational models offer the ability to interpret and extend laboratory experiments and improve understanding of how dynamic substrate properties influence water and solute dynamics. Many models are compiled utilizing existing data fit to an algorithm or function formula which allows for prediction of a variable with the input of other variables. Other models are based off solving existing equations to describe physical or chemical processes, whilst still involving the input of known or measured variables or data. One such model, currently utilized heavily in the fields of soil science, engineering, and hydrogeology, is the HYDRUS computer 165
197 model (Simunek et al., 1997). This computational program utilizes input data to numerically solve the Richards equation (Richards, 1931), to predict movement and location of water within a defined system under specified chosen boundary conditions. While widely applied in field soils, HYDRUS has only recently been applied to predict water flow in soilless substrates (Caron et al., 2013). For example, HYDRUS-1D was used to predict the spatial-temporal location of water in both peat and bark substrates during transient and steady-state conditions (Chapter 5). Air and water relationships of peat substrates can be studied through the use of 1-dimensional models (Naasz et al. 2008). Recently, Caron et al. (2013) demonstrated the ability to utilize HYDRUS models to predict water flow in soilless substrates, and presented the merits of utilizing the model, including more efficient use of water in container production. Previously, the HYDRUS-2D model has been utilized to successfully predict water flow in perlite (Wever et al., 2004). The HYDRUS modeling software has also been used to predict water and heat fluxes over a prolonged period (> 1 yr) in green roof substrates (Charpentier, 2015); water movement and substrate hysteresis in a peat substrate in an ebb and flow production (Anlauf et al., 2012); and solute transport in soilless substrates (Boudreau et al., 2009). To date, little research has been undertaken to adapt pine bark substrates to porous media models (such as HYDRUS), even with >60% of United States nurseries utilizes bark as a primary substrate component. The objective of this research was to determine if the HYDRUS computational model can accurately predict water movement through containerized soilless substrates for integration into soilless substrate research. We also used the model to test hydraulic parameter sensitivity, which is important for the design and engineering of future substrates. Moreover, the laboratory analyses to provide hydraulic measurement were tested to understand how measurement 166
198 methodology influences accuracy of model predictions. Accomplishing these objectives will provide researchers with a bridge to utilize the HYDRUS porous media models in container substrate research to engineer and develop more sustainable soilless substrates through improved knowledge of parameter and analysis applications. Understanding of water dynamics in soilless substrates is imperative if researchers want to develop more water efficient soilless substrates. Materials and Methods Substrate preparation. Two soilless substrates were prepared to represent conventional open air nursery production and greenhouse substrate in the Southeastern United States. A (1) stabilized (aged 4-6 mo.) pine bark (Pinus taedea L.) passed through a 12.6 mm screened (Pacific Organics, Henderson, NC) blended with concrete sand at a 9:1volumetric ratio and (2) Canadian Sphagnum peat moss (Fafard, Agawam, MA) blended with horticultural grade super coarse perlite at a 3:1volumetric ratio. Prior to blending of the second substrate, the Sphagnum peat was hydrated and allowed to equilibrate for 24 h. Substrate preparation consisted of hand blending 0.3 m 3 of each substrate. Substrate hydrophysical properties. Static physical properties, including air space (AS), container capacity (CC), total porosity (TP), and bulk density (Db) were measured on three replicates of each substrate utilizing porometer analysis (Fonteno and Harden, 2010). Particle size distribution was measured on three replicates of ~100 grams of each substrate. Mass of particles remaining on each sieve or in the pan after shaking three oven dried samples with a Ro- Tap shaker (Rx-29; W.S. Tyler, Mentor, OH) equipped with 6.30, 2.00, 0.71, 0.50, 0.25, and 0.11 mm sieves and a pan for five min were dried and used to separate distributions. 167
199 A 0.2 m 3 sample of each substrate was sent to Laval University (Quebec City, Quebec, Canada). Adsorption and desorption moisture characteristic curves (water potential at varying volumetric water content; VWC) and corresponding hydraulic conductivity (K) curves, were generated in a 3.9 L nursery container (18 cm ht), utilizing the instantaneous profile (IP) method (Allaire et al., 1994). A four parameter van Genuchten (van Genuchten, 1980) model were fit to moisture characteristic data for both peat- and bark-based substrates, garnered from the evaporative and IP measurements, utilizing SAS (9.4 SAS Institute, Cary, NC) as follows: van Genuchten model: [1] Where Se represents effective saturation. The parameters ϴ S and ϴr are saturated and residual ϴ, respectively, α represents the inverse of the air entry point (cm -1 ), and n is a curve fitting parameter in the van Genuchten function often considered to be indicative of the pore size distribution (Probeska et al., 2006). The parameter h is the water tension (cm). Mass balance calculations. A data logger (CR1000; Campbell Scientific, Logan, UT) was fitted with two lysimeters and placed on a bench in a glass greenhouse on 9 Jan Lysimeters were constructed by attaching two cm 2 square Plexiglas plates to either side of a load cell (LSP- 10, Transducer Techniques, Temecula, CA). The program recorded the weights of the two lysimeters every second. A mass balance device (Fig 1.) was designed to hold a container, supply constant rate of water to the substrate surface via pressure compensated spray stake (inflow or influent) and measure rate and volume of water leached (outflow or effluent), to calculate water 168
200 movement through the container (i.e. mass balance). A 3.9 L container with a spray stake was placed in a funnel (16 cm i.d.) within a18.9 L bucket (Fig. 1). The bucket, with a window cut into the side, was placed on the first lysimeter. A wire was wrapped around a plastic outflow tube affixed to the bottom of the funnel and used to transfer effluent to a second, free standing lysimeter. Irrigation was initiated by actuating a solenoid valve. Time until effluent was observed and rate of inflow and outflow were measured for the duration of the experiment. Additionally, water storage was measured as a function of weight. The mass balance device was calibrated by applying water via the spray stake to an empty container 10 times and the mean time for water to reach the collection pan after leaching from the container was determined to be ~3 ±.03 s. This was used for correction of water flow delay due to experimental setup. Three fallow containers of each substrate were allowed to dry to a matric potential (Ψ) of -100 hpa (based on corresponding VWC from evaporative MCC measurements) prior to measurement, and were individually placed in the mass balance device. Water was applied at a rate of 3 cm 3 s -1, (~240 cm 2 atmospheric surface area), and data recorded. After initial analysis, containers were watered by hand to reach maximum hydration (achievable by overhead irrigation), allowed to drain for 1 h, and measurements were repeated. After both mass balance measurements (hydrated and Ψ -100 ) were made. Substrate was dried at 105 C for 72 h to determine substrate dry mass to calculate VWC of the container. Data from lysimeters and final substrate dry mass were used to back calculate volumetric water content (VWC) and water velocity. Building the container system model. A HYDRUS 2D/3D model was created utilizing the 3D layered domain. A container of the same dimensions as the container (upper dia. = 19.5 cm, lower dia. = 15 cm, h = 18 cm) used for the experiments was simulated in HYDRUS utilizing the integrated HYDRUS geometry functions. The container model was divided into 20 equidistant 169
201 horizontal layers. The model simulated four drain holes on the sides (2 cm dia.), and a central drain hole on the bottom (2 cm dia.) using the seepage face boundary condition, with the seepage pressure head set to h = 0 (Chapter V) for leaching (Fig. 2). The boundary conditions on the upper surface of the container were split into atmospheric and no flux based on measured water distribution pattern observed during a test of the pressure-compensated spray stake (as measured by placing paper towels on the surface of the substrate and turning on the irrigation). The area corresponding to spray-stake influence was selected as an atmospheric boundary condition, which allows water inception, with the area not hydrated by a spray stake was set to no flux boundary condition (Fig. 2). The bulk substrate was created utilizing one material for each model (i.e. peat- or bark-based substrates). Two initial conditions were used: 1) initial hydraulic head of Ψ = -100 cm (dry scenario), and 2) initial saturated water content (hydrated scenario). The initial VWC for the four scenarios were as follows: peat-based hydrated = 0.506, peat-based dry = 0.292, bark-based hydrated = 0.420, and bark-based dry = (m 3 m -3 ). Each model run included a period of 30 min. prior to water infiltration, to allow container water to distribute until reaching equilibrium as described by Fields (Chapter V). Time variable boundary conditions were set to apply water at a rate of cm s -1, which represents the application rate of the spray stake corrected for measured infiltration area. The time of irrigation varied based on corresponding experimental conditions (i.e., peat-based hydrated = 676 s, peat-based dry = 1353 s, bark-based hydrated = 426 s, barkbased dry = 1287 s). The hydrated models were run to simulate a total period of 3,000 s, while the dry models simulated a total period of 4,000 s. The difference in model duration was based on maximum period for in situ containers to reach steady state conditions after maximum storage was reached. 170
202 Sensitivity analysis. The model parameters were inputted into the HYDRUS Soil-Hydraulic Parameters interface for each the peat- and bark-based substrates. The hydrated scenarios were utilized for the sensitivity analyses of both substrates. The model then predicted the outcomes, and four mass balance metrics were chosen to provide encompassing information to the validity of the model to the observed scenarios. Four metrics were chosen to quantify model performance 1) water velocity through the container (measured as time between initiation of irrigation to first leaching), 2) total volume leached, 3) maximum storage capacity (i.e. the maximum water above the initial volume, within the container during the scenario), and 4) the VWC of the system at the culmination of the model. Based on initial observations (data not shown), three hydraulic parameters were determined to most influence model predictions of the four chosen metrics. These three parameters were ϴs, α, and K s. As a result, model sensitivity was measured on these three parameters based on the four metrics for both substrates. Sensitivity analyses were performed by altering each parameter individually in both directions, simulating the model, and measuring effects on the four aforementioned mass balance metrics, to predict mass balance. Sensitivity curves were created to show how changes in each parameter influenced the four metrics (all set relative to the initial, calibrated response). The cumulative flux out of the seepage face (leaching) and container system water load (storage capacity) were also plotted over time to provide visual observations of how manipulation of parameters modified the container-water dynamics. Model optimization. Once the model sensitivity for each parameter was determined, this information was used to optimize the model. Optimization involved an iterative process of finetuning the parameters to result in the model predicting outcomes mimicking the observed outcomes for the hydrated scenarios in both peat- and bark-based substrates. Once an optimized 171
203 set of hydraulic parameters was ascertained, these hydraulic parameters were incorporated into the dry scenario models to determine if models can be optimized by substrate alone, or if initial VWC will require additional calibration. Hydraulic measurement influences. The final portion of this experiment involved contrasting the optimized model with models based on measured hydraulic properties. Storage capacity and leaching curves were developed for the optimized hydraulic model for both hydrated and dry scenarios on both the peat- and bark-based substrates. Each scenario was then computed with hydraulic parameters measured directly from desorption, sorption, and a combination of the two (to measure hysteresis) measurements from the instantaneous profile analyses, as well as evaporative measurements. This provided curves for each substrate of the optimized hydraulics, evaporative measured hydraulics, IP hydraulics with hysteresis, IP desorption only, and IP sorption only. Data analysis. Substrate physical property values were contrasted with a t-test utilizing JMP Pro (12.0.1, SAS Institute, Inc.; Cary, NC). Moisture characteristic curves and hydraulic conductivity curves were modeled by fitting three replicates of data to van Genuchten (1980) and Mualem (1976) models respectively (SAS v9.4, SAS Institute, Cary, NC). The sensitivity measurements were determined by plotting relative change to the four metrics over relative change in parameters. Data from evaporative analysis, IP desorption, IP sorption, and IP with hysteresis were all fit separately to both moisture models. The observed maximum storage and cumulative leaching data were fit to a five parameter biexponential and four parameter logarithmic functions, respectively utilizing nonlinear functions in JMP Pro. The model predictions for each hydraulic measurement in each substrate-scenario were compared to the respective observed 172
204 functions utilizing root mean square errors (RMSE) between the observed and the predicted models. Results and Discussion Substrate hydraulic properties. The CC of the peat-based substrate and the bark-based substrate was 82.6 ± 0.1% and 54.5 ± 1.1% respectively, and the AS of the substrates was 9.1 ± 0.3% and 24.5 ± 0.8% respectively (Table 1). This balance of minimum air and maximum water aligns with research involving these two traditionally used soilless substrates (Fields et al., 2014). In the bark substrate, the inclusion of the sand (10% by vol.) resulted in higher Db and CC (data not shown; note that sand is often incorporated to increase the weight of the container to prevent container tipping and increased water holding capacity; Regan, 2014). The increased CC is mostlikely a result of a larger proportion of fine sized particles and subsequent increased micropore volume (Drzal et al., 1999). However, the bark based substrate also showed an increased mass associated with coarse (> 2 mm) particles and subsequent increase in AS when compared to the peat-based substrate (Table 1). This was to be expected because of the wide range of platy, particles that create non-uniform pore distribution as seen in previous studies in this dissertation (Chapter 4). The peat-based substrate exhibited greater variation amongst moisture characteristic replicates when measured via the IP method (Fig. 3) versus bark-based substrate. This is opposite of what Fields et al. (2016) found when measuring peat- and bark-based substrates with the evaporative method. The difference between the desorption and sorption curves was greater for the peat-based substrate than the bark-based substrate, a phenomena also observed by Naasz et 173
205 al. (2005) when measuring wetting and drying curves in peat and bark substrates. This is in part a result of the larger proportion of macropores in the bark-based substrate when compared to the microporous nature of peat (Tsuneda et al., 2001). These large particles tend to form greater macropore volumes within a substrate (Nkonglo and Caron, 1999), which will reduce water restriction when moving in and out of the pores. This difference between the wetting and drying (or water fluxing in and out of a pore) is known as hysteresis. The peat-based substrate is affected by hysteresis more than the bark-based substrate and likely has a more tortuous path for water to move downward through the profile, at least when under hydrated conditions. The difference in wettability between peat and bark has also been reported to influence the hysteretic differences, as peat exhibited a difference between wetting and drying wettability whereas no dissimilarities were observed in bark (Michel et al., 2008). The large discrepancy between wetting and drying moisture retention in peat-based substrates has also been described by Otten et al. (1999), who reported that the difference between the wetting and drying curves increases as water potential increases. The evaporative measurements of moisture characteristics for the peat- and bark-based substrate (Fig. 4) provided measures at lower tensions than the IP method (between -500 and hpa). However, the VWC values measured for the peat- and bark-based substrates at the lowest tensions measured by the IP desorption curves are very similar. The VWC of peat-based substrate at -100 hpa measured by the evaporative method was 0.36 cm 3 cm -3 and 0.37 cm 3 cm -3 from the IP desorption analysis, while the bark-based substrate at -60 hpa was 0.33 cm 3 cm -3 and 0.29 cm 3 cm -3 measured via evaporative measurements and IP desorption analysis, respectively. Consequently, little difference as ide from 174
206 There are also hysteretic effects in K(VWC) of the two substrates (Fig. 5); however, the differences are less pronounced than in the moisture retention data. The discrepancy between the sorption and desorption unsaturated K data in the bark-based substrate is greater than what was observed in the peat-based substrate. While both the sorption and desorption data of the peat- and bark-based substrate exhibit an exponential relationship, the sorption and desorption measures of peat-based substrate are more similar than in the bark-based substrate. This may be result of increasing inaccessible pore space (increasing tortuosity) in the peat-based substrate, which do not retard the flow of water in the bark-based substrate. The moisture retention (Fig. 3 & 4) and hydraulic conductivity data (Fig. 5) were fit to van Genuchten and Mualem models to provide hydraulic parameters to input into the HYDRUS models. There were similarities between the evaporative measures and the IP desorption parameters, particularly in the moisture retention fits (Table 2). The strong fit (R 2 = 0.99 and 0.96 for peat- and bark-based respectively) for the evaporative measures compared to the weaker fit for the IP measures (R 2 of and for peat- and bark-based respectively) is a result of the variation in replications (Table 2). All replication data were used simultaneously to fit the data to models, and the IP measures exhibited variation among replicates (Fig 3). Sensitivity analysis. The sensitivity of the four metrics used to describe the system (initial velocity through container, total leaching load, maximum storage capacity, and steady state VWC) to the three parameters analyzed in this research (ϴs, α, and K s ) were measured based on relative changes (Fig. 6 & 7). From these relative measures, it was determined that the models were most sensitive to ϴs for both the peat- and bark-based substrates (Fig. 6A & 7A). Increasing and decreasing ϴs by 0.1 in the parameters linearly influenced all four metrics. The leaching load was shifted by approx. 50% for every 0.1 shift in ϴs for the peat-based substrate 175
207 (Fig. 6A) and the bark-based substrate shifted approx. 20% with every 0.1 shift in ϴs (Fig. 7A). The model was not developed to distinguish between individual pore sizes, and therefore predicts that all pores will fill with water uniformly as the wetting front progresses, which is likely not occurring in the actual container system and the reason the sensitivity to ϴs is so great. In container production, water often channels through profile creating a non-uniform wetting front (Hoskins et al., 2013). Based on model results from ϴs sensitivity analysis, it appears that the difference in ϴs used to optimize model and the measured ϴs (i.e and 0.21 cm 3 cm -3 in the peat- and bark-based, respectively) can inform researchers about volumes of trapped air inside substrates. Air that is unable to be displaced as water moves downward through the profile likely contributes to these observations of uneven wetting fronts. Furthermore, organic substrates have higher proportions of immobile water (reduced capillary water proportions) than mineral soils (Caron et al., 2015b), which may interfere with the flux of water through the substrate. I had hypothesized that K s would have been a limiting factor in initial water velocity and leaching load due to potential shifting of unsaturated K measures. The peat-based substrate did not exhibit any increased leaching load with manipulations of K s until it was raised by one order of magnitude (Fig. 6B). Increased K s did increase initial water velocity (based on reduced time to leaching) and reduced maximum storage capacity in peat-based substrates (Fig. 6B) and barkbased substrates (Fig. 7B). The initial water velocity was hypothesized to increase with increasing K s ; however, the degree of influence was less than that of ϴs. Hydraulic conductivity, a measure based on water velocity, and degree of saturation, under unsaturated conditions was influenced little by shifting K s. The reduction in storage capacity resulted from the increased water velocity reducing the time elapsed while the water was in the substrate-system, thus there 176
208 less water was present in the system at any point in time. Final VWC was unaffected by changes in K s for both the peat- (Fig. 6B) and bark-based substrates (Fig. 7B). Alpha, often considered to be representative of the inverse of the air entry value, had little influence on initial velocity, maximum storage, and final VWC for the peat-based substrate (Fig. 6C). However, increases in α did increase the total leach load for the peat-based substrate. There was also an observed local minima in the α sensitivity curve for total leach load in the peat-based substrate. Total leached load started to increase when α was reduced more than 0.2 times (Fig. 6C). This local minima phenomenon was not observed in the bark-based substrate where total leaching load continued to decrease as α decreased (Fig. 7C). However, maximum storage capacity, which decreased at 0.2 α, increased relative to the original value at 0.9 α (Fig. 7C). These variable effects of α on the four metrics suggest that caution should be deployed when calibrating α for specific scenarios. Hydraulic measurement influences. Information regarding the sensitivity of the parameters was used to optimize the model, by fine tuning the parameters to provide predicted outcomes most similar to the observed data in the hydrated scenarios. Optimizing the curves was an iterative process based on parameter sensitivity analysis that started with reducing ϴs. The final optimized models had values of ϴs that were below or equal to measured CC for the peat-based and bark-based substrate, respectively (Table 2). The optimized storage capacity curve for the peat-based substrate was similar to observed (RMSE = 66.6 cm 3 ; Fig. 8A). The storage capacity curves for the model based on the IP desorption and evaporative hydraulic parameters were similar to each other with ~ 1000 cm 3 ( 25% of the total system volume) greater storage than the observed data (Fig. 8A), resulting from both measurements involving drying data. The increased storage capacity was likely a result of the ϴs value being larger than the optimized 177
209 (approx vs 0.62 cm 3 cm -3 ; Table 2). The hysteretic curve (ϴs = 0.85 cm 3 cm -3 ) also showed an increased maximum storage; however, the model based on hysteresis measurements was still draining at maximum model duration, which can also be observed in the cumulative leaching curve (Fig. 8B). In both the maximum storage and cumulative leaching curves, the sorption curve is the most similar to the observed curves (RMSE = and cm 3, respectively). The sorption curve measures lower ϴs due to trapped air during wetting cycles. Although leaching occurred 75 s earlier in the sorption modeled scenario (Table 3), the maximum storage capacity and total leaching load were within 200 cm 3 or ~5% of the container vol. The IP desorption, IP hysteresis, and evaporative curves were not similar to the observed data for any of the measured metrics (Table 3). When the optimized parameters from the hydrated scenario were applied to the dry scenario for the peat-based substrate, the simulated outcomes were more dissimilar to the observed measures than in the hydrated (RMSE = and cm 3 for the storage and leaching curves, respectively; Table 3). This is likely a result of the greater difference between ϴs and initial VWC, but hydrophobicity of organic materials can also lead to more rapid initial movement (Warren and Bilderback, 2005). However, the optimized model is still more similar to the observed than the IP desorption, IP hysteresis, and evaporative measurements. Again, the IP sorption measurements resemble the observed data for both storage capacity curves (Fig. 9A; RMSE = cm 3 ) and cumulative leaching curves (Fig. 9B; RMSE = cm 3 ). The IP sorption measures resulted in a simulation more aligned with observed data in the dry scenario than were the optimized parameters from the hydrated scenario. The observed data exhibit a gradual sloping towards maximum storage (Fig 9A) resulting from rapid channeling and early leaching. The model was not designed to simulate this channeling, resulting in all pores filling 178
210 with a definite transition from reaching maximum storage to leaching. The IP hysteretic measurements exhibit a slight gradual slope (Fig. 9A). This is hypothesized to result from the hysteretic measurements providing contradicting hydraulic parameters, as it is a combination of the sorption and desorption measures. However, the IP desorption data negatively impacted the hysteretic curve with increased ϴs and does not account for the trapped air. No model resulted in leaching occurring as early as observed (Fig. 9B). The phenomena of observed rapid leaching is a result of the uneven wetting front and channeling of water through the container substrate in situ (Hoskins et al., 2014). This channeling and early leaching resulted in a greater leaching load than the simulations predicted (Fig 9B). The optimized model of the hydrated bark-based substrate fit strongly to three of the four metrics. There was ~40% difference in total leaching load between the optimized curve and the observed data (Table 3). The storage capacity curve for the hydrated bark-based substrate scenario showed strong similarities between observed data and the IP sorption model (RMSE = cm 3 ) just like in the peat-based substrates (Fig. 7B). Conversely, the cumulative leaching volume curve was more similar to the IP desorption and evaporative models than the sorption models (RMSE = 24.6 and 28.5 cm 3, respectively). The observed data reached maximum storage sooner than that in the IP desorption curve, but due to the high initial water velocity through the container, the IP desorption showed the greatest leaching load (Table 3). The bark-based substrate optimized hydraulic model did not provide accurate predictions in the dry scenario (RMSE = and cm 3 for the storage and leaching curves, respectively). The sorption measures predicted the most accurate outcomes, surpassing the optimized model, as with the peat-based scenario (Table 3). The fact that the model predicts more accurate outcomes with the use of the sorption measures leads the authors to believe that 179
211 sorption measures are not affected by the phenomena of virtual pores to the same degree as the other measurement methods. Virtual pores exist when water drains out of a larger pore when exposed to lower tensions as a result of water flow out of the pores being restricted by surrounding smaller diameter pores (Hunt et al., 2013). The sorption measures likely bypass these pores altogether, resulting in the lower ϴs measures. This also leads authors to surmise that sorption measures should be used more prevalent when simulating dry organic based substrates. The predictions based on evaporative and hysteretic measurements had not reached steady state at the culmination of models duration, overestimating the ability of the bark-based substrate to store water, thus increasing the timing required to reach steady state conditions after infiltration ceases. Recent research has shown that HYDRUS-1D models provide accurate predictions for perlite based substrates in ebb and flow measurements when hysteretic measurements are used to fit hydraulic parameters (Anlauf et al., 2016). The use of perlite in that work, likely would reduce hysteretic effects similarly to the bark-based substrate in this work. However, that work was done over a production season duration and on a larger scale (multiple containers). With the precision scale used in the research herein (i.e. on single container over a single irrigation event) we encounter a different outcome. The continued irrigation and drying likely reduced the precision of the simulation. Furthermore, the ebb and flow system used by Anlauf et al. (2016) would experience less trapped air (as increased pore volumes become inaccessible in overhead irrigation), which is why we tend to measure hydraulic properties by saturating from below (Fonteno and Bilderback, 1993). This leads the authors to further believe that scale of simulation and irrigation method can have a major impact on accuracy of predictions. 180
212 Conclusions The goal of this research was to determine if the HYDRUS computational model could be utilized as a tool for soilless substrate research. We determined that HYDRUS computational models were most sensitive to ϴs when compared to α and K s only which had less influence on predicted outcomes. The reduced ϴs parameters needed to optimize the model suggest that the difference in measured versus optimized ϴs is likely indicative of the inaccessible pore volume. The IP desorption measurements were comparable to the evaporative measures over the water potential range measured by both methods. However, measuring sorption could provide results more likely to be encountered in situ through production cycle, which repeatedly undergoes both wetting and drying cycles. Therefore, we hypothesize that sorption curves alone can predict real world scenarios more accurately versus hysteretic curves or conventionally utilized desorption. Measures of substrate hysteresis (desorption and sorption) tend to overestimate water flux after prolonged periods without water infiltration, predicting longer times until steady state conditions are reached. In close, to provide the most accurate predictions, model optimization is essential for all initial conditions and production practices; however, sorption measures provide reasonable predictions. Utilizing model parameters that provide predictions comparable to observed outcomes in hydrated scenarios does not provide predictions of dry scenarios to the same degree of accuracy. Further research is needed to determine influence of other parameters and how to adjust hydraulic parameters to fit multiple scenarios with reasonable accuracy. 181
213 Literature Cited Allaire, S., J. Caron, and J. Gillichand Measuring saturated hydraulic conductivity of peat substrates in nursery containers. Can. J. Soil Sci. 74: Altland, J.E., J.S. Owen, Jr., and M.Z. Gabriel Influence of pumice and plant roots on substrate physical properties over time. HortTechnology 21: Anlauf, R., P. Rehrmann, and H. Scharat Simulation of water and air distribution in growing media. J. Hort. For. 4: Anlauf, R., P Rehrmann, and A. Bettin Reduction of evaporation from plant containers with cover layers of pine bark mulch. Eur. J. Hort. Sci. 81: Barrett, G.E., P.D. Alexander, J.S. Robinson, and N.C. Bragg Achieving environmentally sustainable growing media for soilless plant cultivation systems - A review. Scientia Horticulturae 212: Bernardini A.C., Q.C.A. Carmello, A.S. Carvalho, C.E. Machado, C.L. Medina, M.A.M. Gomes, and D.M. Lima Nitrogen, phosphorus and potassium fertilization interactions on the photosynthesis of containerized citrus nursery trees. J. Plant Nut. 38: Bilderback, T.E Container Soils and Soilless Media. In V.P. Bonaminio (ed.) North Carolina Nursery Crop Production Manual. N.C. Agr. Ext. Ser. NCPM 9. p1-12. Bilderback, T., C. Boyer, M. Chappell, G. Fain, D. Fare, C. Gilliam, B.E. Jackson, J. Lea-Cox, A.V. LeBude, A. Niemiera, J. Owen, J. Ruter, K. Tilt, S. Warren, S. White, T. Whitewell, R. Wright, and T. Yeager Best management practices: Guide for producing nursery crops. Southern Nursery Association, Inc., Acworth, GA. 182
214 Boudreau, J., J. Caron, D. Elrick, J. Fortin, and J. Gallichand Solute transport in subirrigated peat-based growing media, Canadian Journal of Soil Science, 89: Bradford K.J., T.C. Hsiao, and S.F. Yang Inhibition of ethylene synthesis in tomato plants subjected to anaerobic root stress. Plant Physiol Cannavo, P., H. Hafdhi, and J.C. Michel Impact of root growth on physical properties of peat substrate under a constant water regimen. HortScience. 46: Carlile, W.R., C. Cattivello, and P. Zaccheo Organic growing media: constituents and properties. Vadose Zone J. 14: Caron, J. and L. Rochefort Use of peat in a growing media: state of the art on industrial and scientific efforts envisioning sustainability. Acta Hort. 982: Caron, J., S. Pepin, and Y. Periard Physics of growing media in a green future. Acta Hort. 1034: Caron, J., R. Heinse, and S. Charpentier. 2015a. Organic materials used in agriculture, horticulture, reconstructed soils, and filtering applications. Vadose Zone J. 14: Caron, J. J.S. Price, and L Rochefort. 2015b. Physical properties of organic soil: adapting mineral soil concepts to horticultural growing media and histosol characterization. Vadose Zone J. 14: Charpentier, S Simulation of water regime and sensible heat exchange phenomena in green roof substrates. Vadose Zone J. 14: Drzal, M.S., W.C. Fonteno, and K.C. Cassel Pore fraction analysis: a new tool for substrate testing. Acta Hort. 481:
215 Fields, J.S., W.C. Fonteno, B.E. Jackson, J.L. Heitman, and J.S. Owen, Jr Hydrophysical properties, moisture retention, and drainage profiles, of wood and traditional components for greenhouse substrates. HortScience. 49: Fields, J.S., J.S. Owen, Jr., L. Zhang, and W.C. Fonteno The use of the evaporative method for determination of soilless substrate moisture characteristic curves. Scientia Horticulturae 211: Fields, J.S. J.S. Owen, Jr., R.D. Stewart, and J.L. Heitman Utilizing the HYDRUS Model as a Tool for Understanding Soilless Substrate Water Dynamics. Acta Hort. (in press) Fonteno, W.C Problems and considerations in determining the physical properties of horticultural substrates. Acta Hort. 342: Fonteno, W.C. and T.E. Bilderback Impact of hydrogel on physical properties of coarsestructured horticultural substrates. J. Amer. Soc. Hort. Sci. 118: Fonteno, W.C. and Harden, C.T North Carolina State University Horticultural Substrates Lab Manual. North Carolina State University. Fulcher, A., A.V. LeBude, J.S. Owen, Jr., S.A. White, and R.C. Beeson The next ten years: strategic vision of water resources for nursery producers. HortTechnology 26: Gillman, E.F., C. Harchick, and M. Paz Effect of tree size, root pruning, and production method on establishment of Quercus virginiana. Arboriculture and Urban Forestry. 36: Gordon, L.J., C.M. Finlayson, and M. Falkenmark Managing water in agriculture for food production and other ecosystem services. Agr. Water Mgmt. 97:
216 Hoskins, T.C., J.S. Owen, Jr., A.X. Niemiera Water movement through a pine-bark substrate during irrigation. HortScience. 49: Hunt, A.G., R.P. Ewing, and R. Horton What s wrong with soil physics? Soil Sci. Soc. Amer. J. 77: Kerloch, E. and J.C. Michel Pore tortuosity and wettability as main characteristics of evolution of hydraulic properties of organic growing media during cultivation. Vadose Zone J. 14: Knox, G.W. and M. Chappell Alternatives to petroleum-based containers for the nursery industry. Fl. Coop. Ext. Serv. ENH1193. Kuisma, E., P. Palonen, and M. Yli-Halla Reed canary grass straw as a substrate in soilless cultivation of strawberry. Scientia Horticulturae. 178: Mathers, H.M., Yeager, T.H., and Case, L.T Improving irrigation water use in container nurseries. HortTechnology 15:8-12. Michel, J.C., R. Naasz, S. Charpentier, P. Morel, L.M. Riviere, and J. Caron Water repellency of organic growing media and its consequences on their hydraulic properties. Acta Hort. 779: Mininni, C., P. Santamaria, H.M. Abdelrahman, C. Cocozza, T. Miano, F. Montesano, and A. Parente Posidonia-based compost as peat substitute for lettuce transplant production. HortScience. 47: Mualem, Y A new model for predicting hydraulic conductivity of unsaturated porous media. Water Resource Res. 12: Naasz, R, J.C., Michel, and S. Charpentier Measuring hysteretic hydraulic properties of peat and pine bark using a transient method. Soil Sci. Soc. Amer. 69:
217 Naasz, R., J.C. Michel, and S. Charpentier Modelling oxygen and water flows in peat substrates with root uptakes. ISHS-IPS, International Symposium on Growing media, September , Angers, France. Acta Hort. 779: Nkongolo, N.V. and J. Caron Bard particle sizes and the modification of the physical properties of peat substrates. Can. J. Soil Sci. 79: Otten, W., P.A.C. Raats, H. Challa, and P. Kabat Spatial and temporal dynamics of the root environment of potted plants on a flooded bench fertigation system. Neth. J. Agr. Sci. 47: Porebska, D., Slawinski, C., Lamorski, K., and Walczak, R.T Relationship between van Genuchten s parameters of the retention curve equation and physical properties of the soil solid phase. Int. Agrophysics. 20: Raviv, M., R. Wallach, A. Silber, S. Medina, and A. Krasnovsky The effect of hydraulic characteristics of volcanic materials on yield of roses grown in soilless culture. J. Amer. Hort. Sci. 124: Raviv, M. and J.H. Lieth Soilless Culture Theory and Practice. San Diego: Elsevier. Raviv, M SWOT analysis of the use of composts as growing media constituents. Acta Hort. 1013: Regan, R Evaluating alternative growing media components. USDA For. Ser. Proc. 72: Richards, L.A Capillary conduction of liquids through porous mediums. Physics 1:
218 Tsuneda, A., N.M. Thormann, and R.S. Currah Modes of cell wall degradation of Sphagnum fuscum by Acremonium cf curvulum and Oidiodendron maius. Can. J. Bot. 79: van Genuchten, M.T A closed-form equation for predicting the hydraulic conductivity of unsaturated soils. Soil Sci. Soc. Amer. J. 44: Warren, S.L. and T.E. Bilderback More plant per gallon: getting more out of your water. HortTech. 15: Wever, G., J.S. Nowak, O.M. de Sousa Oliveira, and A. van Winkel Determination of hydraulic conductivity in growing media. Acta Hort. 648,
219 Figure Captions. Figure 1. Representation of the mass balance system designed to measure water flux through a container. Funnel was fit into bucket lid and provided level fit for 3.9 L container. Lysimeters measured water flux in the system (storage) and drainage (leaching). Figure 2. Digital representation of the upper and lower surface layers of the finite element mesh, used to construct the container. Boundary conditions are represented by colored nodes (white is no flux, green is atmospheric, and brown is seepage face). Each lateral line is a cross section of nodes. The atmospheric boundary condition represents the area where water infiltrates the bulk substrate system and was measured via in situ spray stake pattern. Figure 3. Substrate moisture tension data for A) a 3:1 (by vol.) peat: perlite substrate and B) a 9:1 (by vol.) bark: sand substrate. These data were measured utilizing an instantaneous profile method to measure both desorption and sorption data in a 3.9 L container. Solid circles represent measures of desorption (drying) cycles and empty circles represent measures of sorption (wetting) cycles. Figure 4. Evaporative measures of moisture tension data for a 3:1 (by vol.) peat: perlite substrate and a 9:1 (by vol.) bark: sand substrate. 188
220 Figure 5. Data representing substrate hydraulic conductivity as a function of substrate water potential for A) 3:1 (by vol.) peat: perlite substrate and B) a 9:1 (by vol.) bark: sand substrate. Data were measured using an instantaneous profile method with both desorption and sorption measured separately in a 3.9 L container. Filled circles represent desorption (drying) measures, while empty circles represent sorption (wetting) measures. Figure 6. Sensitivity curves for A) saturated volumetric water content, B) saturated hydraulic conductivity, and C) α parameters utilized in a simulation of water flux through a 3:1 (by vol.) Sphagnum peat: perlite substrate, modeled with HYDRUS 3D in a 3.9 L container with maximum substrate hydration initial conditions. Figure 7. Sensitivity curves for A) saturated volumetric water content, B) saturated hydraulic conductivity, and C) α parameters utilized in a simulation of water flux through a 9:1 (by vol.) stabilized pine bark: sand substrate, modeled with HYDRUS 3D in a 3.9 L container with maximum substrate hydration initial conditions. Figure 8. A) storage and B) cumulative leaching curves for a 3:1 (by vol.) Sphagnum peat: perlite substrate, modeled with HYDRUS 3D in a 3.9 L container with maximum substrate hydration initial conditions. Curves represent either simulations based on hydraulic parameter measuring methods, in situ observed data, or parameters utilized to optimize models. 189
221 Figure 9. A) storage and B) cumulative leaching curves for a 3:1 (by vol.) Sphagnum peat: perlite substrate, modeled with HYDRUS 3D in a 3.9 L container with initial conditions equal to a pressure head of -100 cm. Curves represent either simulations based on hydraulic parameter measuring methods, in situ observed data, or parameters utilized to optimize models. Figure 10. A) storage and B) cumulative leaching curves for a 9:1 (by vol.) stabilized pine bark: sand substrate, modeled with HYDRUS 3D in a 3.9 L container with maximum substrate hydration initial conditions. Curves represent either simulations based on hydraulic parameter measuring methods, in situ observed data, or parameters utilized to optimize models. Figure 11. A) storage and B) cumulative leaching curves for a 9:1 (by vol.) stabilized pine bark: sand substrate, modeled with HYDRUS 3D in a 3.9 L container with initial conditions equal to a pressure head of -100 cm. Curves represent either simulations based on hydraulic parameter measuring methods, in situ observed data, or parameters utilized to optimize models. 190
222 Tables. Table 1. Substrate physical properties and particle texture analysis for a 3:1 Sphagnum peat: perlite substrate (by vol.) and a 9:1 bark: sand substrate (by vol.). Substrate Air space (cm 3 cm -3 ) Physical properties Container capacity (cm 3 cm -3 ) Total porosity (cm 3 cm -3 ) Bulk density (g cm -3 ) Particle texture analysis Medium b (percent volume) Coarse a (percent volume) Fine c (percen t volume ) Peat: perlite Bark: sand Pval < < < a Particle diameter > 2 mm b Particle diameter between 2 mm and 0.7 mm c Particle diameter < 0.7 mm Table 2. Hydraulic parameters for data measured via evaporative and instantaneous profile methods fit to van Genuchten (1985) and Mualem (1976) models used in the HYDRUS models. Also, hydraulic parameters for optimized models based on in situ observations included. ϴr a b ϴ Curve S c n d e K s f (m 3 m -3 ) (m 3 m -3 ) (cm -1 ) (cm/sec) Sphagnum peatmoss: perlite (3:1 by vol.) Evaporative IP desorption 3.68x IP sorption IP hysteresis 2.19x Optimized NA Pine bark: sand (9:1 by vol) Evaporative IP desorption 6.11x IP sorption IP hysteresis Optimized NA a Volumetric water content when additional tension does not reduce water content b Saturated volumetric water content c Curve fitting parameter associated with inverse of air entry point d Curve fitting parameter associated with pore distribution (curve shape) e Saturated hydraulic conductivity f Curve fitting parameter associated with tortuosity (unaltered in this research) g Goodness of fit measure for the tension data to the van Genuchten model R 2g 191
223 Table 3. Metrics used for determining accuracy of predictive simulations of peat- and bark-based substrates based on varying substrate hydraulic property measurement methodology. Both substrates were modeled maximum water holding and at volumetric water contents equal to water potentials of -100 hpa. Observed in situ measurements as well as hydraulic parameters used to optimize hydrated scenarios included. Hydraulic measurement method Time until leaching (s) Maximum storage capacity (cm 3 H 2 O) Total leaching load (cm 3 H 2 O) Final VWC a (m 3 m -3 ) Irrigation duration (s) Peat: perlite (3:1) at cm 3 cm -3 initial moisture content Storage function RMSE b (cm 3 ) Leach Load RMSE (cm 3 ) Observed Optimized Evaporative IP desorption IP sorption IP hysteresis Peat: perlite (3:1) at cm 3 cm -3 initial moisture content Observed Optimized Evaporative IP desorption IP sorption IP hysteresis Pine bark: sand (9:1) at cm 3 cm -3 initial moisture content Observed Optimized Evaporative IP desorption IP sorption IP hysteresis Pine bark: sand (9:1) at cm 3 cm -3 initial moisture content Observed Optimized Evaporative IP desorption IP sorption IP hysteresis a Volumetric water content b Root mean square error 192


224 Figures. Figure 1. Figure
225 Figure
226 Figure
227 Figure

228 Figure

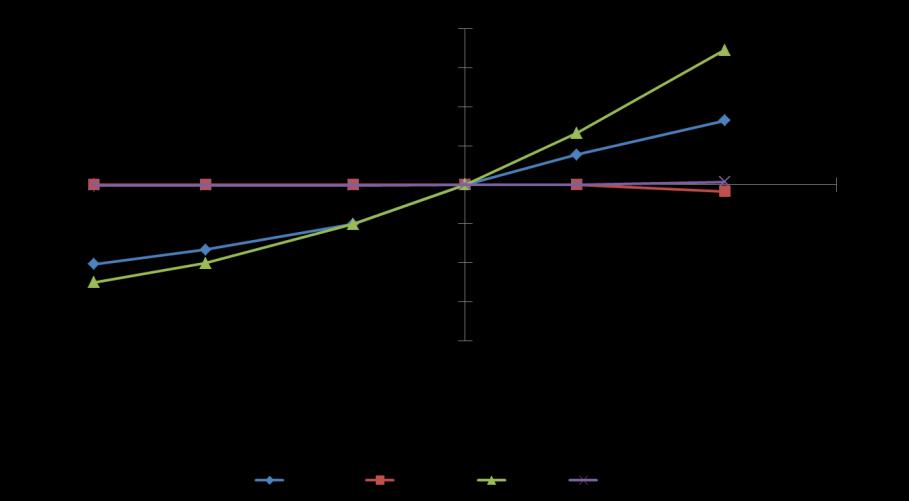
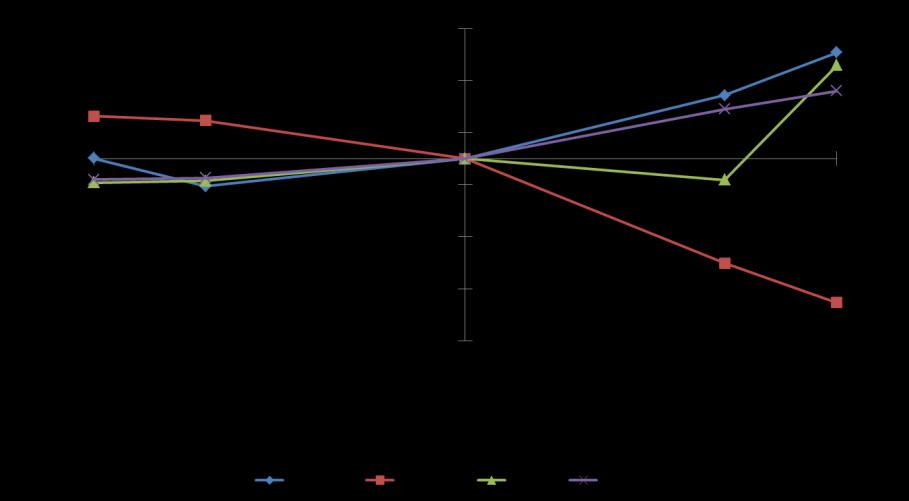
229 Figure