WHITE PAPER NO. 3 LIFECYCLE ENVIRONMENTAL COMPARISON: VIRGIN PAPER AND RECYCLED PAPER-BASED SYSTEMS
|
|
|
- Joseph Freeman
- 5 years ago
- Views:
Transcription
1 PAPER TASK FORCE Duke University ** Environmental Defense Fund Johnson & Johnson ** McDonald's The Prudential Insurance Company of America ** Time Inc. WHITE PAPER NO. 3 LIFECYCLE ENVIRONMENTAL COMPARISON: VIRGIN PAPER AND RECYCLED PAPER-BASED SYSTEMS Originally Published on December 19, 1995 Data in Sections II and IV and Appendices C and D Updated in February 2002
2 1995, 2002 Environmental Defense ii
3 TABLE OF CONTENTS I. Introduction...1 A. Major Topics...2 B. Systems To Be Compared...2 C. Scope of the Comparison Boundaries of the Systems To Be Compared Paper Grades Examined Mixed-materials Management vs. Used Paper Management Use of "Average" Values to Characterize Activities and Facilities Differential Access to Recovery and Waste Management Options...7 II. Findings...8 A. Solid Waste [Section IV.A] Comparison of Recycled Production plus Recycling to Virgin Production plus Landfilling and Virgin Production plus Incineration Comparison of Recycled Production plus Recycling to the Virgin Production plus Composite Waste Management System...10 B. Total, Purchased and Fossil Fuel-Derived Energy Use [Section IV.B] Comparison of Recycled Production plus Recycling to Virgin Production plus Landfilling and Virgin Production plus Incineration Comparison of Recycled Production plus Recycling to the Virgin Production plus Composite Waste Management System...12 C. Air Emissions and Waterborne Wastes [Section IV.C] Air Emissions...13 a) Comparison of Recycled Production plus Recycling to Virgin Production plus Landfilling and Virgin Production plus Incineration b) Comparison of Recycled Production plus Recycling to the Virgin Production plus Composite Waste Management System c) Comparison of Recycled and Virgin Manufacturing Processes Waterborne Wastes...15 a) Comparison of Recycled Production plus Recycling to Virgin Production plus Landfilling and Virgin Production plus Incineration b) Comparison of Recycled Production plus Recycling to the Virgin Production plus Composite Waste Management System c) Comparison of Recycled and Virgin Manufacturing Processes D. Wood Use [Section IV.D]...16 III. Description of Activities and Types of Environmental Impacts Associated with Recovery and Waste Management Options...27 A. Activities and Types of Impacts Common to All Options Waste/Material Collection and Transport Processing and Handling Other Types of Impacts...28 B. Activities and Types of Impacts Specific to Each Option Landfilling Paper in Landfills Incineration Paper in Incinerators Recycling of Recovered Paper...42 IV. Presentation of Comparative Data...45 A. Solid Waste Output Activities Within the Waste Management and Material Recovery Systems Activities Involved in Fiber Acquisition and Manufacturing Results...50 iii
4 a) Comparison of Recycled Production plus Recycling to Virgin Production plus Landfilling and Virgin Production plus Incineration b) Comparison of Recycled Production plus Recycling to the Virgin Production plus Composite Waste Management System B. Energy Use Activities Within the Waste Management and Material Recovery Systems Activities Involved in Fiber Acquisition and Manufacturing Results...62 a) Comparison of Recycled Production plus Recycling to Virgin Production plus Landfilling and Virgin Production plus Incineration b) Comparison of Recycled Production plus Recycling to the Virgin Production plus Composite Waste Management System Other Studies...74 C. Air Emissions and Waterborne Wastes Activities Within the Waste Management and Material Recovery Systems Activities Involved in Fiber Acquisition and Manufacturing Results Concerning Air Emissions...83 a) Comparison of Recycled Production plus Recycling to Virgin Production plus Landfilling and Virgin Production plus Incineration b) Comparison of Recycled Production plus Recycling to the Virgin Production plus Composite Waste Management System (Figures 5X-9X) c) Comparison of the Recycled and Virgin Manufacturing Processes Results for Waterborne Wastes a) Comparison of Recycled Production plus Recycling to Virgin Production plus Landfilling and Virgin Production plus Incineration b) Comparison of Recycled Production plus Recycling to the Virgin Production plus Composite Waste Management System (Figures 10X-14X) c) Comparison of the Recycled and Virgin Manufacturing Processes Other Studies D. Wood Use Factors Associated with Virgin Fiber Acquisition and Manufacturing that Determine Wood Use Results Comparing the Recycled and Virgin Fiber Acquisition and Manufacturing Processes Appendix A: Panels and Issue and White Paper 3 Reviewers; List of All PTF White Papers Appendix B: Ratios of Energy, Ash, Sulfur, Chlorine, Nitrogen and Carbon Content of Various Grades of Paper to Municipal Solid Waste Appendix C: Solid Waste, Energy, Air Emissions, Waterborne Wastes and Water Use Associated with Component Activities Of Three Methods For Producing and Managing Paper Appendix D: Comparison of Environmental Data Across All Grades iv
5 List of Tables and Figures Tables 1. Landfill Leachate Composition 2. Concentrations of Gaseous Components from MSW Landfills 3. Contribution of Paper and Paperboard to MSW Discards, by Weight and Volume, Primary and Environmentally Significant By-Products of MSW Incineration 5. Inherent Energy Content of Various Paper Grades and Other Selected Components of MSW in Comparison to Fossil Fuels 6. Comparison of Estimates Derived from the Analysis in this Paper and Several Other Recent Studies of Total Energy Use for Three Discarded Paper Management Options 7. Comparative Data on Air Emissions from Facilities Managing MSW and from Collection of MSW and Recyclables, and Allocation of Air Emissions to the Paper Fraction of MSW and Recyclables Appendices B-1. Ash Content B-2. Energy Content B-3. Elemental Contents C-1. Solid Waste Output from Recycled and Virgin Fiber-Based Systems Used to Manage and Produce Various Grades of Paper C-2. Total and Purchased Energy Use for Recycled and Virgin Fiber-Based Systems Used to Manage and Produce Various Grades of Paper C-3. Air Emissions from Recycled and Virgin Fiber-Based Systems Used to Manage and Produce Various Grades of Paper C-4. Waterborne Wastes from Recycled and Virgin Fiber-Based Systems Used to Manage and Produce Various Grades of Paper Figures Findings S1. NEWSPRINT: Average Lifecycle Energy Use and Environmental Releases S2. CORRUGATED: Average Lifecycle Energy Use and Environmental Releases S3. OFFICE PAPER: Average Lifecycle Energy Use and Environmental Releases S4. CUK PAPERBOARD: Average Lifecycle Energy Use and Environmental Releases S5. SBS PAPERBOARD: Average Lifecycle Energy Use and Environmental Releases S6. NEWSPRINT: Average Lifecycle Energy Use and Environmental Releases S7. CORRUGATED: Average Lifecycle Energy Use and Environmental Releases S8. OFFICE PAPER: Average Lifecycle Energy Use and Environmental Releases S9. CUK PAPERBOARD: Average Lifecycle Energy Use and Environmental Releases S10. SBS PAPERBOARD: Average Lifecycle Energy Use and Environmental Releases v
6 Body of Paper 1. Solid Waste Outputs from Individual Production and Management Activities a. Newsprint b. Corrugated c. Office Paper d. CUK Paperboard e. SBS Paperboard 2. Solid Waste Output for Paper Production and Management 2X. Solid Waste Output for Paper Production and Management 3. Total, Purchased and Fossil Fuel Energy Use from Individual Production and Management Activities a. Newsprint b. Corrugated c. Office Paper d. CUK Paperboard e. SBS Paperboard 4. Energy Use for Paper Production and Management 4X. Energy Use for Paper Production and Management 5. NEWSPRINT: Air Emissions from Production and Management 6. CORRUGATED: Air Emissions from Production and Management 7. OFFICE PAPER: Air Emissions from Production and Management 8. CUK PAPERBOARD: Air Emissions from Production and Management 9. SBS PAPERBOARD: Air Emissions from Production and Management 6X. CORRUGATED: Air Emissions from Production and Management 7X. OFFICE PAPER: Air Emissions from Production and Management 8X. CUK PAPERBOARD: Air Emissions from Production and Management 9X. SBS PAPERBOARD: Air Emissions from Production and Management 10. NEWSPRINT: Waterborne Wastes from Production and Management 11. CORRUGATED: Waterborne Wastes from Production and Management 12. OFFICE PAPER: Waterborne Wastes from Production and Management 13. CUK PAPERBOARD: Waterborne Wastes from Production and Management 14. SBS PAPERBOARD: Waterborne Wastes from Production and Management 10X. NEWSPRINT: Waterborne Waste from Production and Management 11X. CORRUGATED: Waterborne Wastes from Production and Management 12X. OFFICE PAPER: Waterborne Wastes from Production and Management 13X. CUK PAPERBOARD: Waterborne Wastes from Production and Management 14X. SBS PAPERBOARD: Waterborne Wastes from Production and Management 15. Relative Use of Wood in the Form of Trees to Make Pulp and Paper Appendices C-1. Solid Waste Output from Individual Production and Management Activities a. Newsprint b. Corrugated c. Office Paper vi
7 d. CUK Paperboard e. SBS Paperboard C-2. Total, Purchase and Fossil Fuel Energy Use for Individual Production and Management Activities a. Newsprint b. Corrugated c. Office Paper d. CUK Paperboard e. SBS Paperboard D-1. Average Solid Waste Output from Recycled and Virgin Fiber-Based Systems Used to Manage and Produce Various Grades of Paper (pounds per ton) D-2. Average Energy Use for Recycled and Virgin Fiber-Based Systems Used to Manage and Produce Various Grades of Paper (million Btus per ton) D-3. Average Greenhouse Gas Emissions from Recycled and Virgin Fiber-Based Systems Used to Manage and Produce Various Grades of Paper (pounds per ton) D-4. Average Nitrogen Oxide Emissions from Recycled and Virgin Fiber-Based Systems Used to Manage and Produce Various Grades of Paper (pounds per ton) D-5. Average Sulfur Oxide Emissions from Recycled and Virgin Fiber- Based Systems Used to Manage and Produce Various Grades of Paper (pounds per ton) D-6. Average Particulate Emissions from Recycled and Virgin Fiber-Based Systems Used to Manage and Produce Various Grades of Paper (pounds per ton) D-7. Average Hazardous Air Pollutant (HAP) Emissions from Recycled and Virgin Fiber- Based Manufacturing of Various Grades of Paper (pounds per ton) D-8. Average Volatile Organic Chemical (VOC) Emissions from Recycled and Virgin Fiber- Based Manufacturing of Various Grades of Paper (pounds per ton) D-9. Average Total Reduced Sulfur (TRS) Emissions from Recycled and Virgin Fiber-Based Manufacturing of Various Grades of Paper (pounds per ton) D-10. Average Biochemical Oxygen Demand (BOD) Releases from Recycled and Virgin Fiber- Based Systems Used to Manage and Produce Various Grades of Paper (pounds per ton) D-11. Average Chemical Oxygen Demand (COD) Released from Recycled and Virgin Fiber- Based Systems Used to Manage and Produce Various Grades of Paper (pounds per ton) D-12. Average Suspended Solids Releases from Recycled and Virgin Fiber-Based Systems Used to Manage and Produce Various Grades of Paper (pounds per ton) D-13. Average Effluent Flow from Recycled and Virgin Fiber-Based Manufacturing of Various Grades of Paper (thousand gallons per ton) vii
8 I. Introduction This paper summarizes the research and findings of the Paper Task Force on the environmental impacts associated with paper recycling in comparison with managing paper through the major means of solid waste management. This paper is one element of an extensive research process in support of the task force's work to develop recommendations for purchasing "environmentally preferable paper" (paper that reduces environmental impacts while meeting business needs). The findings in this paper are based on the task force's own research and members' experience, a review of published articles and papers on environmental comparisons of recycling and solid waste management and information gathered from task force technical visits, presentations to the task force by experts, and other interviews with experts. As an additional step in the research process, on August 10, 1994, the task force assembled a panel of experts from several sectors to discuss environmental impacts associated with recycling in comparison with solid waste management. Panelists discussed an issue paper that had been prepared by the Task Force, which laid out the relevant environmental issues surrounding recycling and waste management methods, as well as the range of perspectives and opinion on those issues held by various stakeholders. The issue paper was also reviewed by several other outside experts. The panelists' and reviewers' comments on the issue paper were considered in drafting this White Paper, which was also reviewed by a range of experts. (Panelists and issue and white paper reviewers are listed in Appendix A). The Paper Task Force members endorse the broad principles set forth by the Task Force s final report. The findings and research in this White Paper reflect the contribution of Paper Task Force Working Groups and changes made in response to comments received from expert reviewers through the White Paper review process. The contents of this paper do not reflect the policy of individual Task Force member organizations. This paper addresses only environmental parameters relevant to a comparison of paper recycling and waste management options. However, the task force's recommendations integrate findings on environmental, economic and functional aspects of paper use in a balanced manner that reflects the needs of users of paper in the private sector. This paper does not contain purchasing recommendations. Other White Papers address the following related topics: White Papers Nos. 10A, B and C: environmental comparison of recycled and virgin pulp and paper manufacturing processes, for various grades of paper; White Paper No. 2: economic comparison of recycling and solid waste management; and White Papers Nos. 1, 6A, 6B and 8: functional issues associated with the use of recovered fiber in various paper grades. A list of all of the Task Force s White Papers is included in Appendix A. 1
9 A. Major Topics In support of the Paper Task Force's findings on environmental issues associated with recycling and solid waste management, this paper develops two basic topics: basic descriptions of activities and associated environmental impacts involved in managing municipal solid waste (MSW), and the used paper fraction of MSW, by landfilling, incineration (with energy recovery), and recycling (Section III); and a detailed presentation and comparison of data from the Task Force s own research as well as several recent studies that allow a "lifecycle" comparison of these management options for four types of paper -- newsprint, corrugated containers, office paper and paperboard -- across a number of environmental parameters: solid waste output, energy use, release of air emissions and waterborne wastes, and water use/wastewater quantity (Section IV). B. Systems To Be Compared The three primary methods of managing MSW, as applied to used paper, a will be the focus of this comparison: landfilling, incineration (with energy recovery), and recycling. These three management methods account for the overwhelming majority of both MSW and used paper management in the U.S. today. Two recent reports that have quantified used paper management support this statement. Franklin Associates estimates that, of nearly 78 million tons of paper used in 1993, about 34% was recovered for recycling, reuse or export, another 53% was landfilled, and about 13% was burned in incinerators. 1 Of 87 million tons of paper produced in the same year, the American Forest & Paper Association (AF&PA) estimates that 38% was recovered for recycling, reuse, or export, another 40% was landfilled, and virtually all of the remaining amount was incinerated. 2 Both studies' estimates of paper recovery include about 6 million tons, 8% of total used paper, that were exported. Much smaller amounts of used paper are subject to other management methods. Much less than 1% of MSW (less than 0.7 million tons annually) is now managed in MSW composting facilities, accounting for an even smaller amount of used paper. 3 Use of source-separated or facility-segregated paper as fuel in devices other than incinerators (primarily industrial or utility boilers) has been discussed as another option, but presently accounts for less than 0.5 million tons of used paper. 4 Due to the small amount of used paper managed by these means and the sparsity of data on their environmental impacts, further discussion of them is beyond the scope of this paper. a The term "used paper" will be used throughout this White Paper to denote paper and paperboard products that have served their intended purpose to consumers, independent of how the material will be managed subsequently. This term is intended to be more generic than the term "recovered paper," used often to refer to those used paper and paperboard products collected for purposes of recycling, and less pejorative than the term "waste paper," which is often used to refer to paper and paperboard products destined for landfills or incinerators. 2
10 C. Scope of the Comparison 1. Boundaries of the Systems To Be Compared To provide a consistent basis for comparison of recycling and waste management methods, we will begin our analysis here with an examination of the recovery and MSW management systems themselves: i.e., we will start with the recovery or discard of potentially recyclable paper-based materials in MSW and follow the materials to the point where they are either: (a) disposed of in a landfill; (b) burned in a MSW incinerator and the resulting ash residue is disposed of in a landfill; or (c) processed and transported back to the site of remanufacture. Such a boundary condition does not provide a complete picture of environmental impacts associated with landfilling, incineration and recycling of paper, however. Indeed, such a limited view has the potential to distort one's view of actual environmental impacts, due to the close interplay between activities occurring within the immediate recovery and MSW management systems and certain activities lying outside those systems. For example, in tallying the amount of solid waste associated with recycling of used paper, we need to account not only for the amount of material diverted from disposal within the MSW management system (less any residuals generated during preparation of the material for remanufacturing), but also the greater amount of sludge that generally results in the manufacturing process from use of recycled fibers relative to use of virgin fibers. Therefore, our quantitative analysis will place the recovery and waste management activities into the context of the full lifecycle of paper by considering the following three alternative complete "systems:" (1) acquisition of virgin fiber, manufacture of virgin paper, followed by landfilling; (2) acquisition of virgin fiber, manufacture of virgin paper, followed by incineration; and (3) manufacture of recycled paper, followed by recycling collection, processing and transport to the site of remanufacture. We will present the broader "system-wide" view that accounts for relevant activities and impacts outside of the recovery and MSW management systems, along with a view restricted to these systems. For each of the three options, the following activities will be included in this White Paper at least qualitatively, and wherever possible, quantitatively: Virgin Production plus Landfilling: harvesting of trees, transporting of logs (or chips) to the mill, debarking and chipping, and manufacture of pulp and paper using virgin fiber; followed by: waste collection and transport; placement in the landfill; generation of leachate, and leachate management, treatment and disposal; generation of landfill gas, and possible recovery and utilization of such gas (energy production); and land use issues. 3
11 Virgin Production plus Incineration: harvesting of trees, transporting of logs (or chips) to the mill, debarking and chipping, and manufacture of pulp and paper using virgin fiber; followed by: waste collection and transport; possible pre-processing at the incinerator (e.g., refusederived fuel vs. mass-burn facilities); the incineration process and management of air emissions; energy generation; ash management (storage, transport) and disposal; and generation of ash leachate, and leachate management, treatment and disposal. Recycled Production plus Recycling: material collection (curbside collection, commingled or source-separated; drop-off or buy-back centers; commercial collection); transport; pre-processing at material recovery facilities (MRFs); residuals management and disposal; and transport of processed recovered material to the remanufacturing site; b followed by: remanufacturing of pulp and paper using recovered fiber. Finally, we will further refine our analysis to compare recycled production plus recycling to a composite of the two virgin systems, based on the relative use of landfilling and incineration in the U.S. at the current time. That is, the composite system -- virgin production plus waste management -- is a weighted average of the virgin production plus landfilling and virgin production plus incineration systems, calculated on the basis of national estimates for the relative use of MSW landfilling (used for 79.7% of discarded paper, after recycling) and MSW waste-to-energy incineration (used for 20.3% of discarded paper, after recycling). 5 This comparison of the recycling-based system to the composite waste managementbased system is ultimately the most useful environmental comparison, for two major reasons. First, in contrast to their ability to assist directly in the recycling of paper they use, users of paper have no ability to determine how their paper is managed after discard if it enters the waste stream. Whether such paper is destined for disposal in a landfill or for processing at an incinerator is a function of many factors outside the control of the paper user: the local availability of the two options, their relative economics, the nature of the collection system, and so on -- all factors that can also change over time. Second, we are most interested in assessing the most typical or representative case associated with management of discarded paper. On average across the nation, about 80% of used paper that is not recycled will be landfilled, and about 20% will be incinerated. Using this 4-to-1 ratio to calculate a weighted average of the b Because of greater availability of data, our quantitative comparison will be based on collection of recovered paper through residential curbside collection programs. We recognize that other types of systems (e.g., drop-off centers and collection from commercial sources) contribute significantly to total paper recovery. As discussed in Section IV below, this assumption of curbside collection probably overstates the energy use and associated environmental impacts associated with collection of paper, especially for grades such as OCC and OWP that are collected largely from commercial sources through more efficient systems. Similarly, our analysis includes processing of recovered paper at material recovery facilities (MRFs). Because much recovered paper, especially that from commercial sources, bypasses such intermediate processing and is delivered directly to the site of remanufacture, this assumption too probably overstates energy use associated with the recycling option. 4
12 landfill- and incinerator-specific data developed in our analysis allows us to estimate the average energy use and environmental releases associated with management of used paper that is not recycled and becomes part of the waste stream. It should be noted that, due to lack of data, our quantitative comparison (presented in Section IV) omits some important activities involved in the virgin fiber-based systems: acquisition of virgin fiber from forests, including energy (and associated wastes) involved in planting, site preparation and stand tending activities, and production, use and disposal of forest chemicals (fertilizers and pesticides); only energy required for tree harvesting, for transport of logs or chips from the forest to the mill, and for debarking and chipping of logs is included, as well as its associated air and water releases and solid waste: releases to the air and water from MSW landfills, except for carbon dioxide and methane emissions; releases to the air from incinerators, except for carbon dioxide, sulfur oxides, nitrogen oxides and particulates; and releases from ash landfills. In contrast, essentially all activities comprising the recovered fiber cycle are included within the scope of our quantitative comparison. c This disparity should be kept in mind when considering the findings of this paper. 2. Paper Grades Examined This White Paper will consider production and management of four types of paper, and with respect to manufacturing will compare processes using 100% of the recovered materials to those using 100% of the most common virgin fiber type, as follows: Paper Grade Recycled Material Virgin Material Newsprint Old newsprint (ONP) Thermomechanical pulp (TMP) Corrugated Old corrugated containers (OCC) Unbleached kraft linerboard and semichemical medium Office Paper Office waste paper (OWP) Uncoated free sheet (UCFS) Paperboard used in folding cartons Recycled paperboard (may include any or all of the above grades) Coated unbleached kraft (CUK) OR Solid bleached sulfate (SBS) c Our analysis does not include releases from disposal facilities for residuals from either the virgin or recycled fiberbased systems. 5
13 We recognize that when these types of paper contain recycled content, it is most often at levels considerably lower than 100%. Using this basis for comparison, however, allows us to assess the relative environmental impacts associated with the acquisition, manufacture, use and postuse management by various means of each type of fiber. Paper in these categories containing intermediate levels of recycled content would fall between the estimates provided in this study for the 100% virgin and 100% recycled products. We also realize that various types of recovered paper or virgin pulp, or combinations of them, are used to manufacture the recycled and virgin grades considered here. We have chosen the most common and straightforward compositions for our analysis. 3. Mixed-materials Management vs. Used Paper Management For many of the recovery and waste management activities listed above, used paper is managed along with other materials, rather than by itself. For example, the various materials that comprise MSW are typically collected and landfilled or incinerated commingled; many (though certainly not all) collection systems for recyclable materials collect paper commingled with other materials. One challenging aspect of the comparison presented here, therefore, is determining when allocation may be appropriate, and if so, how to do it. That is, can and should we allocate to the paper fraction of the recovered material stream or waste stream a share of overall impacts (or benefits) arising from activities that involve management of a mixedcomposition stream? Is it appropriate, for example, to allocate a particular fraction of incinerator air emissions to the paper present in the waste that is incinerated? If so, should the allocation be made on a weight basis? volume basis? chemical composition basis? In this analysis, some impacts can legitimately be assumed to be the same for a given mass of used paper as for the same mass of MSW or commingled recyclables; for example, the fuel consumed by landfill equipment to landfill a ton of used paper mixed in MSW should be essentially the same as that required to landfill a ton of MSW. We will clearly indicate where data do not allow or support this means of allocation, and where data that are specific to paper or to a particular grade of paper are used to derive a paper-specific allocation instead of using data corresponding to management of a mixed-material stream. 4. Use of "Average" Values to Characterize Activities and Facilities For the types of activities and facilities discussed in this paper, their environmental characteristics will virtually always show considerable variation. In general, the data cited and presented in this paper will represent average (mean) values, or estimates intended to be representative of the facilities and activities being characterized, and the comparisons will only be valid for "typical" activities or facilities. These data may therefore overstate or understate the magnitude of a given environmental parameter for a specific activity or facility. In most cases, however, average data are most appropriate for our purposes, because we are interested in comparing typical landfilling, incineration and recycling practices, not "best-case" or "worstcase." Moreover, one generally cannot dictate at precisely which facility, or by precisely what methods, recovered or discarded materials will be managed. 6
14 Where relevant and available, data characterizing the range of values as well as average values will be presented, along with a discussion of the implications of the observed variability for the conclusions drawn based on average values. As a result of increasing regulation of most types of waste management and paper manufacturing facilities, actual releases typically show downward trends over time. Data cited in this paper generally assume that facilities are in compliance with all regulations applicable at the time data are collected. It is important to acknowledge, however, that additional regulations recently have been applied, or are in the process of being applied, to many of the types of facilities being considered in this paper. Due to the time- and site-specific variation in much of the data presented here, which is clearly not captured through the use of average or typical values, considerable caution should be exercised in applying these data to characterize the environmental attributes of particular facilities or activities. While the data presented here are useful in indicating general or likely attributes, they should be subjected to further examination and confirmation if used in a more specific manner or setting than intended. 5. Differential Access to Recovery and Waste Management Options It should be borne in mind that the three options being examined here differ with respect to their regional distribution and, therefore, their availability to a given community: 6 Landfills are virtually ubiquitous in the U.S., with active landfills numbering about 3,560 in 1994 (down from 4,500 in 1993), present in every state, and accounting for 67% of all MSW managed in Recycling programs are also widespread: in 1994, an estimated 7,265 curbside programs, present in every state but Alaska and Hawaii, served 108 million people in the U.S. -- an increase of 31 million since Drop-off and buy-back centers and commercial recycling programs extend this reach even further. In 1994, recycling accounted for management of 23% of the materials that comprise MSW. In contrast, MSW incineration is considerably less widespread. A total of 158 incinerators were operating in 1994, down from a peak of 171 incinerators in These facilities are concentrated in the Northeast, Florida and some Great Lakes states; 16 states lack MSW incinerators entirely. Incineration accounted for about 10% of U.S. MSW management in Landfilling dominates as a waste management method in all regions except New England, where incineration edges it out; in all other regions, incineration is the least used of the three options. Given these factors, in many areas of the country the practical choice is not among all three options, but rather between recycling and landfilling. 7
15 II. Findings This section summarizes key findings of the Paper Task Force's research with respect to an environmental comparison of production of virgin and recycled paper and landfilling, incineration and recycling of used paper, assembled into systems that represent the full lifecycle of paper. These findings are based on the task force's own quantitative analysis, as well as a number of major recently published studies, that allow a direct comparison of the recovery and waste management options coupled with virgin and recycled fiber acquisition and paper manufacture (discussed in Section IV). Findings for four environmental parameters are presented: solid waste output, energy use, air emissions, and waterborne wastes. No attempt is made here to assess the magnitude of actual environmental impacts that arise from the energy use and environmental releases, the quantity of which is reported. Actual impacts depend on site-specific and highly variable factors such as rate and location of releases, local climatic conditions, population densities, and so on, which together determine the level of exposure to substances released to the environment. Such an assessment would require a detailed analysis of all sites where releases occur, well beyond the scope of this paper (and indeed virtually any analysis of this sort). Our comparison here is of necessity limited to a quantitative comparison of data on the magnitude of energy use and environmental releases associated with the recovery and waste management options. It should also be noted that the comparison among the options applies to that fraction of used paper-based materials that could be managed using any of the three options. The findings do not apply to other paper-based materials present in MSW that are not currently recycled to any significant extent and may be difficult or virtually impossible to recycle, at least using current technologies. As alluded to earlier, a full understanding of environmental impacts associated with the various options for managing used paper requires consideration of certain activities occurring outside of the immediate material recovery and MSW management systems themselves. Two types of expansion in our view are needed: (1) Options that generate energy -- namely, incineration at facilities that recover energy, and landfilling at facilities that employ methane recovery systems d -- reduce the amount of energy that would otherwise need to be generated, typically at an electric utility. This reduction, or "credit," offsets all four categories of environmental impacts examined here that are associated d As discussed below, only a small minority of landfills employ methane recovery systems. For this reason, while we will consider and provide data on the potential for energy recovery, our quantitative analysis is based on the more typical landfill that does not recover landfill gas for energy generation. 8
16 with producing an equivalent amount of energy at the utility. Hence, where applicable, the credit not only reduces the option's net energy use, but also its net solid waste output, air emissions and waterborne wastes; this is because the energy generated from paper-based materials by the incinerator (or landfill) displaces some of the solid waste (e.g., coal ash), air emissions and waterborne wastes that would otherwise have arisen from the acquisition (extraction, refining and transport) and consumption of fuels (oil, coal, etc.) by the utility. (2) We need to account for differences in fiber acquisition and manufacturing processes that use virgin fiber versus recovered paper. To do this, we will first assemble the components of three complete systems that account for alternative, full lifecycles of paper: (a) "Virgin production plus landfilling:" acquisition of virgin fiber and manufacture of virgin paper, followed by landfilling; (b) "Virgin production plus incineration:" acquisition of virgin fiber and manufacture of virgin paper, followed by incineration; and (c) "Recycled production plus recycling:" manufacture of recycled paper, followed by recycling collection, processing and transport of used paper to the site of remanufacture. (White Papers 10A, B and C, which present environmental comparisons of virgin vs. recovered pulp and paper manufacturing for various grades of paper, provide the basis for the manufacturing-related data used in this paper; these papers provide full documentation and much more detail on these topics than will be presented here.) To illustrate the effect of including these additional activities, we will discuss findings in two contexts: A "base case," limited to only those activities that lie within the material recovery or MSW management system itself. A "system-wide view" that includes the base case plus: the appropriate credits assigned to those options that generate energy (this expansion amounts to reducing certain electric utility-related impacts); and the impacts associated with acquiring and manufacturing paper with virgin fiber (for landfilling and incineration) and with recycled fiber (for recycling collection, processing and transport). In addition to providing and comparing results for the three options separately, we will also compare the recycling-based option to a composite of the two virgin systems, which allows a side-by-side assessment of recycling- and waste management-based systems. As described previously in Section I.C.1, the virgin production plus waste management composite system is a weighted average of the virgin systems involving landfilling and incineration, based on national estimates for the relative use of the two options for used paper that is not recycled. 9
17 Finally, there are several air and water parameters that we examined only for the recycled and virgin manufacturing processes, due to a lack of data on their release from other component activities that comprise the virgin and recycled lifecycle systems. These parameters include: for air: hazardous air pollutants (HAPs), volatile organic chemicals (VOCs) and, for all grades except newsprint, total reduced sulfur (TRS); and for water: biochemical oxygen demand (BOD), chemical oxygen demand (COD), suspended solids, adsorbable organic halogens (AOX, for office paper and SBS paperboard only) and effluent quantity/water use. Summary charts are presented to graphically illustrate the findings below. One set of charts (Figures S1-S5) illustrates the magnitude of energy use and releases from the three systems separately; the other set (Figures S6-S10) compares the recycling-based system to the composite waste management-based virgin system. Separate charts are included for each grade of paper, with each parameter summed across all of the activities that comprise each system examined. The air and water parameters just noted that were compared only for the recycled and virgin manufacturing processes are also included on each set of charts. For each finding, a crossreference is provided to the appropriate subsection of Section IV, where supporting documentation can be found. A. Solid Waste [Section IV.A] 1. Comparison of Recycled Production plus Recycling to Virgin Production plus Landfilling and Virgin Production plus Incineration Based on our analysis, from a system-wide view, virgin production plus incineration (with energy recovery) of newsprint, corrugated containers, office paper and coated unbleached kraft (CUK) paperboard results in the least solid waste of the three options, slightly less than recycled production plus recycling and considerably less than virgin production plus landfilling. The additional solid waste from recycled production plus recycling relative to virgin production plus incineration represents at most about 10% of the original amount of used paper. For solid bleached sulfate (SBS) paperboard, recycled production plus recycling results in lower solid waste than does virgin production plus incineration. From a more limited view that encompasses only those activities within the material recovery and MSW management systems themselves, recycling and incineration of newsprint and corrugated result in virtually the same amount of solid waste, much less than landfilling, while for office paper and paperboard, recycling results in the least amount of solid waste of the three options and landfilling results in the most. 2. Comparison of Recycled Production plus Recycling to the Virgin Production plus Composite Waste Management System Based on our analysis, for all of the grades of paper examined here, from both the systemwide view and that limited to the material recovery and waste management systems, 10
18 recycled production plus recycling results in substantially less solid waste output than virgin production plus waste management. B. Total, Purchased and Fossil Fuel-Derived Energy Use [Section IV.B] [NOTE: We have examined energy use from several perspectives because of the different sources of energy used by various manufacturing processes and waste management options. Pulp and paper mills use a variety of sources for energy. Virgin chemical pulp mills generate a substantial portion of their energy needs by burning wood residues (e.g., bark) and pulping liquors, thereby reducing their use of fossil fuels. 8 Recycled pulp mills do not generate such fuel sources, and therefore generally must purchase their energy, in the form of fossil fuels or electricity generated largely from fossil fuels (or both). However, such mills also avoid the purchased energy (in the form of fuels) required by virgin mills to grow and harvest trees and transport logs to the mill. The relative amounts of purchased vs. self-generated energy vary with not only recycled vs. virgin pulp, but also with paper grade, the specific mill or company involved, and geographic location. Finally, incineration of used paper produces energy that is not derived from fossil fuels; because it displaces electricity that would otherwise have to be purchased from a utility, it is accounted for here as a "credit" of purchased and fossil fuelderived energy for the virgin production plus incineration option. If one's primary concern is with use of fossil fuels rather than use of energy per se, or it is with impacts associated with growing and harvesting trees, then the type as well as the amount of energy used is important to consider in drawing conclusions about the relative energy "efficiency" of producing and managing a given type of paper. In our analysis, the difference between the amounts of total and purchased energy used by a system represents the amount of energy generated from wood-derived fuels (bark, pulping liquors and used paper). For several of the paper grades we examined, the virgin fiber-based system uses more total, but less purchased, energy than the recycled fiber-based system (see below). Such a system consumes less fossil fuel and hence entails fewer of the environmental impacts associated with such fuel sources; but it also consumes greater wood resources, which has environmental implications with respect to forest management that are discussed elsewhere in the Task Force s work.] 1. Comparison of Recycled Production plus Recycling to Virgin Production plus Landfilling and Virgin Production plus Incineration Based on our analysis, from a system-wide view, recycled production plus recycling of newsprint, corrugated containers, office paper and paperboard uses the least total energy of the three options. Virgin production plus landfilling uses the most total energy. Based on our analysis, from a system-wide view, recycled production plus recycling of newsprint uses the least purchased and fossil fuel-derived energy of the three options, while for the other grades, virgin production plus incineration uses the least purchased and fossil fuel-derived energy. Virgin production plus landfilling of newsprint and SBS paperboard uses the most purchased and fossil fuel-derived energy of the three options, while recycled 11
19 production plus recycling of the other three grades uses the most purchased and fossil fuelderived energy. Because of higher fuel use in collection, the collection and processing associated with recycling uses the most energy, while collection and processing for landfilling uses the least. But the energy used to collect, process and incinerate or landfill paper in MSW, or to collect and process recovered paper, is low compared to the amount of energy generated by incinerating paper or the reduction in manufacturing energy due to using recycled rather than virgin paper. Transportation energy required to ship processed recovered paper to market (i.e., points of remanufacture) is also quite modest, amounting to at most a few percent of manufacturing energy. 2. Comparison of Recycled Production plus Recycling to the Virgin Production plus Composite Waste Management System Based on our analysis, from a system-wide view, recycled production plus recycling requires less total energy than virgin production plus waste management, for all grades of paper examined here. Based on our analysis, from a system-wide view, recycled production plus recycling requires less (for newsprint) or comparable e (for SBS paperboard) purchased energy than virgin production plus waste management. For the other three grades, however, the recycled-based system requires more purchased energy. From the limited view of the material recovery and waste management systems only, recycling uses more total and purchased energy than does waste management. But the energy used to collect, process and dispose of paper in MSW, or to collect, process and transport recovered paper, is low compared to the amount of energy generated by incinerating paper or the reduction in manufacturing energy due to using recycled rather than virgin paper. C. Air Emissions and Waterborne Wastes [Section IV.C] A note of caution: Considerable caution must be exercised in interpreting data on air emissions and waterborne wastes, for several reasons: Data are generally much more scarce and of lesser quality than in the areas of solid waste and energy use. In addition, such data frequently (as is sometimes the case in the analysis in this paper) do not represent actual measured releases, but rather regulatory limits, engineering estimates, or other surrogates for actual values. Particularly where data are only presented or available for a class of chemicals or substances (e.g., suspended solids), different activities may generate releases of a given e Comparable means that the values being compared are within 10% of one another. 12
20 class of substances that differ dramatically in their composition and potential to cause adverse health or environmental impacts. Even where data are available for releases of the same chemical from different activities, such estimates may still not be directly comparable: they do not necessarily serve as a measure of actual environmental impact. Impacts depend not only on how much of a given chemical is released, but also at what rate, by what route (e.g., by a mobile source such as a truck vs. a point source such as an incinerator stack), and where (e.g., in a rural vs. urban setting). The fate of a released substance in the environment -- its rate of degradation, how it is transported, and whether it accumulates in particular environmental "sinks" -- are all important considerations in assessing impact. 1. Air Emissions a) Comparison of Recycled Production plus Recycling to Virgin Production plus Landfilling and Virgin Production plus Incineration [Note: We have categorized greenhouse gas (GHG) emissions into those arising from all sources (carbon dioxide from wood-derived materials, including bark, pulping liquors and paper; carbon dioxide from fossil fuels, and methane from landfills) and those from only fossil fuels or methane. The former is termed total GHGs, while the latter is termed net GHGs; only the latter is reported below.] Newsprint: Based on our analysis, from a system-wide view, recycled production plus recycling produces the lowest emissions of the three options of net GHGs, nitrogen oxides, particulates and sulfur oxides. Virgin production plus landfilling produces the highest emissions in all of these categories, while virgin production plus incineration yields intermediate levels of emissions. Corrugated: Based on our analysis, from a system-wide view, virgin production plus incineration produces the lowest emissions of net GHGs and sulfur oxides. For nitrogen oxides and particulates, the two options produce comparable emissions. Virgin production plus landfilling produces the highest emissions in all of these categories except sulfur oxides, where its emissions are comparable to those from recycled production plus recycling. Office Paper: Based on our analysis, from a system-wide view, recycled production plus recycling produces the lowest emissions of nitrogen oxides and particulates, while virgin production plus incineration produces the lowest emissions of net GHGs and sulfur oxides. 13
21 Virgin production plus landfilling produces the highest emissions in all of these categories. CUK Paperboard: Based on our analysis, virgin production plus incineration produces the lowest emissions of net GHGs and sulfur oxides. For nitrogen oxides and particulates, the emissions of the two options are comparable. Virgin production plus landfilling produces the highest emissions in all of these categories except sulfur oxides, where it is comparable to recycled production plus recycling. SBS Paperboard: Based on our analysis, from a system-wide view, recycled production plus recycling produces the lowest emissions of nitrogen oxides and particulates. For net GHGs, virgin production plus incineration produces the lowest emissions, while for sulfur oxides the two options produce comparable emissions. Virgin production plus landfilling produces the highest emissions in all of these categories. b) Comparison of Recycled Production plus Recycling to the Virgin Production plus Composite Waste Management System Based on our analysis of all grades of paper examined here, from a system-wide view, recycled production plus recycling results in lower emissions of net GHGs, nitrogen oxides and particulates than does virgin production plus waste management. For sulfur oxides, recycled production plus recycling results in lower emissions for newsprint and SBS paperboard, slightly higher emissions for CUK paperboard, and comparable emissions for corrugated containers and office paper. From the limited view of the material recovery and waste management systems only, recycling results in greater releases of all categories of pollutants except GHGs than does waste management, for all grades of paper examined here. c) Comparison of Recycled and Virgin Manufacturing Processes [Note: Air emissions of hazardous air pollutants (HAPs), volatile organic chemicals (VOCs) and sulfur compounds (TRS) were examined only for the recycled and virgin manufacturing processes, due to lack of data for other system activities. Hence the values given do not include emissions of these pollutant categories from the material recovery and waste management options.] Based on our analysis, for all three grades of paper, recycled paper manufacturing produces lower emissions of HAPs, VOCs and TRS than does virgin fiber-based manufacturing. 14
22 2. Waterborne Wastes a) Comparison of Recycled Production plus Recycling to Virgin Production plus Landfilling and Virgin Production plus Incineration [Note: This analysis does not include direct releases of pollutants from material recovery or waste management facilities, due to a lack of data. It does include, however, pollutant releases associated with acquisition of fuels and generation of energy required for waste management activities.] Newsprint: Based on our analysis, from a system-wide view, recycled production plus recycling produces the lowest releases of chemical oxygen demand (COD), but the highest releases of biochemical oxygen demand (BOD) and suspended solids, of the three options. Corrugated: Based on our analysis, from a system-wide view, recycled production plus recycling produces the lowest releases of COD and suspended solids and comparable releases of BOD compared to the other two options. Office Paper: Based on our analysis, from a system-wide view, recycled production plus recycling produces the lowest releases of COD and suspended solids. With respect to BOD, there is no significant difference among the three options. Paperboard: Based on our analysis, from a system-wide view, recycled production plus recycling produces the lowest releases of the three options in all of these categories. b) Comparison of Recycled Production plus Recycling to the Virgin Production plus Composite Waste Management System Newsprint: Based on our analysis, from a system-wide view, recycled production plus recycling produces lower releases of COD, but higher releases of BOD and suspended solids, than does virgin production plus waste management. Corrugated: Based on our analysis, from a system-wide view, recycled production plus recycling produces lower releases of COD and suspended solids and comparable releases of BOD, compared to virgin production plus waste management. Office Paper: Based on our analysis, from a system-wide view, recycled production plus recycling produces lower releases of COD and suspended solids than does virgin production plus waste management. With respect to BOD, there is no significant difference among the two options. Paperboard: Based on our analysis, from a system-wide view, recycled production plus recycling produces lower releases than does virgin production plus waste management in all of these categories. 15
23 c) Comparison of Recycled and Virgin Manufacturing Processes [Note: The following parameters were examined only for the recycled and virgin manufacturing processes, due to lack of data for other system activities. Hence the values given do not include effluent release from the material recovery or waste management options.] (1) Adsorbable organic halogens (AOX) [Note: This parameter was examined only for office paper and SBS paperboard. A few recycled mills may use chlorinated compounds (hypochlorite) in their processes; these types of mills were not examined here and the finding may not apply to them.] In contrast to virgin manufacturing processes for office paper and SBS paperboard that utilize chlorinated compounds (elemental chlorine and/or chlorine dioxide) for bleaching, the use of recovered fiber in manufacturing office paper or paperboard is expected to generate no discharge of AOX. (2) Effluent Quantity/Water Use Based on our analysis, the recycled manufacturing process results in less (or for newsprint, comparable) effluent discharge compared to the virgin manufacturing process. D. Wood Use [Section IV.D] [Note: The following parameter was examined only for the recycled and virgin manufacturing processes, the only activities where it is relevant.] Based on our analysis, the recycled manufacturing process consumes no wood in the form of trees. The virgin manufacturing processes consume between about 2 tons (for newsprint) to 3.8 tons (for SBS paperboard) of wood in the form of trees, per ton of final product. 16
24 Figure S1. NEWSPRINT: Average Lifecycle Energy Use and Environmental Releases Recycled Production plus Recycling Virgin Production plus Landfilling Virgin Production plus Incineration Percent of highest value SOLID WASTES (lbs/ton) 933 1,140 2,876 ENERGY USAGE (million Btus/ton) Total Purchased Fossil Fuel-Derived ATMOSPHERIC EMISSIONS (lbs/ton) Net Greenhouse Gases (CO2 Equivalents) 3,498 4,695 9,026 Nitrogen Oxides Particulates Sulfur Oxides Hazardous Air Pollutants (HAPs) Volatile Organic Chemicals (VOCs) WATERBORNE WASTES (lbs/ton) Biochemical Oxygen Demand (BOD) Chemical Oxygen Demand (COD) Total Suspended Solids (TSS) EFFLUENT FLOW (gals/ton) 13,025 14,106 14,106 WOOD USE (tons of trees)
25 Figure S2. CORRUGATED: Average Lifecycle Energy Use and Environmental Releases Recycled Production plus Recycling Virgin Production plus Landfilling Virgin Production plus Incineration Percent of highest value SOLID WASTES (lbs/ton) ,334 ENERGY USAGE (million Btus/ton) Total Purchased Fossil Fuel-Derived ATMOSPHERIC EMISSIONS (lbs/ton) Net Greenhouse Gases (CO2 Equivalents) Nitrogen Oxides Particulates Sulfur Oxides Hazardous Air Pollutants (HAPs) Volatile Organic Chemicals (VOCs) Total Reduced Sulfur (TRS) ,211 3, , WATERBORNE WASTES (lbs/ton) Biochemical Oxygen Demand (BOD) Chemical Oxygen Demand (COD) Total Suspended Solids (TSS) EFFLUENT FLOW (gals/ton) 2,000 10,893 10,893 WOOD USE (tons of trees)
26 Figure S3. OFFICE PAPER: Average Lifecycle Energy Use and Environmental Releases Recycled Production plus Recycling Virgin Production plus Landfilling Virgin Production plus Incineration Percent of highest value SOLID WASTES (lbs/ton) 1,005 1,155 2,613 ENERGY USAGE (million Btus/ton) Total Purchased Fossil Fuel-Derived ATMOSPHERIC EMISSIONS (lbs/ton) Net Greenhouse Gases (CO2 Equivalents) Nitrogen Oxides Particulates Sulfur Oxides Hazardous Air Pollutants (HAPs) Volatile Organic Chemicals (VOCs) Total Reduced Sulfur (TRS) ,459 3, , WATERBORNE WASTES (lbs/ton) Adsorbable Organic Halogens (AOX) Biochemical Oxygen Demand (BOD) Chemical Oxygen Demand (COD) Total Suspended Solids (TSS) EFFLUENT FLOW (gals/ton) 10,325 20,520 20,520 WOOD USE (tons of trees)
27 Figure S4. CUK PAPERBOARD: Average Lifecycle Energy Use and Environmental Releases Recycled Production plus Recycling Virgin Production plus Landfilling Virgin Production plus Incineration Percent of highest value SOLID WASTES (lbs/ton) ,281 ENERGY USAGE (million Btus/ton) Total Purchased Fossil Fuel-Derived ATMOSPHERIC EMISSIONS (lbs/ton) Net Greenhouse Gases (CO2 Equivalents) Nitrogen Oxides Particulates Sulfur Oxides Hazardous Air Pollutants (HAPs) Volatile Organic Chemicals (VOCs) Total Reduced Sulfur (TRS) ,694 3, , WATERBORNE WASTES (lbs/ton) Biochemical Oxygen Demand (BOD) Chemical Oxygen Demand (COD) Total Suspended Solids (TSS) EFFLUENT FLOW (gals/ton) 1,930 11,078 11,078 WOOD USE (tons of trees)
28 Figure S5. SBS PAPERBOARD: Average Lifecycle Energy Use and Environmental Releases Recycled Production plus Recycling Virgin Production plus Landfilling Virgin Production plus Incineration Percent of highest value SOLID WASTES (lbs/ton) ,624 ENERGY USAGE (million Btus/ton) Total Purchased Fossil Fuel-Derived ATMOSPHERIC EMISSIONS (lbs/ton) Net Greenhouse Gases (CO2 Equivalents) Nitrogen Oxides Particulates Sulfur Oxides Hazardous Air Pollutants (HAPs) Volatile Organic Chemicals (VOCs) Total Reduced Sulfur (TRS) , , , WATERBORNE WASTES (lbs/ton) Adsorbable Organic Halogens (AOX) Biochemical Oxygen Demand (BOD) Chemical Oxygen Demand (COD) Total Suspended Solids (TSS) EFFLUENT FLOW (gals/ton) 1,930 21,697 21,697 WOOD USE (tons of trees)
29 Figure S6. NEWSPRINT: Average Lifecycle Energy Use and Environmental Releases Recycled Production plus Recycling Virgin Production plus Waste Management Percent of highest value SOLID WASTES (lbs/ton) 1,140 2,478 ENERGY USAGE (million Btus/ton) Total Purchased Fossil Fuel-Derived ATMOSPHERIC EMISSIONS (lbs/ton) Net Greenhouse Gases (CO2 Equivalents) 3,498 8,138 Nitrogen Oxides Particulates Sulfur Oxides Hazardous Air Pollutants (HAPs) Volatile Organic Chemicals (VOCs) WATERBORNE WASTES (lbs/ton) Biochemical Oxygen Demand (BOD) Chemical Oxygen Demand (COD) Total Suspended Solids (TSS) EFFLUENT FLOW (gals/ton) 13,025 14,106 WOOD USE (tons of trees)
30 Figure S7. CORRUGATED: Average Lifecycle Energy Use and Environmental Releases Recycled Production plus Recycling Virgin Production plus Waste Management Percent of highest value SOLID WASTES (lbs/ton) 537 1,939 ENERGY USAGE (million Btus/ton) Total Purchased Fossil Fuel-Derived ATMOSPHERIC EMISSIONS (lbs/ton) Net Greenhouse Gases (CO2 Equivalents) 3,469 5,562 Nitrogen Oxides Particulates Sulfur Oxides Hazardous Air Pollutants (HAPs) Volatile Organic Chemicals (VOCs) Total Reduced Sulfur (TRS) 0.2 WATERBORNE WASTES (lbs/ton) Biochemical Oxygen Demand (BOD) Chemical Oxygen Demand (COD) Total Suspended Solids (TSS) EFFLUENT FLOW (gals/ton) 2,000 10,893 WOOD USE (tons of trees)
31 Figure S8. OFFICE PAPER: Average Lifecycle Energy Use and Environmental Releases Recycled Production plus Recycling Virgin Production plus Waste Management Percent of highest value SOLID WASTES (lbs/ton) 1,155 2,283 ENERGY USAGE (million Btus/ton) Total Purchased Fossil Fuel-Derived ATMOSPHERIC EMISSIONS (lbs/ton) Net Greenhouse Gases (CO2 Equivalents) Nitrogen Oxides Particulates Sulfur Oxides Hazardous Air Pollutants (HAPs) Volatile Organic Chemicals (VOCs) Total Reduced Sulfur (TRS) , , WATERBORNE WASTES (lbs/ton) Adsorbable Organic Halogens (AOX) Biochemical Oxygen Demand (BOD) Chemical Oxygen Demand (COD) Total Suspended Solids (TSS) EFFLUENT FLOW (gals/ton) 10,325 20,520 WOOD USE (tons of trees)
32 Figure S9. CUK PAPERBOARD: Average Lifecycle Energy Use and Environmental Releases Recycled Production plus Recycling Virgin Production plus Waste Management Percent of highest value SOLID WASTES (lbs/ton) 580 1,898 ENERGY USAGE (million Btus/ton) Total Purchased Fossil Fuel-Derived ATMOSPHERIC EMISSIONS (lbs/ton) Net Greenhouse Gases (CO2 Equivalents) 3,244 5,102 Nitrogen Oxides Particulates Sulfur Oxides Hazardous Air Pollutants (HAPs) Volatile Organic Chemicals (VOCs) Total Reduced Sulfur (TRS) 0.3 WATERBORNE WASTES (lbs/ton) Biochemical Oxygen Demand (BOD) Chemical Oxygen Demand (COD) Total Suspended Solids (TSS) EFFLUENT FLOW (gals/ton) 1,930 11,078 WOOD USE (tons of trees)
33 Figure S10. SBS PAPERBOARD: Average Lifecycle Energy Use and Environmental Releases Recycled Production plus Recycling Virgin Production plus Waste Management Percent of highest value SOLID WASTES (lbs/ton) 580 2,241 ENERGY USAGE (million Btus/ton) Total Purchased Fossil Fuel-Derived ATMOSPHERIC EMISSIONS (lbs/ton) Net Greenhouse Gases (CO2 Equivalents) Nitrogen Oxides Particulates Sulfur Oxides Hazardous Air Pollutants (HAPs) Volatile Organic Chemicals (VOCs) Total Reduced Sulfur (TRS) , , WATERBORNE WASTES (lbs/ton) Adsorbable Organic Halogens (AOX) Biochemical Oxygen Demand (BOD) Chemical Oxygen Demand (COD) Total Suspended Solids (TSS) EFFLUENT FLOW (gals/ton) 1,930 21,697 WOOD USE (tons of trees)
34 III. Description of Activities and Types of Environmental Impacts Associated with Recovery and Waste Management Options This section describes the nature of activities associated with landfilling, incineration and recycling, both generally and as applied to the paper fraction of MSW, as a basis for illustrating the range of environmental impacts associated with the three management options. Some activities and impacts are common to all of the options, while others are unique or have aspects that are specific to one or two of the three options. A. Activities and Types of Impacts Common to All Options 1. Waste/Material Collection and Transport Under each option, waste or material must be collected from sites of generation, sometimes delivered to central collection or processing points, and then transported to the site of remanufacture or disposal. Typically, if used paper is to be landfilled or incinerated, it is collected commingled with other materials using packer trucks or other trash collection vehicles. In many (but not all) cases, waste destined for landfilling or incineration passes through a transfer station on its way to the disposal facility, for purposes of consolidation, weighing, etc. Used paper collected for recycling is typically segregated from non-recyclable materials (it may be collected commingled with other recyclables or separately) and delivered to a MRF or directly to the site of remanufacture. Such materials typically are collected by vehicles distinct from those that collect commingled trash. Environmental impacts arise principally from the fuel use and emissions of collection vehicles. Factors that will affect the relative impacts of the different options include the type, number and capacity of vehicles used for transport, and the total distance the waste or material is transported, from the point of generation to the point of remanufacture or disposal. 2. Processing and Handling Typically, each option includes at least minimal processing or handling prior to disposal or recycling. Landfilling involves the least processing. In some cases, waste may be baled prior to disposal, though more commonly trash is hauled by truck to the landfill and compacted after placement; bulky items (e.g., appliances) or special waste materials (e.g., tires or hazardous items such as batteries) may be separately handled and disposed of or recycled. With incineration, bulky items and special materials are handled and disposed of or recycled separately. Two major variants exist with respect to further pre-processing of waste. "Mass-burn" incinerators employ essentially no additional pre-processing prior to combustion, while facilities that employ "refuse-derived fuel" (RDF) technology process waste to varying degrees. 9 The RDF process typically starts with a shredding operation, and may stop there or continue on with one or more steps to separate fractions of waste (e.g., heavy vs. light or 27
35 combustible vs. non-combustible materials). Material to be combusted may be pelletized, while reject materials must be hauled away for disposal. Used paper is usually among the materials combusted in RDF facilities, regardless of mode or extent of pre-processing. With recycling, various paper grades are typically collected and processed separately from each other. Some programs may commingle various grades during collection; in these cases, the mixed material either is sent to remanufacturing sites as a relatively low-grade material, or is separated into different grades, typically through manual means. The only additional processing typically is baling. Non-paper material or contaminated paper unsuitable for recycling that has been separated from the recovered material must be hauled away for disposal. For all three options, environmental impacts are primarily associated with emissions from, and energy requirements for, processing equipment and releases arising from the subsequent disposal of residuals or reject materials. 3. Other Types of Impacts The problems of litter, odor, noise, truck traffic, dust, pest (e.g., rodent) problems and visual impact are frequent public concerns associated with waste management activities and facilities, and certainly constitute environmental impacts (at least in the broader sense of the word "environmental"). 10 While they are most frequently associated with landfills, and some such impacts are arguably most intensively encountered with that option, analogous concerns have been raised with incinerators and in some cases recycling processing facilities. The largely qualitative nature of such impacts makes rigorous comparison of the recovery and waste management options difficult. Because of this factor and the general absence of comparative data in the literature, further discussion of these impact categories is beyond the scope of this White Paper. B. Activities and Types of Impacts Specific to Each Option 1. Landfilling The three major "by-products" of landfills that have environmental implications are: Leachate, liquid that is present initially in waste materials and that is generated both during waste decomposition and as a result of precipitation percolating through the waste (and in certain cases, groundwater intrusion into the waste); it may be contaminated with pollutants that are either generated by decomposition or are present in the original waste materials. Run-off, liquid originating through precipitation that has relatively minor contact with the waste; it may also be contaminated with pollutants that are either generated by decomposition or are present in the original waste materials. 28
36 Air emissions, produced as a result of waste decomposition, and composed of flammable and potentially explosive methane gas, carbon dioxide, and other volatile compounds that may be toxic. 11 Technology employed at existing landfills to contain, recover or control these byproducts varies over a wide range, depending primarily on the age and size of landfills and applicable regulatory requirements. The most modern landfills are equipped with one or more liners and leachate/run-off collection systems underlaying and surrounding the waste, and in some cases, leak detection systems and recovery systems for collecting methane and other landfill gas emissions. Other steps being taken in many areas can also reduce methane and other releases from landfills; these include bans on disposal of yard wastes in landfills, as well as increased final cover requirements for landfills to reduce infiltration of precipitation and subsequent enhanced rates of decomposition. At the other end of the spectrum, older landfills may be entirely unlined and lack any collection systems. 12 Use of such landfills is declining as a result of increased regulatory requirements at the state and federal level. The major categories of actual and potential environmental impacts from landfilling are described below. Leachate/run-off generation and management: Where leachate and run-off are collected, such liquids are either treated on-site, or more commonly, trucked or discharged to a sewage treatment plant. In the former case, the treatment process generates a sludge, comprised of solid materials removed from the treated liquid, and a cleaner effluent, which is typically directly discharged to surface water. In the latter case, the landfill leachate and run-off contribute to the total volume of wastewater being treated, and therefore to the sludge and effluent generated, by the sewage treatment plant. The primary environmental concern with regard to leachate and run-off is the potential for pollutants present in such liquids to contaminate ground or surface water. 13 Leachate composition and concentrations of individual components vary over a wide range both from site to site and even over time at the same site; Table 1 provides data characterizing these ranges in a typical MSW landfill during the period soon after placement of waste, and later after anaerobic conditions (i.e., when oxygen is not present) have developed. Pathways leading to contamination of ground or surface water include: (a) entry of these liquids into ground or surface water directly from the landfill, due to the absence of liners and leachate and run-off collection systems, due to system defects (e.g., leaks) or malfunctions, or simply due to the fact that even the best-designed liners and collection systems provide lessthan-total containment; 14 or (b) entry of sewage treatment plant effluent into ground or surface water. 29
37 TABLE 1 LANDFILL LEACHATE COMPOSITION Leachate Component Unit Initial Phase Later Phase BOD mg/l , COD mg/l , SO4 mg/l Ca mg/l Mg mg/l Fe mg/l Mn mg/l Zn mg/l Cl (1) mg/l Na (1) mg/l K (1) mg/l NH4 (1) mg N/l orgn (1) mg N/l total N (1) mg N/l NO3 (1) mg N/l NO2 (1) mg N/l total P (1) mg P/l AOX (1) ug Cl/l As (1) ug/l Cd (1) ug/l Co (1) ug/l Ni (1) ug/l Pb (1) ug/l Cr (1) ug/l Cu (1) ug/l Hg (1) ug/l mg/l = milligrams per liter; mg N/l = milligrams of nitrogen per liter; ug/l = micrograms per liter (1) no differences between initial and later phases could be observed SOURCE: Franklin Associates, 1994a, op. cit., Appendix I, p. I
38 Sludge generated by leachate/run-off treatment on-site or by sewage treatment plants must itself be managed. Sludge management options in use include: direct landfilling (which then engenders another round of leachate generation and management); combustion in sludge incinerators (which may engender some of the incinerator impacts described below); composting followed by landfilling of the composted sludge or use of the compost product as a soil amendment; and direct land application. Depending on the extent of contamination of the sludge, environmental risks can arise from each of these sludge management options. Generation of landfill gas/air emissions: The primary landfill gas of concern is methane, a by-product of waste decomposition under anaerobic conditions. The most acute concern with methane is its extreme flammability and explosivity, and landfill regulations increasingly require monitoring of methane concentrations and measures to ensure that methane concentrations remain below explosive thresholds. 15 A more global concern is the fact that methane is a potent "greenhouse gas," contributing (along with carbon dioxide, a by-product of waste decomposition in landfills under both aerobic and anaerobic conditions) to atmospheric temperature trends linked to global warming. Methane is estimated to be about 21 times more potent than carbon dioxide at trapping infrared radiation on a molecule-per-molecule basis. 16 In the aggregate, landfills represent a significant source of methane and a minor source of carbon dioxide relative to other sources at a global scale. 17 More recently, attention has focused on the trace components of landfill air emissions, which can include dust as well as a host of odorous, toxic and smog-forming compounds such as benzene, carbon tetrachloride, methylene chloride, hexane, and toluene. 18 Typical concentration ranges of various compounds in landfill gas are shown in Table 2. EPA has recently proposed regulation of toxic air emissions from landfills, based in part on its estimate that, nationally, landfills are responsible for emissions of 220,000 tons of volatile organic chemicals (VOCs), excluding methane. 19 Some studies indicate that concentrations of toxic compounds present in landfill gas are sufficiently high to pose risks to nearby populations, 20 although definitive causeeffect relationships are exceedingly difficult to establish. 21 Methane control: Some newer landfills (about a quarter of the total) have systems in place to collect methane and vent it to the atmosphere, flare (i.e., burn) it, or recover it for energy production. 22 Venting alleviates the most acute problem of explosivity, but does not address the broader global warming concern. Flaring also addresses explosivity but may do little to reduce other emissions and may even generate new air emissions of potential environmental concern (including dioxins) 23, due to the relatively inefficient combustion achieved by such flares. 24 Recovery provides the benefit of energy (steam or electricity) generation, but may generate air emissions of its own. (Carbon dioxide, another greenhouse gas, is among such emissions, although the transformation of methane into carbon dioxide results in a much reduced aggregate contribution to global warming.) Potential for energy recovery from landfill gas: Of an estimated 4500 landfills operating in the U.S. in 1993, 25 there were 127 gas-to-energy operations, with another 60 under 31
39 TABLE 2 CONCENTRATIONS OF GASEOUS COMPONENTS FROM MSW LANDFILLS Constituent Range of concentration (ppm) Median Benzene Carbon dioxide 342, , ,000 Carbon tetrachloride 11 1,2-Dichloroethane Ethyl benzene Heptane Hexane Isopentane Methane 440, , ,000 Methyl-cyclohexane Methyl-cyclopentane Methyl chloride Nonane Perchloroethylene Toluene ,1,1-Trichloroethane Trichloroethylene Trichloromethane 0.61 Vinyl chloride Xylene m-xylene o-xylene ppm = parts per million SOURCE: Office of Technology Assessment, 1989, op. cit., p
40 construction or in planning stages. 26 Due to this limited use of landfill gas recovery, this activity is not included in the quantitative environmental profile of landfilling presented in Section IV. However, the potential amount of energy that could be recovered from the collection and burning of landfill gas has been estimated in various reports. Franklin Associates recently reported the following energy potential: pounds of methane is produced per ton of MSW landfilled; a typical recovery rate for methane from landfill gas is 66%; a typical gas turbine can generate 1.75 kilowatt-hours (kwh) of electricity per pound of methane burned, based on an energy value of landfill gas (methane) of about 500 Btu per cubic foot of gas; hence, 144 kwh of electricity could be produced per ton of MSW landfilled, the fossil-fuel equivalent of 1,542,500 Btus per ton. 27 Energy requirements to collect, process and burn landfill gas are not included in this estimate, however. Land use issues: Another area of impact is the effect of landfills on land use. Landfills do occupy considerable space and remove those areas from other uses for an extended period (if not forever). While in the past some landfill sites have been converted to other uses, ranging from parks to golf courses to sports complexes, such uses are extremely limited for modern landfills due to requirements that the final landfill cover not be disturbed. The potential for subsidence of material in a landfill even long after closure also limits the uses to which such areas can be put. Restrictions on land use for the area surrounding a landfill may be an additional impact, whether they arise through reductions in property values, zoning restrictions or simply voluntary avoidance Paper in Landfills By both weight and volume, paper and paperboard products are the largest single component of MSW, and therefore of landfilled MSW. In 1993, used paper comprised 31.7% (by weight) and 30.2% (by volume) of the 162 million tons of MSW disposed of. 29 The contribution of various paper and paperboard products to MSW discards (after recycling) is shown in Table 3. Paper's contribution to landfill leachate and gas emissions is difficult to quantify, and there is no empirical basis (i.e., based on actual measurements) for allocating a particular share of total landfill leachate or gas constituents to the paper fraction of landfilled waste. Major components of paper -- cellulose and hemicellulose -- are organic materials subject to degradation under both aerobic and anaerobic conditions. While degradation rates in most modern landfills are relatively slow due to operational and design practices intended to reduce moisture content, paper and other materials do decompose over time and are the source of leachate constituents as well as methane, carbon dioxide and other landfill gas components
41 TABLE 3 CONTRIBUTION OF PAPER AND PAPERBOARD TO MSW DISCARDS, BY WEIGHT AND VOLUME 1993 Type of Paper 1993 Discards (mil tons) Percent of MSW (by Weight) Percent of MSW (by Volume) Newspapers Books Magazines Office papers Telephone books Third class mail Other commercial printing Tissue paper and towels Paper plates and cups Disposable diapers Other non-packaging paper Corrugated boxes Milk cartons Folding cartons Other paperboard packaging Paper bags/sacks Wrapping paper Other paper packaging Total Paper/Board SOURCE: Franklin Associates, Characterization of Municipal Solid Waste in the United States: 1994 Update, prepared for U.S. Environmental Protection Agency, Office of Solid Waste, Report No. EPA/530-S , November
42 Estimates of the carbon content of paper relative to mixed MSW suggest that paper has about a third more carbon per unit weight than does MSW. 31 Coupled with its organic nature, this means that, when it decomposes, paper can be expected to generate relatively more carbon dioxide and methane emissions (both greenhouse gases) than most other materials present in MSW. Any carbon dioxide release from paper decomposition, however, represents carbon dioxide originally absorbed by the trees from which the paper was made, in the process of growing. In contrast, only a fraction of methane releases from paper decomposition can be considered offset by carbon dioxide absorption by trees, as discussed in Section IV.C.1 below. Hence, paper in landfills can represent a substantial net contributor of greenhouse gases to the atmosphere. Substances associated with paper may also contribute to releases from landfills. Inks and pigments used to print or color paper may themselves be, or degrade into, constituents of concern. The use of heavy metals in inks and pigments in general has declined, and restrictions on their use in packaging (made from paper and other materials) have recently been enacted in a number of states. Paper materials produced some time ago (e.g., archived materials, old inventories) may have higher levels of heavy metals or other constituents of concern. For example, carbonless carbon paper was made using PCBs for many years. 3. Incineration All waste that enters an incinerator's combustion chamber exits in one of four forms: as combustion gases, which exit via the stack except to the extent that some of them may be removed by air pollution-control devices; as emissions of particulate material, which is composed of light-weight particles that are borne out of the combustion chamber along with the combustion gases, and are small enough to escape the air pollution-control devices; as air pollution control residues, which includes fly ash (particulate material light enough to be borne upward with the combustion gases, but heavy enough to fall out as the gases cool before leaving the stack or large enough to be captured by the air pollution control devices), as well as lime or other reagents added to neutralize or remove certain pollutants present in combustion gases; or as bottom ash, which is the solid material that passes through the combustion chamber on the grates, and usually is automatically conveyed to a water-filled pit for quenching. Table 4 lists the primary or most toxic constituents of each of these four types of combustion products. 35
43 TABLE 4 PRIMARY AND ENVIRONMENTALLY SIGNIFICANT BY-PRODUCTS OF MSW INCINERATION Combustion Product Primary Constituents Toxic or Environmentally Harmful Constituents Gases Carbon Dioxide (CO2) Water (H2O) Carbon Monoxide (CO) Nitrogen Oxides (NOx) Sulfur Dioxide (SO2) Hydrochloric Acid (HCl) Carbon Dioxide (CO2) Carbon Monoxide (CO) Nitrogen Oxides (NOx) Sulfur Dioxide (SO2) Hydrochloric Acid (HCl) Mercury Vapor Particulate emissions Air pollution control residues Bottom ash Oxides or salts of silicon, aluminum, etc. Carbon Oxides or salts of silicon, aluminum, etc. Lime Carbon Condensed acids (HCl, SO2) Uncombusted waste (e.g., glass, metal) Heavy metals (mercury, cadmium, lead, etc.) Products of incomplete combustion (PICs) Heavy metals (mercury, cadmium, lead, etc.) Products of incomplete combustion (PICs) Heavy metals (cadmium, lead, etc.) SOURCES: Denison, R.A. and Ruston, J. (eds.) (1990) Recycling and Incineration: Evaluating the Choices, (Washington, DC, Island Press); Clarke, M.J., "Improving Environmental Performance of MSW Incinerators," presented at the Industrial Gas Cleaning Forum '88, Washington, D.C., November 3-4,
44 In addition, several liquid waste streams can be generated by incinerators, depending on their design and operation. Boilers and scrubbers may generate contaminated liquid effluents that are discharged, with or without prior treatment. Quench water (the excess liquid used to cool the ash as it exits the furnace) comes into intimate contact with the ash, and can contain very high levels of salt and heavy metals dissolved from the ash. 32 With good design, the need to discharge these liquid waste streams can be avoided through internal reuse. While newer facilities achieve "zero discharge" of these wastes, some operating facilities routinely discharge contaminated wastewater to sewage treatment plants. Approximately 10% to 25% (by volume) and 25% to 35% (by weight) of the waste fed to the combustion chamber will typically remain as ash. 33 While these figures illustrate the benefit to a solid waste manager of reducing the amount of waste that must be disposed of, they do not include two other significant waste streams associated with the use of incineration: "Non-processible" material that cannot be incinerated, such as demolition waste and construction rubble, bulky items such as appliances ("white goods"), large tree stumps, etc.; this kind of material typically amounts to 15% of the total waste stream and must be landfilled. "By-pass" waste, the waste that cannot be incinerated during periods when the incinerator is shut down for maintenance or repairs; typically, shutdowns occur about 10-15% of the time over the life of the facility, and when they occur, by-pass waste must be landfilled. When these wastes are considered along with ash, incinerators reduce the volume of a community's waste stream requiring landfill disposal by up to 60%. 34 Incinerators currently operating differ significantly with respect to what technologies they employ for combustion control and air pollution control, primarily based on their age (i.e., date of start-up or last upgrading). Of the "waste-to-energy" incinerators operating in 1993, about 30% began operation prior to 1986, another 50% between 1986 and 1989, and the remaining 20% after The major categories of actual and potential environmental impacts (and benefits) from incineration are described below. Incinerator air emissions: Heavy metals present in incinerator air emissions have welldefined health effects that have been demonstrated in numerous studies of exposed populations. Many of these substances are carcinogenic, and can also exert a broad spectrum of other adverse effects, both in humans and in other biota. 36 Dioxins and related compounds are also present in air emissions as a result of incomplete combustion of waste in MSW incinerators. These chemicals have been implicated in a range of health effects observed at very low doses, including effects on the immune, reproductive and endocrine systems as well as various types of cancer. Their concentration in emissions from a given incinerator depends primarily on incinerator design, combustion conditions and both type and operating conditions of the air pollution control equipment 37
45 employed. Available data indicate wide variation (over several orders of magnitude) in dioxin concentrations emitted from different MSW incinerators, and even from the same facility over time. Moreover, many facilities have not been tested for dioxin emissions, and hence there is considerable uncertainty involved in estimating dioxin releases from these facilities as a class. In the aggregate, however, the U.S. Environmental Protection Agency and other sources rank MSW incinerators as among the largest of all known sources of dioxins to the environment. 37 Multiple routes of exposure to these substances must be considered in assessing risks. Direct inhalation is the most obvious exposure route. However, even more significant pathways of exposure can occur after air emissions are deposited on soils, surface water, food, and dust, or accumulate in the buildings where people live or work. The predominance of these pathways reflects two factors: the accumulation of substances in environmental "sinks" such as soils and dust following deposition, as compared to their relatively short lifetime suspended in air; and the opportunities for intensive direct contact with deposited particles. 38 Because metals and organic substances such as dioxins are permanent or highly persistent in the environment, they are particularly prone to accumulating both in environmental compartments and within the human body. Thus, long-term releases even at low levels have the potential to pose significant risk. Combustion gases of environmental concern include the following. Nitrogen oxides, which contribute to acid rain and urban smog, are produced to some degree in any high-temperature combustion process through a heat-catalyzed reaction of the oxygen and nitrogen gases found naturally in air. In addition, certain waste components (yard and food wastes) are typically high in nitrogen, and when combusted generate nitrogen oxides. 39 Sulfur oxides and hydrogen chloride, acid gases which contribute to acid rain and can cause corrosion of structures exposed to them, are produced from the combustion of sulfurand chlorine- or chloride-containing waste components. Carbon monoxide, a product of incomplete combustion and a significant contributor to urban air pollution. Carbon dioxide, a greenhouse gas, is produced from any combustion process that takes place in the presence of oxygen. Air pollution control: Most newer incinerators are equipped with relatively sophisticated combustion control systems. By controlling combustion conditions, incinerator operators can increase the efficiency of combustion and reduce the formation of certain pollutants such as dioxins and nitrogen oxides. 40 Most incinerators are also equipped with air pollution control devices of various types. Virtually all "waste-to-energy" incinerators have particulate control devices, ranging from wet scrubbers to electrostatic precipitators to fabric filters. The new generation of facilities also have acid gas scrubbers to reduce emissions of hydrochloric acid and sulfur dioxide, and, in a few cases, nitrogen oxide controls as well. 41 These devices reduce but do not eliminate emissions of heavy metals, dioxins and related compounds, and harmful gases, leaving risk assessors and 38
46 regulators the difficult task of deciding how much reduction is enough. More advanced pollution controls are being introduced in some cases, for example, activated carbon injection to reduce emissions of pollutants such as mercury. Pollution control devices capable of reducing carbon dioxide emissions are not employed on MSW incinerators. Energy generation: Most modern incinerators include an energy recovery system. Such a system captures the heat released during combustion and converts it to steam and/or electricity, which serves as a source of revenue to partially offset the costs of incineration. It should be recognized that the feedstock of incinerators -- garbage -- is a relatively poor fuel. About 45% of the materials in our waste, such as glass and metal and yard wastes, do not burn or burn poorly in incinerators. 42 MSW contains about 35% of the heating value of bituminous coal and 27% of the heating value of #2 fuel oil (see Table 5). Ash generation: Incinerator ash contains environmentally significant concentrations of numerous toxic heavy metals, including lead, cadmium and chromium, and can also contain mercury and organic compounds such as dioxins. While the metals are present in unburned waste as well, by burning up the combustible portions of the waste, incineration concentrates the metals in direct proportion to the volume reduction achieved. Moreover, because ash (especially fly ash) is comprised of relatively small particles to which heavy metals and dioxins are attached, it can be dispersed more readily through the environment than unburned MSW; exposure routes such as inhalation and ingestion, which are not relevant at all for unburned waste, also become concerns. 43 Certain of the metals present in ash -- lead and cadmium, in particular -- are in chemical and physical forms that make them particularly prone to leaching (i.e., dissolving in water that comes into contact with the ash), and using mandated federal test procedures have frequently leached at levels that exceed standards defining a hazardous waste under federal law. 44 It should be noted that there is a direct correlation between the concentrations of heavy metals or dioxins in fly ash and the efficiency of particulate control devices used to reduce air pollution: any such substances removed from flue gases prior to their release to the atmosphere are transferred quantitatively to the particulate matter captured by air pollution control devices, i.e., to the fly ash. Ash management: Exposure to harmful substances present in ash can potentially occur by numerous routes and at numerous points during the process of ash management. At the incinerator itself, opportunities for release of ash begin at the point of generation, and continue during onsite management, handling, storage, and transport of ash. Further points of release may arise during disposal (e.g., dust generation during landfilling; runoff or wind dispersal from uncovered ash)
47 TABLE 5 INHERENT ENERGY CONTENT OF VARIOUS PAPER GRADES AND OTHER SELECTED COMPONENTS OF MSW, IN COMPARISON TO FOSSIL FUELS Waste Component Energy Content (Btu/lb) PAPER GRADES Mixed MSW 4,800 Mixed waste paper 6,800 Newsprint 7,950 Corrugated cardboard 7,040 Magazines 5,250 Junk mail from environmental groups 6,090 OTHER WASTE COMPONENTS Plastics 14,000-18,700 Leaves (@ 50% moisture content) 3,500 Green wood 2,100 Cured lumber 7,300 FOSSIL FUELS Coal 13,500-14,000 #2 Fuel oil 18,000 SOURCE: EPA, Municipal Solid Waste Factbook,
48 Even after disposal, leachate from a disposal site can contaminate ground or surface water. Such contamination can arise where ash is stored or disposed of in facilities that lack liners and leachate collection systems; where they are used, contamination may still occur through failure of the leachate collection system or a breach in the liner(s), either during the disposal site's active life or thereafter. In addition, as was the case with MSW landfill leachate, impacts can result from the management and disposal of leachate or quench water. Recently, ash has been used or proposed for use in a range of applications, including incorporation into cement blocks used to create artificial marine reefs or shoreline protection devices, use as a substitute for natural aggregate materials (e.g., gravel) in roadbuilding and other construction applications, and incorporation into cement products finding their way into a host of commercial and residential applications. Proponents of such ash utilization argue that it is a form of recycling, and therefore preferable to land disposal. They also point out that utilizing ash can lessen the need to acquire the natural materials for which it substitutes -- materials that in some cases can themselves contain substances of environmental concern. 46 Other observers stress, however, that because ash contains environmentally significant levels of toxic heavy metals, its utilization amounts to dispersal of such metals into the environment in a relatively uncontrolled manner. They identify a range of pathways for both occupational and general population exposure that can arise before and after, as well as during, actual utilization in a given application (e.g., development of potholes in roads, demolition of buildings even decades after initial utilization). Finally, they point to the lack of regulation of ash utilization and the institutional difficulty of developing adequate regulation in a situation where a potentially toxic material is introduced into production processes and streams of commerce that typically employ materials with little or no heavy metal content Paper in Incinerators Used paper comprises the same fraction of incinerated MSW as was discussed previously for landfills (about one-third). And as with landfilled used paper, where heavy metals are still used in inks or pigments used in paper products, such products will contribute to the heavy metal concentrations found in air emissions and ash residues. The extent of formation of dioxins and related compounds by incinerators is primarily a function of the combustion efficiency and other operating conditions, and is determined to a lesser degree by the nature of the waste burned. 48 Certain chlorinated plastics (e.g., polyvinyl chloride) have been directly implicated in some studies as contributing to dioxin concentrations from incinerators. 49 Evidence with regard to paper materials is less clear; paper does contain appreciable chloride, 50 however, and combustion of wood and lignin in the presence of chloride is known to be capable of creating dioxin precursors and dioxin, 51 suggesting that incineration of used paper may well contribute to the dioxin found in releases from such facilities. Incineration of used paper does not stand out as a disproportionately large contributor to sulfur dioxide or nitrogen oxides; as just discussed, however, paper does contain chloride; 52 because hydrochloric (HCl) acid emissions from incinerators are a direct function of the amount of chlorine and chloride present, 53 paper is among the materials in MSW that contribute to the 41
49 HCl emissions associated with incineration. As discussed previously, paper also has a higher than average carbon content, which, coupled with its organic nature, means that its incineration contributes more carbon dioxide than most other materials present in MSW. However, this carbon dioxide represents carbon dioxide originally absorbed by the trees from which the paper was made, in the process of growing; hence incineration of paper in MSW results in little or no net contribution of carbon dioxide to the atmosphere. Paper has a higher-than-average energy content relative to other materials in MSW, as shown in Table 5. The figures provided are inherent energy values based on dry weight; they overstate actual energy yield when combusted as part of mixed MSW, because paper materials have considerable moisture content as received at an incinerator (10% or more), 54 and because materials such as glass and metals not only do not produce energy themselves, but absorb energy released by the combustible materials. With respect to the contribution of used paper to the amount of ash generated through incineration, various grades of paper exhibit a wide range of ash content, depending on the extent of inorganic fillers or coatings present. Uncoated paper and paperboard materials yield as little as 3% (by weight) ash, while coated materials may yield 20% or greater ash. 55 Given that 25-35% by weight of MSW remains after incineration, used paper generally has a lower-thanaverage ash content relative to other components of MSW. 5. Recycling of Recovered Paper As described previously, environmental impacts associated with recycling collection, transport and processing are primarily associated with emissions from, and energy requirements for, collection and processing equipment and disposal of residuals or reject materials. These impacts may differ in magnitude -- but probably not in character -- from those arising from the comparable collection, transport and processing activities associated with landfilling and incineration. Collection and transport: Collection of used paper for recycling may involve different types and numbers of collection vehicles, and different transport distances, than used for landfilling or incineration. These may also vary across paper grades. The fuel use and vehicle emissions arising from collection will therefore vary as well. For example, newsprint is typically collected from residential sources through curbside collection programs or drop-off centers. In the former case, newsprint is typically only one of a number of recyclables, which may be collected commingled for later sorting at a MRF or may be sorted at curbside into separate truck compartments. Newsprint collected at drop-off centers is transported there by residents; such centers typically accept multiple materials, which are placed into separate containers by the residents. Paper recovered from commercial sources (including office paper and corrugated) is collected in a variety of ways as well. In many programs, office paper is kept separate or sorted from non-paper materials by individual office workers, and is collected and consolidated by maintenance or cleaning staff for later pick-up; grades may or may not be separated at the 42
50 source. In other programs, essentially all office waste (typically excluding food waste and other wet materials) may be collected for later sorting at a centralized facility. Used corrugated is collected primarily from commercial sources, although some curbside and drop-off collection programs target residential sources. Depending on the nature of the generator and arrangements made with the waste hauler and the recycler, commercial corrugated may be collected using the same vehicles that collect trash or placed in separate containers. In some cases, particularly for used paper collected from residential sources, the material collected for recycling is delivered to an intermediate processing center for further sorting and preparation. In other cases, especially for materials recovered from commercial sources, such as corrugated, the recovered paper may be delivered directly to the site of remanufacture with no intermediate processing. Processing and handling: Generally speaking, it can be expected that recovered paper will be subject to more handling and processing than will paper materials present in waste destined for landfilling or incineration. Where paper is collected with other materials, or various grades of paper are commingled, typical processing starts with sorting by manual or mechanical means. Sorted paper materials commonly are baled and either warehoused or immediately loaded onto trucks, rail cars or barges for transport to remanufacturing sites. Electricity and fuel will be required to power conveyers, balers and other equipment used to handle incoming and sorted materials; use of electricity and fuels results in releases to the environment from electric utilities and directly from processing equipment. Other impacts from recyclables processing (primarily of occupational concern) may arise from exposure to dusts generated by materials handling. Depending on the materials being handled, these dusts can include a variety of contaminants, including heavy metals, mold and bacteria. 56 Residuals management: Used Paper collected for recovery will inevitably include undesired materials: non-paper waste, paper grades other than those targeted, or soiled or otherwise unusable materials of the desired grade(s). These materials must be sorted and hauled away for disposal. Impacts associated with such materials can be expected to be comparable to those arising from the comparable materials in waste originally destined for landfilling or incineration. Transport to remanufacturing sites: Impacts associated with transport of sorted material to remanufacturing sites will be a function of both distance and quantity (weight and/or volume). Generalizations are difficult to provide, given that transportation distances vary widely. Recycling mills tend to be (but are not always) located near urban centers, but may draw in material from a considerable radius. While one might expect transportation distances to be greater than for landfilled or incinerated waste, long-distance waste transport (e.g., interstate) for purposes of disposal is quite common. 43
51 Remanufacturing: Impacts arising from remanufacturing using recovered paper include energy use, solid waste outputs (e.g., deinking sludge), and direct releases of air emissions and waterborne wastes from production processes. Where heavy metals are present in incoming recovered materials (e.g., from use of such inks and pigments), they will be present as contaminants in sludges produced from processing the recovered paper, and depending on how such sludge is managed, they can pose environmental risks. The use of heavy metals in inks and pigments used in paper products has declined considerably, and along with it the levels of heavy metals in sludges produced by recycled pulp and paper mills. (Data on this point are reviewed in White Paper 10A.) Chemicals used in production processes (e.g., surfactants and other deinking chemicals) can be additional contaminants in discharges from such operations. Such impacts need to be evaluated in direct comparison to the analogous impacts associated with the virgin manufacturing process for which it substitutes. Data on energy use and environmental releases associated with virgin and recovered paper manufacturing processes are presented in the next section of this paper; a more detailed examination is provided in White Papers 10A and B for various grades of paper. 44
52 IV. Presentation of Comparative Data Several recent studies 57 have compared recovery and recycling of various components of MSW to landfilling and incineration of MSW across one or more environmental parameters: solid waste output, energy use, and release of air emissions or waterborne wastes. While these studies typically focus on management of mixed MSW in comparison to recovery and recycling of mixed recyclable materials, in some cases the data can be sufficiently disaggregated or adjusted to allow the comparison to examine management of a specific grade of paper. This section will review and analyze the available data, presenting data on each parameter for management and production of each of the following grades of paper: newsprint, office paper, corrugated containers, and paperboard used in folding cartons. In general, a "system-wide" view will be adopted in making such comparisons. To illustrate this principle: Our evaluation of solid waste outputs associated with each recovery or waste management option will take into account not only the amounts of material managed and residues remaining to be disposed of after use of each option, but also solid waste arising from other activities that are necessary to managing the material. For example, fuel used to power landfill equipment is obtained through processes that generate solid waste (e.g., oil drilling and extraction create solid wastes); an amount of these solid wastes corresponding to the amount of fuel used by landfilling equipment can and should be assigned to landfilling. Methods that require more fuel, therefore, will be assigned a proportionately higher amount of solid waste related to fuel acquisition. Our quantitative analysis will include two types of activities occurring outside the immediate material recovery and waste management systems themselves, in order to provide a full understanding of environmental impacts associated with the various options for managing used paper: (1) To account for the energy generated by incineration of paper-based materials in MSW, a credit is assigned that represents the amount of energy that would otherwise need to be generated, typically at an electric utility. This "credit" offsets all four categories of environmental impacts examined here (solid waste, air emissions and waterborne wastes, as well as energy use) that are associated with producing an equivalent amount of energy at the utility. (2) To account for differences in fiber acquisition and manufacturing processes that use virgin fiber versus recovered paper, we will assemble the components of three alternative complete systems that each account for the full lifecycle of paper: (a) "Virgin production plus landfilling:" acquisition of virgin fiber, and manufacture of virgin paper, followed by landfilling; 45
53 (b) "Virgin production plus incineration:" acquisition of virgin fiber, and manufacture of virgin paper, followed by incineration; and (c) "Recycled production plus recycling:" manufacture of recycled paper, followed by recycling collection, processing and transport of used paper to the site of remanufacture. (White Papers 10A, B and C, which present environmental comparisons of virgin vs. recovered pulp and paper manufacturing for various grades of paper, provide the basis for the manufacturing-related data used in this paper; these papers provide full documentation and much more detail on these topics than will be presented here.) To illustrate the effect of including these additional activities, we will present the data in two contexts: A "base case," limited to only those activities that lie within the MSW management system itself. A "system-wide view" that includes the base case plus: the appropriate credits assigned to incineration due to energy generation; and the impacts associated with acquiring and manufacturing paper with virgin fiber (for landfilling and incineration) and with recycled fiber (for recycling collection, processing and transport). A. Solid Waste Output 1. Activities Within the Waste Management and Material Recovery Systems A range of activities associated with used paper management can result in the output of solid waste. These include: For landfilling: solid waste generated during the acquisition of fuels used by MSW collection vehicles and landfill equipment (e.g., oil drilling wastes); the used paper that is itself landfilled; and sludge generated by treatment of landfill leachate. For incineration: solid waste generated during the acquisition of fuels used by MSW collection vehicles; solid waste generated during the acquisition of fuels used by utilities to generate the electricity used to operate incinerator equipment, as well as utility-related wastes (e.g., coal ash); the ash residue and scrubber wastes that are outputs of the combustion process; and solid waste generated during the acquisition of fuels used by ash transport vehicles and ash landfill equipment. 46
54 For recycling: solid waste generated during the acquisition of fuels used by recycling collection vehicles; solid waste generated during the acquisition of fuels used by utilities to generate electricity used to operate recovered paper processing equipment, as well as utility-related wastes (e.g., coal ash); reject materials from recovered paper processing; solid waste generated during the acquisition of fuels used by residuals transport vehicles and residuals landfill equipment; and solid waste generated during the acquisition of fuels used by vehicles transporting processed recovered paper to market. One other activity outside the immediate recovery and waste management system results in a reduction in solid waste output attributable to the incineration option: For incinerators where energy is generated, the electricity (or steam) generated can be viewed as displacing the solid waste associated with producing the same amount of electricity (or steam) at the utility. A recent study conducted by Franklin Associates for Keep America Beautiful 58 provides a relatively comprehensive framework for examining solid waste outputs associated with landfilling and incineration of MSW and recycling of mixed recyclables collected in a residential curbside collection program. Relevant assumptions of the study for MSW and mixed recyclables are as follows (see below for a description of adjustments made to these assumptions for application to various grades of used paper): There is no recovery of landfill gas for energy generation; while some landfills do engage in this practice, most do not, so this assumption best typifies current practice (the energy potential of landfill gas recovery was discussed in Section III); mass-burn incinerator technology (which is the dominant technology in use today) is assumed, electricity rather than steam is the energy product, and about 12.5% of generated electricity is used internally to run the process; ash is assumed to represent 20% by weight of MSW entering the incinerator, which when adjusted for the typical 25% moisture content of the ash as it leaves the incinerator, results in 534 pounds of ash per ton of MSW burned; ash is assumed to be disposed of in a landfill; residential recyclables (including ONP) are collected commingled through a curbside collection program, f and are separated and processed at a materials recovery facility (MRF) g that is assumed to employ an average of the technologies used at high-tech and low-tech MRFs; 59 f Because of greater availability of data, our quantitative comparison will be based on collection of recovered paper through residential curbside collection programs. We recognize that other types of systems (e.g., drop-off centers and collection from commercial sources) contribute significantly to total paper recovery. This assumption of curbside collection probably overstates the energy use and associated environmental impacts associated with collection of paper, especially for grades such as OCC and OWP that are collected largely from commercial sources through more efficient systems (see Section B.4 below). g Our analysis assumes that all recovered paper is processed at material recovery facilities (MRFs). Because much recovered paper, especially that from commercial sources, bypasses such intermediate processing and is delivered 47
55 the amount of material rejected at the MRF and sent to landfill is 8% by weight of the incoming commingled recyclables; and processed recyclables are shipped to end markets by a mix of truck and rail and over distances chosen as typical for a given material. We have adjusted the Franklin Associates data in several ways to provide estimates of solid waste outputs for managing each of the grades of used paper we examine here: For the landfilling option, no adjustments have been made to the Franklin Associates data: Landfilling activities yielding solid waste -- wastes associated with fuels used by collection vehicles and landfill equipment, and the waste material that is actually landfilled -- are expected to be essentially identical per ton of MSW and ton of used paper contained in MSW, regardless of paper grade. For the incineration option, collection-related solid waste data have not been adjusted. However, several other adjustments were made for each grade of paper: The amount of ash generated per ton of MSW burned was adjusted to account for the different amounts of ash expected from each grade of paper relative to MSW, which is a function of both the inorganic content of the paper (e.g., coatings and fillers; contaminants) and the extent of combustion of the organic content of the paper (which indicates the combustion efficiency of the incinerator). All ash quantities are presented on a dry-weight basis. The adjustments made and the basis for them are presented in Table B-1 of Appendix B. Ash content of OWP is substantially higher than the other grades, due to the inclusion of inorganic content (fillers and/or coatings). The amount of utility-associated wastes displaced as a result of energy generation by incineration was adjusted to account for the different energy contents of each grade of paper relative to MSW. The adjustments made and the basis for them are presented in Table B-2 of Appendix B. All the grades examined here have energy contents appreciably higher than typical MSW, with ONP having the highest. The amount of fuel-related solid waste associated with ash transport and disposal was adjusted to account for the different amounts of ash expected from each grade of paper relative to MSW, calculated as described above. Here, however, the wet weights of ash (assuming 25% moisture content) were used in adjusting the solid waste amounts; this is because the solid waste results from fuel use in transport vehicles and ash landfill equipment, which is a function of total weight carried, not just dry weight. For the recycling option, the solid waste data developed by Franklin Associates for recyclables collection, MRF processing, MRF reject rate and residuals transport and disposal were assumed to apply to each grade of used paper and hence were used directly. Except for reject rate, these activities are essentially a function of the weight of material handled, so there was no basis for allocating them differently to paper or a specific grade directly to the site of remanufacture, this assumption probably overstates energy use associated with the recycling option. 48
56 of paper than to recyclables generally. 60 No independent data on reject rates specific for paper or individual grades of paper were identified, so the 8% rate assumed for mixed recyclables was retained. For transport of recovered paper to sites of remanufacture, we used Franklin Associates' estimate of the typical transport distance for ONP (150 miles) and the mix of transport modes (60% by truck, 40% by rail), and we applied these same estimates to the other grades as well, due to the absence of data on which to base an alternative assumption. 2. Activities Involved in Fiber Acquisition and Manufacturing In order to provide an accounting of solid waste outputs across the full lifecycle for each of the systems involving landfilling, incineration and recycling, we supplemented the data on solid waste outputs from the waste management and material recovery activities described above with estimates of solid waste output arising from the following additional activities: For virgin paper production, solid waste arises from the process of acquiring virgin fiber (primarily solid waste arising from acquiring fuels used in harvesting trees and transporting logs to the mill). We have identified estimates of fuel requirements for harvesting equipment and transport vehicles and have calculated the amount of associated solid waste, based on the amount of fuel used per ton of trees and the number of tons of trees required to make a ton of each of the grades of paper considered here. (This quantity is denoted using the label "tree harvest/transport" under the landfill and incineration system activities included in Figure 1 below.) In the course of both virgin and recycled manufacturing, solid waste is generated, both directly from the manufacturing processes (e.g., wastewater treatment sludges) and as a result of on-site energy generation (whether using wood-derived or purchased fuels). We developed estimates of total solid waste production for mills producing each of the virgin and recycled grades considered here, based on several recent paper industry surveys and other reports. 61 All manufacturing-related solid waste data are presented on a dry-weight basis. This solid waste is assigned to the virgin manufacturing component of the landfilling and incineration options, and the recycled manufacturing component of the recycling option. Solid waste is also generated in producing purchased electricity used in the virgin and recycled manufacturing processes, which is typically obtained from a utility; this solid waste is generated off-site, and is therefore not accounted for under the virgin and recycled manufacturing components of our analysis. Hence, we assign to each option an amount of solid waste corresponding to that associated with producing the amount of purchased electricity it uses (this quantity is referred to in Figure 1 below using the heading "electric utility"). 49
57 3. Results a) Comparison of Recycled Production plus Recycling to Virgin Production plus Landfilling and Virgin Production plus Incineration Figure 1 displays the output of solid waste (or the amount of solid waste displaced, which is shown as a negative value), per ton of paper processed, for each of the paper grades examined and for each of the component activities that comprise the systems involving landfilling, incineration and recycling. (These data are also presented in tabular form for each grade, along with assumptions and references, in Appendix C, and in chart form comparing all of the grades in Appendix D.) Several things are apparent from this figure: For all three methods, only very low amounts of solid waste result from acquisition and use of fuels and electricity in the transport-related activities (collection of MSW or recovered paper, transport of residual ash or MRF rejects, transport of processed recovered paper to end markets) and in the material-handling activities (processing equipment, landfilling equipment). The energy generated by incineration yields a substantial solid waste "credit" (about pounds per ton of used paper incinerated) because the energy produced means that less energy, along with its associated solid waste (e.g., coal ash), has to be produced by an electric utility; nevertheless, for every ton of used paper incinerated, a net output of solid waste results in each case, ranging from about 400 pounds per ton for corrugated to about 1,000 pounds per ton for office paper. For newsprint and SBS paperboard, the virgin manufacturing processes use more or comparable purchased electricity compared to using recovered paper, and hence generate more or comparable utility solid waste. In contrast, the virgin manufacturing processes for corrugated, office paper and CUK paperboard use less purchased electricity in manufacturing, and hence generate less utility solid waste, than the corresponding processes using recovered paper. For newsprint, office paper and CUK paperboard, the virgin fiber manufacturing process itself produces less solid waste than does its recycled counterpart, while for corrugated and SBS paperboard, a comparable amount or more solid waste results from the virgin processes. Figure 2 summarizes solid waste outputs for each grade of paper from each of the three systems, both from the limited view of the material recovery and waste management systems (panel B) and from the system-wide view that includes solid waste from virgin fiber acquisition, manufacturing processes and electric utilities (panel A). From both perspectives, virgin production plus landfilling yields the largest amount of solid waste by a large margin. From the system-wide perspective, virgin production plus incineration produces the least solid waste for four of the five grades; its margin over recycled production plus recycling is modest, however, at most 200 pounds per ton managed (i.e., about 10% of the weight of the used paper managed). From the more limited perspective of the recovery and waste management systems, recycling 50
58 Figure 1A: NEWSPRINT Solid Waste Outputs from Individual Production and Management Activities Pounds per ton of paper managed ,000 1,500 2,000 2,500 3,000 Tree Harvest/Transport 0.6 Virgin Manufacturing Electric Utility Collection/LF Equipment 0.3 Landfill 2,000 LANDFILL TOTAL 2,876 Tree Harvest/Transport 0.6 Virgin Manufacturing Electric Utility Collection 0.1 Combustion 18 Avoided Electric Utility Ash Disposal 2 INCINERATION TOTAL Collection 0.5 MRF Processing Residue Disposal Transport to Market Electric Utility Recycled Manufacturing RECYCLING TOTAL 1,
59 Figure 1B: CORRUGATED Solid Waste Outputs from Individual Production and Management Activities Pounds per ton of paper managed ,000 1,500 2,000 2,500 3,000 Tree Harvest/Transport 0.8 Virgin Manufacturing Electric Utility Collection/LF Equipment 0.3 Landfill 2,000 LANDFILL TOTAL 2,334 Tree Harvest/Transport 0.8 Virgin Manufacturing Electric Utility Collection 0.1 Combustion 18 Avoided Electric Utility Ash Disposal 2 INCINERATION TOTAL Collection 0.5 MRF Processing Residue Disposal Transport to Market Electric Utility Recycled Manufacturing RECYCLING TOTAL
60 Figure 1C: OFFICE PAPER Solid Waste Outputs from Individual Production and Management Activities Pounds per ton of paper managed ,000 1,500 2,000 2,500 3,000 Tree Harvest/Transport 1.0 Virgin Manufacturing Electric Utility Collection/LF Equipment 0.3 Landfill 2,000 LANDFILL TOTAL 2,613 Tree Harvest/Transport 1.0 Virgin Manufacturing Electric Utility Collection 0.1 Combustion 50 Avoided Electric Utility Ash Disposal 5 INCINERATION TOTAL 1,005.3 Collection 0.5 MRF Processing Residue Disposal Transport to Market Electric Utility Recycled Manufacturing RECYCLING TOTAL 1,
61 Figure 1D: CUK PAPERBOARD Solid Waste Outputs from Individual Production and Management Activities Pounds per ton of paper managed ,000 1,500 2,000 2,500 3,000 Tree Harvest/Transport 0.9 Virgin Manufacturing Electric Utility Collection/LF Equipment Landfill 2,000 LANDFILL TOTAL 2,281 Tree Harvest/Transport 0.9 Virgin Manufacturing Electric Utility Collection Combustion Avoided Electric Utility Ash Disposal 2 INCINERATION TOTAL Collection 0.5 MRF Processing Residue Disposal Transport to Market Electric Utility Recycled Manufacturing 21 RECYCLING TOTAL 58 54
62 Figure 1E: SBS PAPERBOARD Solid Waste Outputs from Individual Production and Management Activities Pounds per ton of paper managed ,000 1,500 2,000 2,500 3,000 Tree Harvest/Transport 1.0 Virgin Manufacturing Electric Utility Collection/LF Equipment 0.3 Landfill 2,000 LANDFILL TOTAL 2,624 Tree Harvest/Transport 1.0 Virgin Manufacturing Electric Utility Collection 0.1 Combustion Avoided Electric Utility Ash Disposal 2 INCINERATION TOTAL Collection 0.5 MRF Processing Residue Disposal Transport to Market Electric Utility Recycled Manufacturing 21 RECYCLING TOTAL 58 55
63 Figure 2: Solid Waste Output for Paper Production and Management A: System-Wide View Newsprint Corrugated Office Paper Paperboard/CUK Paperboard/SBS Pounds per ton of paper managed Virgin Production plus Landfilling Virgin Production plus Incineration Recycled Production plus Recycling B: Solid Waste Output from the Waste Management and Material Recovery Systems Only Newsprint Corrugated Office Paper Paperboard/CUK Paperboard/SBS Landfilling Incineration Recycling Pounds per ton of paper managed 56
64 and incineration of newsprint and corrugated result in essentially the same amount of solid waste, while recycling of the other grades results in substantially less solid waste than incineration. b) Comparison of Recycled Production plus Recycling to the Virgin Production plus Composite Waste Management System Figure 2X presents the comparison between recycled production plus recycling and the virgin production plus composite waste management system, again both from the limited view of the recovery and waste management systems (panel B) and from the system-wide view (panel A). (These data, along with data showing solid waste output from each component activity of each system, are also presented in tabular and graphic form for each grade, along with assumptions and references, in Appendix C, and in chart form comparing all of the grades in Appendix D.) From both perspectives, recycled production plus recycling results in lower solid waste output than does virgin production plus waste management, for all grades of paper examined here. B. Energy Use [NOTE: As a context for understanding the magnitude of the energy values provided in this section, the average annual residential energy consumption per household has been estimated to be about 100 million Btus. 62 ] As with solid output, energy is used in many different component activities associated with the lifecycle systems involving landfilling, incineration and recycling. Energy may be used in several different forms: as fuel consumed by vehicles or equipment (e.g., diesel oil); as fuel burned to generate electricity or steam (e.g., coal); and as electricity (typically purchased from an off-site utility) used to operate equipment. To provide a consistent basis for comparing energy use, all energy data presented here will be reported in terms of useable electric energy expressed in British thermal units (Btus); that is, whether energy is consumed or generated in the form of fuel (typically fossil fuel) or electricity, all values will be converted to the equivalent amount of electric energy. This is done using a typical heat rate (Btus per kilowatt-hour) representative of all types of electric generating facilities based on the mix of different energy sources (coal, oil, gas, hydropower, nuclear) that provide electric energy to the national grid. 63 In examining energy use, we considered both total energy -- that generated from combustion of all types of fuels, including fuels derived from wood by-products (bark, and pulping liquors at pulp mills and paper in incinerators), as well as electricity purchased from 57
65 Figure 2X: Solid Waste Output for Paper Production and Management A: System-Wide View Newsprint Corrugated Office Paper Paperboard/CUK Paperboard/SBS Pounds per ton of paper managed Virgin Production plus Waste Management Recycled Production plus Recycling B: Solid Waste Output from the Waste Management and Material Recovery Systems Only Newsprint Corrugated Office Paper Paperboard/CUK Paperboard/SBS Waste Management Recycling Pounds per ton of paper managed 58
66 utilities -- and purchased energy which represents only energy generated from combustion of purchased fossil fuels (that is, excluding combustion of wood-derived materials) and purchased electricity. Purchased electricity may be generated by a variety of energy sources, including fossil fuels (coal, oil, natural gas), nuclear power and hydropower -- each of which has its own set of associated environmental impacts. On a national level, about 68% of electricity is produced from combustion of fossil fuels. 64 In our analysis, therefore, we have also indicated the amount of energy used in the virgin and recycled systems that is fossil fuel-derived. The relative consumption of fossil fuels by the different systems is an important environmental consideration: Consumption of fossil fuels contributes to the depletion of a natural resource, while fossil fuel extraction and transportation can also damage natural resources through mining activities (for example, strip-mining for coal) and accidental releases of raw fuels or other pollutants to the environment (for example, oil spills, refinery explosions, leaks from natural gas pipelines). Fossil fuel extraction, refinement and combustion also require energy and entail releases to the environment; estimates of these environmental parameters have been incorporated directly into our quantitative analysis. In our analysis, the difference between the amounts of total and purchased energy used by a system represents the amount of energy generated from wood-derived fuels (bark, pulping liquors and used paper). For several of the paper grades we examined, the virgin fiber-based system uses more total, but less purchased, energy than the recycled fiber-based system (see below). Such a system consumes less fossil fuel and hence entails fewer of the environmental impacts just described; but it also consumes greater wood resources, which has environmental implications with respect to forest management that are discussed in White Paper Activities Within the Waste Management and Material Recovery Systems Activities that are responsible for the consumption of energy in used paper management include the following: For landfilling: energy consumed during the acquisition of fuels used by MSW collection vehicles and landfill equipment; and energy represented by the fuels themselves. For incineration: energy consumed during the acquisition of fuels used by MSW collection vehicles; energy consumed during the acquisition of fuels used by utilities to generate the electricity used to operate incinerator equipment, as well as energy represented by the fuels actually consumed by the utility; energy consumed to operate the incinerator and associated equipment; and energy consumed during the acquisition of fuels used by ash transport vehicles and ash landfill equipment, as well as the energy represented by the fuels themselves. 59
67 For recycling: energy consumed during the acquisition of fuels used by recycling collection vehicles; energy consumed during the acquisition of fuels used by utilities to generate electricity used to operate recovered paper processing equipment, as well as energy represented by the fuels actually consumed by the utility; energy in the form of fuels consumed by equipment used to process recovered paper; energy consumed during the acquisition of fuels used by residuals transport vehicles and residuals landfill equipment, as well as the energy represented by the fuels themselves; and energy consumed during the acquisition of fuels used by vehicles transporting processed recovered paper to market, as well as the energy represented by the fuels themselves. One other activity outside the immediate recovery and waste management systems reduces energy use: For incinerators where energy is generated (and, though not considered here, for landfills where landfill gas is recovered for energy), the electricity (or steam) generated can be viewed as displacing the energy associated with producing the same amount of electricity (or steam) at a utility. The distinction discussed above between total and purchased energy is relevant in assessing energy generation associated with incineration of used paper. Because the electricity generated by burning paper displaces utility-generated electricity, making it available for purchase by another user, it is "credited" against the purchased energy requirements of the incineration option; moreover, because it is generated from paper and not fossil fuels, this electricity is also credited against the fossil fuel-derived energy requirements of the incinerator option. The recent Franklin Associates study compares energy requirements for various component activities associated with landfilling, incineration and recycling. Relevant assumptions of the study are as follows (see below for a description of adjustments made to these for various grades of used paper): There is no recovery of landfill gas for energy generation; while some landfills do engage in this practice, most do not, so this assumption best typifies current practice (the energy potential of landfill gas recovery was discussed in Section III); energy involved in acquiring and transporting landfill cover materials is not included; mass-burn incinerator technology (which is the dominant technology in use today) is assumed, electricity rather than steam is the energy product, and about 12.5% of generated electricity is used internally to run the process; this internally-used energy is part of the purchased energy credit assigned to the incinerator option, but is treated as a debit with respect to total energy use. 480 kilowatt-hours of electricity generated by a utility is assumed to be displaced by combusting one ton of MSW in an incinerator, after accounting for internal electricity use; 65 recyclables (including ONP) are collected commingled through a curbside program, and are separated and processed at a materials recovery facility (MRF) that is assumed to employ an average of the technologies used at high-tech and low-tech MRFs; 66 and processed recyclables are shipped to end markets by a mix of truck and rail and over distances chosen as typical for a given material. 60
68 We have adjusted the Franklin Associates data in several ways to provide estimates for energy use specific to managing each of the grades of used paper we examine here: For landfilling, no adjustments have been made to the Franklin Associates data: Landfilling activities requiring energy -- use of fuels by collection vehicles and landfill equipment -- are expected to be essentially identical per ton of MSW and ton of used paper contained in MSW, regardless of paper grade. For incineration, collection-related energy data have not been adjusted. However, two other adjustments were made, specific to each grade of paper: The amount of energy generated per ton of material burned was adjusted to account for the different energy contents of each grade of paper relative to MSW. The adjustments made and the basis for them are presented in Table B-2 of Appendix B. All the grades examined here grades have energy contents appreciably higher than typical MSW, with ONP having the highest. As indicated, above this generated energy is accounted for as a credit for the incineration option, for both total and purchased energy. The amount of energy required to transport and dispose of the ash produced by incineration was adjusted to account for the different amounts of ash expected from each grade of paper relative to MSW, as discussed above and detailed in Table B-1 of Appendix B. Ash content of OWP is substantially higher than the other grades, due to the inclusion of inorganic content (fillers and/or coatings). Here again, the wet weights of ash (assuming 25% moisture content) were used in adjusting the ash transport and disposal energy requirements, for the reasons discussed previously. For recycling, the energy data developed by Franklin Associates for recyclables collection, MRF processing, and residuals transport and disposal were assumed to apply to each grade of used paper. These activities are essentially a function of the weight of material handled, so there was no basis for allocating them differently to paper or a specific grade of paper than to mixed recyclables. 67 For energy required to transport recovered paper to sites of remanufacture, we again retained Franklin Associates' estimate of the typical transport distance for ONP (150 miles) and the mix of transport modes (60% by truck, 40% by rail), and applied these same estimates to the other grades as well, due to the absence of data on which to base an alternative assumption. 2. Activities Involved in Fiber Acquisition and Manufacturing In order to provide an accounting of energy use across the full lifecycle for each of the systems involving landfilling, incineration and recycling, we supplemented the data on energy use associated with the waste management and material recovery activities described above with estimates of energy use arising from the following additional activities: For virgin paper production, energy is used to acquire the virgin raw material, specifically, the energy expended in harvesting trees and transporting logs to the mill. We have 61
69 developed per-ton estimates of energy requirements for these activities (primarily in the form of fuel use for harvesting equipment and transport vehicles), based on the amount of fuel used per ton of trees and the number of tons of trees required to make a ton of each of the grades of paper. This energy requirement, which is avoided by using secondary materials in place of virgin fiber, is assigned to the virgin production component for the landfilling and incineration options. (This quantity of energy is denoted using the label "tree harvest/transport" under the landfilling and incineration system activities included in Figure 3 below.) Energy is used in both virgin and recycled manufacturing processes, and is assigned to the virgin manufacturing component of the landfilling and incineration options, and the recycled manufacturing component of the recycling option. Pulp and paper mills use a variety of sources for energy. Virgin pulp mills generate a substantial portion of their energy needs by burning wood residues (e.g., bark) and (for chemical pulp mills) pulping liquors, thereby reducing their use of fossil fuels. 68 Recycled pulp mills do not generate such fuel sources, and therefore generally must purchase most or all of their energy, either in the form of fossil fuels or electricity generated largely from fossil fuels (or both). The relative amounts of purchased vs. self-generated energy vary not only with recycled vs. virgin pulp, but also with paper grade, mill site, company, and geographic location. We developed estimates for both total and purchased energy in manufacturing for the grades examined here, based on several recent paper industry surveys and other reports. Details of the derivation of these estimates are provided in White Papers 10A (for newsprint and office papers), 10B (for corrugated containers) and 10C (for paperboard). 3. Results a) Comparison of Recycled Production plus Recycling to Virgin Production plus Landfilling and Virgin Production plus Incineration Figure 3 displays the amount of total, purchased and fossil fuel-derived energy required (or the amount of energy generated, which is depicted as a negative value), per ton of paper processed, for each of the grades of paper examined and for each of the activities described above that comprise the systems involving landfilling, incineration and recycling. (These data are also presented in tabular form for each grade, along with assumptions and references, in Appendix C, and in chart form comparing all of the grades in Appendix D.) The data indicate the following: For all three systems, manufacturing represents the largest use of all three types of energy by a large margin. Substantial energy (7-8 million Btus per ton) is generated by incineration of all of the grades of paper; all of this energy is derived from combustion of paper, and hence offsets both purchased and fossil fuel-derived energy for the system involving incineration. 62
70 Figure 3A: NEWSPRINT -- Total, Purchased and Fossil Fuel Energy Use from Individual Production and Management Activities Million Btus per ton of paper managed Tree Harvest/Transport Virgin Manufacturing Collection LF Equipment MSW Landfill LANDFILL TOTAL Tree Harvest/Transport Virgin Manufacturing Collection Combustion Process Waste Handling Energy Generation Ash Transport Ash Disposal INCINERATION TOTAL Collection MRF Process Residue Disposal Transport to Market Recycled Manufacturing RECYCLING TOTAL 63
71 Figure 3B: CORRUGATED -- Total, Purchased and Fossil Fuel Energy Use from Individual Production and Management Activities Million Btus per ton of paper managed Tree Harvest/Transport Virgin Manufacturing Collection LF Equipment MSW Landfill LANDFILL TOTAL Tree Harvest/Transport Virgin Manufacturing Collection Combustion Process Waste Handling Energy Generation Ash Transport Ash Disposal INCINERATION TOTAL Collection MRF Process Residue Disposal Transport to Market Recycled Manufacturing RECYCLING TOTAL 64
72 Figure 3C: OFFICE PAPER -- Total, Purchased and Fossil Fuel Energy Use from Individual Production and Management Activities Million Btus per ton of paper managed Tree Harvest/Transport Virgin Manufacturing Collection LF Equipment MSW Landfill LANDFILL TOTAL Tree Harvest/Transport Virgin Manufacturing Collection Combustion Process Waste Handling Energy Generation Ash Transport Ash Disposal INCINERATION TOTAL Collection MRF Process Residue Disposal Transport to Market Recycled Manufacturing RECYCLING TOTAL 65
73 Figure 3D: CUK PAPERBOARD -- Total, Purchased and Fossil Fuel Energy Use from Individual Production and Management Activities Million Btus per ton of paper managed Tree Harvest/Transport Virgin Manufacturing Collection LF Equipment MSW Landfill LANDFILL TOTAL Tree Harvest/Transport Virgin Manufacturing Collection Combustion Process Waste Handling Energy Generation Ash Transport Ash Disposal INCINERATION TOTAL Collection MRF Process Residue Disposal Transport to Market Recycled Manufacturing RECYCLING TOTAL 66
74 Figure 3E: SBS PAPERBOARD -- Total, Purchased and Fossil Fuel Energy Use from Individual Production and Management Activities Million Btus per ton of paper managed Tree Harvest/Transport Virgin Manufacturing Collection LF Equipment MSW Landfill LANDFILL TOTAL Tree Harvest/Transport Virgin Manufacturing Collection Combustion Process Waste Handling Energy Generation Ash Transport Ash Disposal INCINERATION TOTAL Collection MRF Process Residue Disposal Transport to Market Recycled Manufacturing RECYCLING TOTAL 67
75 Energy required to harvest and transport trees in the systems based on virgin fiber is the next highest use of energy. This energy use is especially significant for the grades made from chemical pulps, which require considerably more wood per ton of paper than does newsprint made from mechanical pulp, due to lower fiber yield from chemical compared to mechanical pulping processes. Transport of processed paper to end markets consumes a relatively small amount of energy (even under the assumption used here that such materials are not backhauled by vehicles used to transport other goods or materials). While collection energy is small in comparison to energy use in manufacturing, the collection energy for recycling is estimated by Franklin Associates to be much (over 3- fold) higher than that for landfilling and incineration. (The identical collection energy seen for landfilling and incineration reflects the fact that they both involve the collection of essentially the same material.). This reflects an underlying assumption that collecting recyclables requires more trucks (and hence more fuel) than collecting the same weight of MSW. This in turn is due largely to: (a) the fact that trucks generally fill up by volume before they reach any applicable weight restrictions, and (b) the ability of packer trucks used to collect MSW to compact it to high density, in contrast to trucks used to transport uncompacted commingled recyclables. Indeed, Franklin Associates assumes that a typical packer truck used to collect MSW can carry 7.5 tons, while a truck collecting recyclables carries only 1.8 tons. 69 These assumptions have been questioned by some observers, 70 however, and may particularly overstate collection energy for paper, which has a considerably higher density than the mixed recyclables modeled by Franklin Associates. (See further discussion of this assumption in the section below discussing other studies.) Running the incinerator requires about 3 times more energy per ton of material processed than running landfilling or MRF processing equipment; this reflects the generally capitaland technology-intensive nature of incineration. Because this energy requirement is met using some of the energy generated by the incinerator from burning used paper (and other materials), rather than purchased fuels, it represents a use of total, but not purchased or fossil fuel-derived, energy. Relatively low amounts of energy are required to dispose of residuals from incineration and recycling. Figure 4 summarizes net total, purchased and fossil fuel-derived energy for the three management methods as applied to the five paper grades. When the view is restricted to energy use within the waste management and material recovery systems themselves (panel B), recycling is found to use more total, and especially purchased and fossil fuel-derived, energy than the other options. Landfilling uses the least total energy, while incineration uses the least purchased and fossil fuel-derived energy, for all of the paper grades. When viewed from a system-wide basis, however, a different picture emerges. For all of the grades of paper, recycling uses the least total energy of the three options. Under the assumptions of this study, using a ton of recovered paper as a substitute for virgin fiber reduces total energy of manufacturing by 8.8 to 23.4 million Btus, a reduction that is larger by 1.7 to 15.5 million Btus than the energy generated by incinerating a ton of the same paper grade. Across the 68
76 Figure 4: Energy Use for Paper Production and Management A: System-Wide View NEWSPRINT CORRUGATED OFFICE PAPER CUK PAPERBOARD SBS PAPERBOARD Total Purchased Fossil Fuel Total Purchased Fossil Fuel Total Purchased Fossil Fuel Total Purchased Fossil Fuel Total Purchased Fossil Fuel Million Btus per ton of paper managed Virgin Production plus Landfilling Virgin Production plus Incineration Recycled Production plus Recycling 69
77 B: Solid Waste Output from the Waste Management and Material Recovery Systems Only NEWSPRINT CORRUGATED OFFICE PAPER CUK PAPERBOARD SBS PAPERBOARD Total Purchased Fossil Fuel Total Purchased Fossil Fuel Total Purchased Fossil Fuel Total Purchased Fossil Fuel Total Purchased Fossil Fuel Million Btus per ton of paper managed Landfilling Incineration Recycling 70
78 full lifecycle of paper, virgin production plus incineration uses 76-84% as much total energy as is used by virgin production plus landfilling, while recycled production plus recycling uses 42-67%. Purchased and fossil fuel-derived energy follow a somewhat different pattern. For newsprint, all of the energy used by the recovered fiber manufacturing process, and most of the energy used by the virgin manufacturing process, is purchased. Mechanical pulping processes used to produce virgin newsprint use considerable amounts of energy, primarily in the form of purchased electricity. ONP deinking is much less energy-intensive. Hence, despite the considerable energy generated by incinerating ONP, on a net basis recycled production plus recycling requires less purchased and slightly less fossil fuel-derived (as well as total) energy than does virgin production plus incineration. Manufacturing recycled paperboard requires slightly less purchased and fossil fuelderived energy than does manufacturing SBS paperboard using virgin fiber, while recycled manufacturing for the other three grades requires more. Across the full lifecycle, once the energy generated by incineration of these grades (which represents a purchased and fossil fuelderived energy "credit") is considered, virgin production plus incineration requires less purchased and fossil fuel-derived energy than does recycled production plus recycling. This contrast to the situation seen with ONP is because much of the energy used to manufacture virgin paper in the other grades is not purchased, but rather generated by burning bark and other wood residues and pulping liquors produced as a result of the use of chemical rather than mechanical pulping. These virgin grades use much less (roughly half as much) purchased and fossil fuel-derived energy as is required for virgin newsprint. Moreover, as with ONP, the recovered fiber manufacturing processes for these grades must purchase all of the energy they use. Across the full lifecycle of newsprint, then, virgin production plus incineration uses 76% as much purchased energy as is used by virgin production plus landfilling, while recycled production plus recycling uses only 60%. But for the other grades, virgin production plus incineration uses less (48-64% as much) purchased energy than does virgin production plus landfilling, while recycled production plus recycling uses about as much or more (86-119%). b) Comparison of Recycled Production plus Recycling to the Virgin Production plus Composite Waste Management System Figure 4X presents the comparison between recycled production plus recycling and the virgin production plus composite waste management system, again both from the limited view of the recovery and waste management systems (panel B) and from the system-wide view (panel A). (These data, as well as data on energy use of each component activity that comprises each system, are also presented in tabular and graphic form for each grade, along with assumptions and references, in Appendix C, and in chart form comparing all of the grades in Appendix D.) From the system-wide perspective, recycled production plus recycling results in lower total energy use than does virgin production plus waste management, for all grades of paper examined here. Recycled production plus recycling requires less (for newsprint) or comparable 71
79 Figure 4X: Energy Use for Paper Production and Management A: System-Wide View NEWSPRINT CORRUGATED OFFICE PAPER CUK PAPERBOARD SBS PAPERBOARD Total Purchased Fossil Fuel Total Purchased Fossil Fuel Total Purchased Fossil Fuel Total Purchased Fossil Fuel Total Purchased Fossil Fuel Million Btus per ton of paper managed Virgin Production plus Waste Management Recycled Production plus Recycling 72
80 B: Solid Waste Output from the Waste Management and Material Recovery Systems Only NEWSPRINT CORRUGATED OFFICE PAPER CUK PAPERBOARD SBS PAPERBOARD Total Purchased Fossil Fuel Total Purchased Fossil Fuel Total Purchased Fossil Fuel Total Purchased Fossil Fuel Total Purchased Fossil Fuel Million Btus per ton of paper managed Waste Management Recycling 73
81 (for SBS paperboard) purchased and fossil fuel-derived energy than virgin production plus waste management. For the other three grades, however, the recycled-based system requires more purchased and fossil fuel-derived energy. From the limited view of the material recovery and waste management systems only. recycling uses more total, purchased and fossil fuel-derived energy than does waste management. But the energy used to collect, process and dispose of paper in MSW, or to collect, process and transport recovered paper, is low compared to the amount of energy generated by incinerating paper or the reduction in manufacturing energy due to using recycled rather than virgin paper. 4. Other Studies Several other recent studies have estimated energy requirements for landfilling, incinerating, and recycling one or more grades of paper. Tellus Institute conducted such a study for the New York State Energy Research and Development Authority, based largely on conditions associated with paper recovery and MSW management in and around New York City. 71 A study examining only certain aspects of paper incineration and recycling was done by Sound Resource Management Group, based on conditions in Ontario, Canada. 72 In addition, Argonne recently published studies examining manufacture and management of newsprint and unbleached kraft paper, the grade used in the linerboard component of corrugated containers. 73 Finally, the U.S. Department of Energy (DOE) commissioned a study by Stanford Research Institute (SRI), comparing management of MSW and mixed recyclables (not just paper), based on conditions in Palo Alto, CA; 74 it is included here to provide additional context. While the studies used different assumptions in many cases, and only allow a comparison based on total -- not purchased -- energy, it is useful to compare their figures for energy use associated with the three management options, energy generation from incineration, and the difference between energy use for the virgin and recycled fiber acquisition and manufacturing processes. Such a comparison for the three paper grades with comparable data -- newsprint, corrugated and office paper -- is shown in Table 6. Energy generation estimates for incinerators from the various studies are quite similar. The studies' estimates of reductions in energy resulting from acquiring and manufacturing using recovered rather than virgin fiber vary somewhat. SRMG's estimates are consistently higher than other studies except for an even higher estimate from Argonne for corrugated. (Argonne's estimate includes the tree harvesting and wood transport energy avoided by recycling, however, which is roughly equivalent to the difference between its and SRMG's estimates.) SRMG's recycling estimates are unique, however, in that they include a credit for the inherent energy value of the wood that is conserved by recycling, which explains much of the difference in its estimates. 75 Tellus' estimates are consistently the lowest, and for corrugated is dramatically lower than those of the other studies. However, the current analysis as well as an examination of estimates from other sources suggests that Tellus' estimate for the reduction in energy use associated with recycling corrugated is too low by a significant margin
82 TABLE 6: COMPARISON OF ESTIMATES DERIVED FROM THE ANALYSIS IN THIS PAPER AND SEVERAL OTHER RECENT STUDIES OF TOTAL ENERGY USE FOR THREE DISCARDED PAPER MANAGEMENT OPTIONS LANDFILLING PAPER COLLECTION/ PROCESSING RESIDUALS TOTAL GENERATION NET GRADE(S) TRANSPORT TRANSFER/ ENERGY OR ENERGY DISPOSAL USE REDUCTION Franklin/PTF (a) NP/CC/OP 296, , , ,400 Tellus NP/CC/OP 86, ,000 96, ,900 Argonne NP/CC 800, NA NA NA NA DOE/SRI MSW 79, ,000 81,000 NA NA INCINERATION Franklin/PTF (a) NP 296, ,800 35,600 1,115,000 (8,202,000) (7,087,000) CC 296, ,800 35,600 1,115,000 (7,176,800) (6,061,800) OP 296, , ,800 1,182,200 (7,176,800) (5,994,600) Tellus NP/CC/OP 69, ,600 3,100 1,015,150 NA NA SRMG NP 73,900 (b) NA 28,400 NA (7,257,400) NA CC 73,900 (b) NA 28,400 NA (6,349,795) NA OP 73,900 (b) NA 28,400 NA (7,076,051) NA Argonne NP 800,000 NA NA NA (7,900,000) (c) NA CC 800,000 NA NA NA (6,900,000) (c) NA DOE/SRI MSW 79, ,000 (d) ,300 NA NA RECYCLING Franklin/PTF (a) NP 989, ,700 42,200 1,313,900 (17,944,800) (e) (16,630,900) CC 989, ,700 42,200 1,313,900 (11,337,800) (e) (10,023,900) OP 989, ,700 42,200 1,313,900 (18,703,300) (e) (17,389,400) Tellus NP 58, ,600 18, ,000 (9,399,500) (e) (9,035,500) CC 58, ,600 18, ,000 (2,604,700) (e) (2,240,700) OP 58, ,600 18, ,000 (9,397,700) (e) (9,033,700) SRMG NP 73,900 (b) 129,800 NA NA (19,250,500) (f) NA CC 73,900 (b) 129,800 NA NA (19,670,800) (f) NA OP 73,900 (b) 129,800 NA NA (30,289,600) (f) NA Argonne NP 1,200,000 NA 30,000 1,230,000 (12,700,000) (e),(g) (11,470,000) CC 400,000 NA NA NA (22,200,000) (e) NA DOE/SRI mixed recyclables 230, ,000 20, ,000 NA NA All values are in Btu/ton of material processed NP = new sprint; CC = corrugated containerboard; OP = office paper; NA = not applicable or not available Values in parentheses reflect gross energy generated by incineration or net energy reduction due to manufacturing w ith recycled rather than virgin materials. Recycling energy values represent total energy and do not distinguish betw een purchased and self-generated energy. (a) figures are those reported in this White Paper (b) study assumes no net increase in collection energy for MSW vs. recyclable paper (c) adjusted using: (1) as-received rather than dry-w eight heat values for CC and NP, and (2) Argonne's estimate for thermal efficiency of existing incinerators of 16% (21,330 Btu/kWh); a higher efficiency (23%) for planned facilities w as also modeled by Argonne (d) corrected to reflect the equivalent useable electric energy production (i.e., the Btu value for the amount of utility-generated electric energy used or saved) (e) includes energy required to transport processed recyclables from a MRF to the point of remanufacture, and energy avoided by avoiding tree harvest and log transport to the mill (f) excludes energy required to transport processed recyclables from a MRF to the point of remanufacture, and energy avoided by avoiding tree harvest and log transport to the mill (but study estimates that energy required for MRF-to-mill transport is small, only about 1% of recycling's energy savings) (g) midpoint of the range of estimates provided in the study, w hich extends from a low of 6,800,000 to a high of 18,600,000; the variation is in energy assumed to be required for virgin new sprint manufacturing, w hich varies w ith assumptions for mill pow er generation efficiency and pulping energy required for softw ood vs. hardw ood. SOURCES: See Endnote
83 Major differences among the studies are found in their estimates of energy use. Argonne's and Franklin Associates' estimates for collection energy requirements are higher for all three options than those of the other studies. DOE estimates that recycling collection energy is about 2.5 times higher than collection energy for landfilling or incineration due to the smaller amounts collected per route; 77 the 2.5 ratio is not too different from Franklin Associates' (3.3), but Franklin Associates' actual value (989,000 Btus per ton) is more than 4 times higher than DOE's (230,000 Btus per ton). Curiously, Tellus estimates a slightly lower collection energy for recycling relative to landfilling or incineration; this may somewhat reflect conditions specific to New York City. One significant difference between the studies that may explain some of the difference in estimates for recycling collection energy is that the Tellus study (that with the lowest estimate of collection energy) is based on collection of commercial and institutional, as well as residential, recyclables, while the other studies model residential curbside collection only. Collection efficiencies are indeed higher for commercial collection of recyclables, for several reasons. 78 A larger quantity of material is typically collected at each stop of the collection vehicle. The density of collection points (i.e., distance between stops) is typically higher. Commerciallygenerated materials tend to be more compacted (and therefore occupy less volume) because they are more homogeneous, and in some cases are even preprocessed (e.g., baled) by the generator prior to collection. Finally, vehicles used for commercial collection frequently have the ability to compact materials they collect, an ability that is far less prevalent among residential collection vehicles. This difference between residential and commercial collection may also explain Argonne's 3-fold higher estimate for ONP collection energy compared to that for OCC (see Table 6). Processing energy requirements, while differing somewhat across studies, all nevertheless support the finding that processing a ton of material at an incinerator requires 2-3 times more energy than processing a ton of recovered material at a MRF. Estimates for transport and disposal of residuals were quite variable among the different studies, but also consistently the smallest component of energy use. All of the studies found energy use to be lowest for landfilling. All of the studies except Franklin Associates' found energy use to be highest for incineration; this difference is entirely attributable to Franklin Associates' much higher estimate for recycling collection energy, discussed above. Finally, energy use for all three options is quite low in comparison to the energy generated by incineration or the reduction in energy use resulting from recycling. C. Air Emissions and Waterborne Wastes Considerable caution must be exercised in interpreting data on air emissions and waterborne wastes. Data are generally much more scarce and of lesser quality than in the areas of solid waste and energy use. In addition, such data frequently (as is sometimes the case in the current analysis) do not represent actual measured releases, but rather regulatory limits, 76
84 engineering estimates, or other surrogates for actual values. Particularly where data are only presented or available for a class of chemicals or substances (e.g., suspended solids), different activities may generate releases of a given class of substances that differ dramatically in their composition and potential to cause adverse health or environmental impacts. Even where data are available for releases of the same chemical from different activities, such estimates may still not be directly comparable: they do not necessarily serve as a measure of actual environmental impact. Impacts depend not only on how much of a given chemical is released, but also at what rate, by what route (e.g., by a mobile source such as a truck vs. a point source such as an incinerator stack), and where (e.g., in a rural vs. urban setting). The fate of the release in the environment -- its rate of degradation, how it moves, whether it accumulates in particular environmental "sinks" are all important considerations in assessing impact. These major limitations should be kept in mind as this section is read. A very large number of individual chemical substances are present in air emissions and waterborne wastes arising from any of the three lifecycle systems considered here. For our purposes of comparing the options, the substances or groups of substances to be considered here represent only a limited subset of such chemicals. Those examined here are of environmental significance, due to known human or environmental health impacts associated with them, and are sufficiently characterized by available data so as to allow their quantification in relation to production and management of a particular quantity of a particular grade of paper. Of course, many other substances of environmental significance may be present in air emissions and waterborne wastes associated with these systems, and may be important even if they are not common to more than one option or cannot be expressed in terms of the quantity released per ton of material produced or managed. This limitation to the scope of the comparison presented below should be borne in mind. Even with such a limitation, however, numerous substances are still represented in the data to be presented. Because such substances act independently and in concert in the environment to produce various effects at various concentrations, there is no scientifically defensible way of aggregating them into a single or even a few values, as was the case for solid waste generation and energy use. Further, each of the component activities that comprise each of the lifecycle systems entails releases of air emissions and waterborne wastes. To avoid too much complexity in presenting this information without compromising the scientific integrity of the information, the detailed data will be presented in tabular form in Appendix C, and in chart form comparing all of the grades in Appendix D, but the figures that will serve as the basis for further discussion in this section will be based on a summation across the individual activities within a given option, for each grade of paper and for each of 6 (or in some cases 7) substances (or groups of substances) released to the air, and each of the following 3 (or in some cases 4) released to the water, as well as the amount of water used in manufacturing: 77
85 AIR EMISSIONS Net Greenhouse Gases (GHGs) Nitrogen Oxides Particulates Sulfur Oxides Hazardous Air Pollutants (HAPs)* Volatile Organic Chemicals (VOCs)* Total Reduced Sulfur (TRS)* WATERBORNE WASTES Adsorbable Organic Halogens (AOX)* Biochemical Oxygen Demand (BOD) Chemical Oxygen Demand (COD) Suspended Solids Effluent Quantity/Water Use* * examined for manufacturing processes only Our accounting for greenhouse gases (GHGs, specifically, carbon dioxide (CO 2 ) and methane emissions) requires some elaboration. The environmental concern with such emissions is their association with the so-called greenhouse effect linked to global climate change. In assessing these emissions, we compared the virgin and recycled systems with respect to net GHG emissions. CO 2 and methane emissions are accounted for somewhat differently, as follows: CO 2 : Emissions of CO 2 derived from burning wood-derived materials (bark and pulping liquors in pulp and paper mills, and paper in incinerators) do not result in a net increase in such emissions, because the trees from which these materials were derived absorbed the equivalent amount of CO 2 in the processing of growing. h In contrast, emissions of CO 2 derived from the combustion of fossil fuels do result in a net increase. Hence, wood-derived CO 2 emissions are part of total, but not counted in net, GHG emissions; fossil fuel-derived CO 2 emissions are part of both total and net GHG emissions. Methane: Methane emissions from landfills are the only significant source of methane in our systems comparison. Decomposition of paper-based materials in landfills results in emissions of both CO 2 and methane. The CO 2 emissions are accounted for as just described: they contribute to total but not to net GHG emissions, because they are offset by an equivalent amount of CO 2 originally absorbed by the trees from which the paper was made. However, emissions of methane need to be accounted for differently. As discussed in Section III, methane is a much more potent GHG than is CO 2, with one pound of methane emissions representing the equivalent of 21 pounds of CO That is, each pound of methane contributes 21 pounds of GHG emissions when expressed as CO 2 equivalents. Only one pound of these emissions was derived from CO 2 originally absorbed by the trees used to make the paper; hence, all 21 pounds are part of total GHG emissions, while 20 pounds are counted as net GHG emissions. Net GHG emissions are expressed in terms of CO 2 equivalents. h Other activities involved in growing trees that may result in net emissions of CO 2 are not included here. Examples of such activities are soil disturbance associated with preparing a site for tree planting and energy or materials used in the production of fertilizers used in forests. 78
86 1. Activities Within the Waste Management and Material Recovery Systems Waste management activities that are responsible for the generation of air emissions and waterborne wastes include both: (1) those that involve the use of energy, whether in the form of electricity (which results in air emissions and waterborne wastes from an electric utility) or in the form of fuels (which results in air emissions and waterborne wastes during acquisition of the fuels and during their consumption); and (2) direct releases from waste management processes or facilities themselves. Sources of air emissions and waterborne wastes specific to each waste management option are listed below. For landfilling, air emissions and waterborne wastes arise from: (1) energy use: generation of electricity or combustion of fuels during the acquisition of fuels used by MSW collection vehicles and landfill equipment; the combustion of the fuels themselves in the vehicles and equipment; and (2) from the landfill itself, through: volatilization to the air of waste components themselves or products of waste decomposition, in the form of landfill gas; and formation and release or discharge to the ground or water of dissolved or suspended waste components or products of waste decomposition, in the form of landfill leachate. For incineration, air emissions and waterborne wastes arise from: (1) energy use, specifically from the generation of electricity or combustion of fuels: during the acquisition of fuels used by MSW collection vehicles, as well as from the combustion of the fuels themselves; during the acquisition of fuels used by utilities to generate the electricity used to operate incinerator equipment, as well as from the combustion of the fuels themselves by the utility; required to operate the incinerator and associated equipment; during the acquisition of fuels used by ash transport vehicles and ash landfill equipment, as well as from the combustion of the fuels themselves; and (2) from the incinerator and incineration by-products, through: release of gases, volatilized chemicals, and particulate material produced during combustion of waste; depending on its management, release of ash or its constituents in a manner such that they become airborne or waterborne, whether at the incinerator, during storage or transport, or at the ash landfill (e.g., dust, leachate). For recycling, air emissions and waterborne wastes arise from: 79
87 (1) energy use, specifically from the generation of electricity or combustion of fuels: during the acquisition of fuels used by MSW collection vehicles, as well as from the combustion of the fuels themselves; during the acquisition of fuels used by utilities to generate electricity used to operate recyclables processing equipment, as well as from the combustion of the fuels actually consumed by the utility; required to operate the equipment used to process recyclables; during the acquisition of fuels used by residuals transport vehicles and residuals landfill equipment, as well as from the combustion of the fuels themselves; during the acquisition of fuels used by vehicles transporting processed recyclables to market, as well as from the combustion of the fuels themselves; and (2) potentially also from material-handling activities, during which substances present in the materials may: volatilize or otherwise become airborne (e.g., dust); or contaminate water used to process recyclable materials. One other activity lying outside the immediate waste management and material recovery systems reduces the amount of air emissions and waterborne wastes: For incinerators where energy is generated, the electricity (or steam) generated can be viewed as displacing the air emissions and waterborne wastes associated with producing the same amount of electricity (or steam) at a utility. Reductions in utility air emissions and waterborne wastes resulting from energy generation are counterbalanced to some degree by releases from the incinerator. (In the case of a landfill that employs gas recovery, subsequent energy generation also reduces air emissions of landfill gases, though they are also somewhat counterbalanced by emissions from the process used for energy generation.) In its recent report, Franklin Associates has estimated air emissions and waterborne wastes for various steps that comprise each waste management option, based on the following relevant assumptions and limitations (in addition to those discussed in earlier sections); as noted below, some of these assumptions have been adjusted to reflect the management of specific grades of paper: Facilities are assumed to be in compliance with all applicable regulations governing design, operation and environmental releases. MSW landfill gas emissions other than carbon dioxide and methane, and MSW landfill leachate, are not included, due to lack of data allowing quantification of releases per ton of waste landfilled or data that would allow allocation of a fraction of these releases to paper or specific grades of paper; landfill gas is assumed not to be recovered. 80 Leachate or other releases from industrial landfills accepting waste from pulp and paper mills is also not included. Incinerator air emissions represent the quantity allowed under current regulations. We have made several adjustments to the data provided by Franklin Associates to provide estimates that are specific to paper: 80
88 For landfill emissions of GHGs (carbon dioxide and methane), we have adjusted the Franklin Associates' estimates of these emissions from facilities landfilling MSW, using the ratio of the elemental carbon content of paper relative to that of MSW as a whole. This ratio is provided in Table B-3 of Appendix B. We have then used the methodology described above to account for the much greater potency of methane as a GHG; the sum of the paper-specific carbon dioxide emissions estimate and the potency-adjusted, paperspecific methane emissions estimate represents total GHG emissions from the landfill, expressed as CO 2 equivalents. Net GHG emissions from the landfill are calculated as described above: they exclude the carbon dioxide emissions and a fraction (1/21 st ) of the methane emissions. For incinerators: For air emissions of carbon dioxide, sulfur oxides and nitrogen oxides, we have developed estimates specific to paper as follows: Starting with Franklin Associates' estimates of these emissions from facilities burning MSW, we have adjusted these figures using the ratio of the elemental carbon, sulfur and nitrogen content of paper relative to that of MSW as a whole. These ratios are provided in Table B-3 of Appendix B. Carbon dioxide, sulfur oxides and nitrogen oxides are all terminal oxidation products of combustion, and hence their emissions are a function of the elemental content of the material combusted. In the case of nitrogen oxides, emissions originate not only from nitrogen contained in the fuel but also from that contained in air; to approximate this, we have assumed that half of the nitrogen oxides originate from each source, and have therefore applied the paper : MSW nitrogen ratio only to half of the emissions estimate provided by Franklin Associates, and added this amount to the other (unadjusted) half of the emissions. 81 No adjustment has been made to the incinerator particulates estimates developed by Franklin Associates. Due to its physical nature, incineration of paper might be expected to generate higher levels of particulates than incineration of MSW as a whole, and therefore would contribute disproportionately larger amounts of particulates to the total such emissions from an MSW incinerator. However, we have not identified a basis for deriving an alternative estimate specific to paper. The amounts of air and water releases displaced by the energy generated by incineration (i.e., those releases that would otherwise have been produced by a utility) have been adjusted to account for the higher energy content of each grade of paper relative to MSW, using the adjustment factors presented in Table B-2 of Appendix B. All the grades examined here have energy contents appreciably higher than typical MSW, with ONP having the highest. These avoided releases are accounted for as credits for the incineration option. The air and water releases associated with the energy required to transport and dispose of the ash produced by incineration was adjusted to account for the different amounts of ash expected from each grade of paper relative to MSW, as discussed above and detailed in Table B-1 of Appendix B. Ash content of OWP is substantially higher than the other grades, due to the inclusion of inorganic content (fillers and/or coatings). Here again, the wet weights of ash (assuming 25% moisture content) were used in adjusting the ash transport and disposal energy requirements, for the reasons discussed previously. 81
89 2. Activities Involved in Fiber Acquisition and Manufacturing In order to provide an accounting of energy use across the full lifecycle for each of the systems involving landfilling, incineration and recycling, we supplemented the data on air emissions and waterborne wastes associated with the waste management and material recovery activities described above with estimates of energy use arising from the following additional activities: For virgin paper production, air emissions and waterborne wastes arise from the process of acquiring virgin fiber (primarily associated with acquiring and consuming the fuels expended in harvesting trees and transporting logs to the mill). We have identified estimates of energy requirements for these activities, in the form of fuel use for harvesting equipment and transport vehicles, and have calculated the amount of associated air and water releases, based on the amount of fuel used per ton of trees and the number of tons of trees required to make a ton of each of the grades of paper considered here. (This quantity is denoted in the tables in Appendix C and charts in Appendix D using the label "tree harvesting/ transport" under the landfill and incineration system activities.) In the course of both virgin and recycled manufacturing, air and water releases are generated, both directly from the manufacturing processes and as a result of on-site energy generation (whether using wood-derived or purchased fuels). We developed estimates of these releases for mills producing each of the virgin and recycled grades considered here, based on several recent paper industry surveys and other reports. 82 These releases are assigned to the virgin manufacturing component of the landfilling and incineration options, and the recycled manufacturing component of the recycling option. Three additional categories of air emissions (HAPs, VOCs and TRS), and in the case of office paper and SBS paperboard one additional category of waterborne wastes (AOX), as well as effluent flow, were examined only in the comparison of virgin and recycled manufacturing processes. Their inclusion here is intended to allow additional assessment of the virgin and recycled manufacturing processes, rather than the three material recovery and waste management options. (For this reason, they are indicated with an "X" in Figures 5-9 discussed below for the cases where they have not been estimated.) For HAPs and VOCs, both incinerators and landfills are known sources of such substances. 83 Landfills can be expected to be net emitters of these pollutant categories, while for incinerators an evaluation of the amount of these substances displaced from utility emissions would have to be conducted before an estimate of net emissions for this option could be derived. Insufficient data are available, however, to allow estimation of releases from these sources. Air and water releases are also generated in producing purchased electricity used in the virgin and recycled manufacturing processes, which is typically obtained from a utility; these releases are generated off-site. The air emissions associated with this purchased electricity have been incorporated into the manufacturing release estimates, because of their direct association with the total energy consumption of the manufacturing processes. The waterborne wastes, which arise primarily from acquisition of the fuels consumed by the utility, are not accounted for under the virgin and recycled manufacturing components. Hence, we assign to each option the amounts of waterborne wastes corresponding to that associated with acquiring the fuel needed to generate the amount of purchased electricity it 82
90 uses (this quantity appears in the tables in Appendix C and the charts in Appendix D under the heading "utility energy/releases"). 3. Results Concerning Air Emissions [Note: As explained above, we have separated greenhouse gas (GHG) emissions arising from all sources (carbon dioxide from wood-derived materials, including bark, pulping liquors and paper; carbon dioxide from fossil fuels, and methane from landfills) from those arising from only fossil fuels or methane. The former is termed total GHGs, while the latter is termed net GHGs. Net GHGs are reported here.] a) Comparison of Recycled Production plus Recycling to Virgin Production plus Landfilling and Virgin Production plus Incineration Newsprint (Figure 5): From a waste management and material recovery system perspective (panel B), mixed results are seen with respect to air emissions from the three options. Recycling is the largest source for particulates and sulfur oxides, and landfilling is the largest source of net GHGs; incineration and recycling produce comparable (within 10%) nitrogen oxide emissions, more than landfilling. From the broader system-wide view (panel A), however, recycled production plus recycling emerges as the smallest source in all categories. Corrugated (Figure 6): From a waste management and material recovery system perspective (panel B), a mixed picture is seen with respect to air emissions from the three options. Recycling is the largest source of nitrogen oxides, particulates and sulfur oxides, while landfilling is the largest source of net GHGs. From the broader system-wide view (panel A), virgin production plus landfilling is the largest source in all categories except sulfur oxides, where recycled production plus recycling produces comparably high releases. Recycled production plus recycling and virgin production plus incineration produce comparable emissions of net GHGs, nitrogen oxides and particulates. Office Paper (Figure 7): From a waste management and material recovery system perspective (panel B), the results are again mixed with respect to air emissions from the three options. Landfilling is the largest source of net GHGs, while recycling is the largest source of nitrogen oxides, particulates and sulfur oxides. From the broader system-wide view (panel A), virgin production plus landfilling is the largest source in all categories. Recycled production plus recycling is the smallest source for nitrogen oxides and particulates; for net GHGs and sulfur oxides, virgin production plus incineration produces the lowest emissions. Paperboard (CUK) (Figure 8): From a waste management and material recovery system perspective (panel B), again the results with respect to air emissions from the three options are 83
91 mixed. Landfilling is the largest source of net GHGs, while recycling is the largest source of particulates and sulfur oxides. Recycling and incineration produce comparable emissions of nitrogen oxides, both greater than landfilling. From the broader system-wide view (panel A), virgin production plus landfilling is the largest source in all categories except sulfur oxides, where recycled production plus recycling produces comparable emissions. Virgin production plus incineration is the smallest source of net GHGs and sulfur oxides, but produces nitrogen oxide and particulate emissions comparable to recycled production plus recycling. Paperboard (SBS) (Figure 9): From a waste management and material recovery system perspective (panel B), a mixed picture is again seen with respect to air emissions from the three options. Landfilling is the largest source of net GHGs, while recycling is the largest source of particulates and sulfur oxides. Incineration and recycling produce comparable nitrogen oxide emissions, both larger than landfilling. From the broader system-wide view (panel A), virgin production plus landfilling is the largest source in all categories. Recycled production plus recycling is the smallest source of nitrogen oxides and particulates, but produces comparable sulfur oxide emissions to virgin production plus incineration. b) Comparison of Recycled Production plus Recycling to the Virgin Production plus Composite Waste Management System (Figures 5X-9X) For all grades of paper examined here, from the limited view of the material recovery and waste management systems only, recycling results in greater releases of all categories of pollutants except net GHGs than does waste management. Also for all grades of paper examined here, from a system-wide view, recycled production plus recycling results in lower emissions in all of these categories except sulfur oxides than does virgin production plus waste management. For sulfur oxides, recycled production plus recycling results in lower emissions for newsprint and SBS paperboard, comparable emissions for corrugated containers and office paper, and slightly higher emissions for CUK paperboard. c) Comparison of the Recycled and Virgin Manufacturing Processes Air emissions of hazardous air pollutants (HAPs), volatile organic chemicals (VOCs) and sulfur compounds (TRS) were examined only for the recycled and virgin manufacturing processes, due to lack of data for other system activities. Hence the values given do not include 84
92 Figure 5. NEWSPRINT: Air Emissions from Production and Management A: System-Wide View Pounds per ton of paper managed Net GHGs (CO2 Equivs x 001) Nitrogen oxides Particulates Sulfur oxides Hazardous Air Pollutants (HAPs) (x 10) Volatile Organic Chemicals (VOCs) Virgin Production plus Landfilling Virgin Production plus Incineration Recycled Production plus Recycling 85
93 B: Air Emissions from the Waste Management and Material Recovery Systems Only Pounds per ton of paper managed Net GHGs (CO2 Equivs x 001) Nitrogen oxides Particulates Sulfur oxides Hazardous Air Pollutants (HAPs) (x 10) Volatile Organic Chemicals (VOCs) Landfilling Incineration Recycling 86
94 Figure 6. CORRUGATED: Air Emissions from Production and Management A: System-Wide View Pounds per ton of paper managed Net GHGs (CO2 Equivs x 001) Nitrogen oxides Particulates Sulfur oxides Hazardous Air Pollutants (HAPs) Volatile Organic Chemicals (VOCs) Total Reduced Sulfur (TRS) (x 10) Virgin Production plus Landfilling Virgin Production plus Incineration Recycled Production plus Recycling 87
95 B: Air Emissions from the Waste Management and Material Recovery Systems Only Pounds per ton of paper managed Net GHGs (CO2 Equivs x 001) Nitrogen oxides Particulates Sulfur oxides Hazardous Air Pollutants (HAPs) Volatile Organic Chemicals (VOCs) Total Reduced Sulfur (TRS) (x 10) Landfilling Incineration Recycling 88
96 Figure 7. OFFICE PAPER: Air Emissions from Production and Management A: System-Wide View Pounds per ton of paper managed Net GHGs (CO2 Equivs x 001) Nitrogen oxides Particulates Sulfur oxides Hazardous Air Pollutants (HAPs) (x 10) Volatile Organic Chemicals (VOCs) Total Reduced Sulfur (TRS) (x 100) Virgin Production plus Landfilling Virgin Production plus Incineration Recycled Production plus Recycling 89
97 B: Air Emissions from the Waste Management and Material Recovery Systems Only Pounds per ton of paper managed Net GHGs (CO2 Equivs x 001) Nitrogen oxides Particulates Sulfur oxides Hazardous Air Pollutants (HAPs) (x 10) Volatile Organic Chemicals (VOCs) Total Reduced Sulfur (TRS) (x 100) Landfilling Incineration Recycling 90
98 Figure 8. CUK PAPERBOARD: Air Emissions from Production and Management A: System-Wide View Pounds per ton of paper managed Net GHGs (CO2 Equivs x 001) Nitrogen oxides Particulates Sulfur oxides Hazardous Air Pollutants (HAPs) (x 10) Volatile Organic Chemicals (VOCs) Total Reduced Sulfur (TRS) (x 100) Virgin Production plus Landfilling Virgin Production plus Incineration Recycled Production plus Recycling 91
99 B: Air Emissions from the Waste Management and Material Recovery Systems Only Pounds per ton of paper managed Net GHGs (CO2 Equivs x 001) Nitrogen oxides Particulates Sulfur oxides Hazardous Air Pollutants (HAPs) (x 10) Volatile Organic Chemicals (VOCs) Total Reduced Sulfur (TRS) (x 100) Landfilling Incineration Recycling 92
100 Figure 9. SBS PAPERBOARD: Air Emissions from Production and Management A: System-Wide View Pounds per ton of paper managed Net GHGs (CO2 Equivs x 001) Nitrogen oxides Particulates Sulfur oxides Hazardous Air Pollutants (HAPs) (x 10) Volatile Organic Chemicals (VOCs) Total Reduced Sulfur (TRS) (x 100) Virgin Production plus Landfilling Virgin Production plus Incineration Recycled Production plus Recycling 93
101 B: Air Emissions from the Waste Management and Material Recovery Systems Only Pounds per ton of paper managed Net GHGs (CO2 Equivs x 001) Nitrogen oxides Particulates Sulfur oxides Hazardous Air Pollutants (HAPs) (x 10) Volatile Organic Chemicals (VOCs) Total Reduced Sulfur (TRS) (x 100) Landfilling Incineration Recycling 94
102 Figure 5X. NEWSPRINT: Air Emissions from Production and Management A: System-Wide View Pounds per ton of paper managed Net GHGs (CO2 Equivs x 001) Nitrogen oxides Particulates Sulfur oxides Hazardous Air Pollutants (HAPs) (x 10) Volatile Organic Chemicals (VOCs) Virgin Production plus Waste Management 95 Recycled Production plus Recycling
103 B: Air Emissions from the Waste Management and Material Recovery Systems Only Pounds per ton of paper managed Net GHGs (CO2 Equivs x 001) Nitrogen oxides Particulates Sulfur oxides Hazardous Air Pollutants (HAPs) (x 10) Volatile Organic Chemicals (VOCs) Waste Management Recycling 96
104 Figure 6X. CORRUGATED: Air Emissions from Production and Management A: System-Wide View Pounds per ton of paper managed Net GHGs (CO2 Equivs x 001) Nitrogen oxides Particulates Sulfur oxides Hazardous Air Pollutants (HAPs) Volatile Organic Chemicals (VOCs) Total Reduced Sulfur (TRS) (x 10) 2.0 Virgin Production plus Waste Management 97 Recycled Production plus Recycling
105 B: Air Emissions from the Waste Management and Material Recovery Systems Only Pounds per ton of paper managed Net GHGs (CO2 Equivs x 001) Nitrogen oxides Particulates Sulfur oxides Hazardous Air Pollutants (HAPs) Volatile Organic Chemicals (VOCs) Total Reduced Sulfur (TRS) (x 10) Waste Management Recycling 98
106 Figure 7X. OFFICE PAPER: Air Emissions from Production and Management A: System-Wide View Pounds per ton of paper managed Net GHGs (CO2 Equivs x 001) Nitrogen oxides Particulates Sulfur oxides Hazardous Air Pollutants (HAPs) (x 10) Volatile Organic Chemicals (VOCs) Total Reduced Sulfur (TRS) (x 100) 33.9 Virgin Production plus Waste Management 99 Recycled Production plus Recycling
107 B: Air Emissions from the Waste Management and Material Recovery Systems Only Pounds per ton of paper managed Net GHGs (CO2 Equivs x 001) Nitrogen oxides Particulates Sulfur oxides Hazardous Air Pollutants (HAPs) (x 10) Volatile Organic Chemicals (VOCs) Total Reduced Sulfur (TRS) (x 100) Waste Management Recycling 100
108 Figure 8X. CUK PAPERBOARD: Air Emissions from Production and Management A: System-Wide View Pounds per ton of paper managed Net GHGs (CO2 Equivs x 001) Nitrogen oxides Particulates Sulfur oxides Hazardous Air Pollutants (HAPs) (x 10) Volatile Organic Chemicals (VOCs) Total Reduced Sulfur (TRS) (x 100) 28.6 Virgin Production plus Waste Management 101 Recycled Production plus Recycling
109 B: Air Emissions from the Waste Management and Material Recovery Systems Only Pounds per ton of paper managed Net GHGs (CO2 Equivs x 001) Nitrogen oxides Particulates Sulfur oxides Hazardous Air Pollutants (HAPs) (x 10) Volatile Organic Chemicals (VOCs) Total Reduced Sulfur (TRS) (x 100) Waste Management Recycling 102
110 Figure 9X. SBS PAPERBOARD: Air Emissions from Production and Management A: System-Wide View Pounds per ton of paper managed Net GHGs (CO2 Equivs x 001) Nitrogen oxides Particulates Sulfur oxides Hazardous Air Pollutants (HAPs) (x 10) Volatile Organic Chemicals (VOCs) Total Reduced Sulfur (TRS) (x 100) 37.0 Virgin Production plus Waste Management 103 Recycled Production plus Recycling
111 B: Air Emissions from the Waste Management and Material Recovery Systems Only Pounds per ton of paper managed Net GHGs (CO2 Equivs x 001) Nitrogen oxides Particulates Sulfur oxides Hazardous Air Pollutants (HAPs) (x 10) Volatile Organic Chemicals (VOCs) Total Reduced Sulfur (TRS) (x 100) Waste Management Recycling 104
112 emissions of these pollutant categories from the material recovery and waste management options. For all five paper grades, the recycled manufacturing process generates much lower emissions of HAPs, VOCs and TRS than the virgin manufacturing processes. 4. Results for Waterborne Wastes 84 a) Comparison of Recycled Production plus Recycling to Virgin Production plus Landfilling and Virgin Production plus Incineration Newsprint (Figure 10): From a waste management and material recovery system perspective (panel B), recycling is the largest source of waterborne wastes of the three options. Releases from incineration and landfilling are smaller and generally similar in magnitude. From the broader system-wide view (panel A), recycled production plus recycling releases the most BOD and suspended solids, but the least COD of the three options. This greater release of BOD and suspended solids can be traced to the relatively low release of BOD and suspended solids from the mechanical pulping process used for virgin newsprint, which are considerably lower than those from chemical pulping and bleaching processes used for office paper and SBS paperboard (see below). Virgin production plus incineration and virgin production plus landfilling release virtually equivalent amounts of BOD, COD and suspended solids, because (at least under the assumptions and data limitations of this analysis 85 ) the great majority of these substances is derived from the virgin manufacturing step that they share in common. Corrugated (Figure 11): From a waste management and material recovery system perspective (panel B), recycling is the largest source of waterborne wastes of the three options. Releases from incineration and landfilling are smaller and generally similar in magnitude. From the broader system-wide view (panel A), all three options result in comparable releases of BOD, while recycled production plus recycling results in the lowest releases of COD and suspended solids, much lower than virgin production plus landfilling or incineration. The process used to repulp OCC yields a relatively clean effluent in comparison to that produced from chemical pulping used to produce virgin linerboard and corrugating medium. Office Paper (Figure 12): From a waste management and material recovery system perspective (panel B), recycling is the largest source of waterborne wastes of the three options. Releases from incineration and landfilling are smaller and generally similar in magnitude. From the broader system-wide view (panel A), recycled production plus recycling results in comparable releases of BOD, but much lower releases of COD and suspended solids than the other two options. As with corrugated, the chemical pulping process used to produce virgin office paper is relatively more contaminated with these pollutants. 105
113 Paperboard (CUK) (Figure 13): From a waste management and material recovery system perspective (panel B), recycling is the largest source of waterborne wastes of the three options. Releases from incineration and landfilling are smaller and generally similar in magnitude. From the broader system-wide view (panel A), recycled production plus recycling results in the lowest releases in all categories, and it is much lower for COD than is virgin production plus landfilling or incineration. The process used to repulp paperboard yields a relatively clean effluent in comparison to that produced from chemical pulping used to produce virgin CUK paperboard. Paperboard (SBS) (Figure 14): From a waste management and material recovery system perspective (panel B), recycling is the largest source of waterborne wastes of the three options. Releases from incineration and landfilling are smaller and generally similar in magnitude. From the broader system-wide view (panel A), recycled production plus recycling results in the lowest releases in all categories, and is much lower for COD and suspended solids than is virgin production plus landfilling or incineration. The process used to repulp paperboard yields a relatively clean effluent in comparison to that produced from chemical pulping used to produce virgin SBS paperboard. b) Comparison of Recycled Production plus Recycling to the Virgin Production plus Composite Waste Management System (Figures 10X-14X) As was seen above, from a waste management and recovery system perspective, and for all grades of paper examined here, recycling results in greater releases of all of these categories of emissions than does waste management. The results from the system-wide view for BOD, COD and suspended solids are as follows: Newsprint: Recycled production plus recycling produces lower releases of COD, but higher releases of BOD and suspended solids, than does virgin production plus waste management. Corrugated: Recycled production plus recycling produces much lower releases of COD and suspended solids and comparable releases of BOD, compared to virgin production plus waste management. Office Paper: Recycled production plus recycling produces lower releases of COD and suspended solids than does virgin production plus waste management. With respect to BOD, there is no significant difference among the two options. Paperboard: Recycled production plus recycling produces considerably lower releases than does virgin production plus waste management in all of these categories. 106
114 Figure 10. NEWSPRINT: Waterborne Wastes from Production and Management A: System-Wide View Pounds per ton of paper managed BOD COD Suspended solids Effluent Flow (000 gal) Virgin Production plus Landfilling Virgin Production plus Incineration Recycled Production plus Recycling B: Waterborne Wastes from the Waste Management and Material Recovery Systems Only Pounds per ton of paper managed BOD COD Suspended solids Effluent Flow (000 gal) Landfilling Incineration Recycling 107
115 Figure 11. CORRUGATED: Waterborne Wastes from Production and Management A: System-Wide View Pounds per ton of paper managed BOD COD Suspended solids Effluent Flow (000 gal) Virgin Production plus Landfilling Virgin Production plus Incineration Recycled Production plus Recycling B: Waterborne Wastes from the Waste Management and Material Recovery Systems Only Pounds per ton of paper managed BOD COD Suspended solids Effluent Flow (000 gal) Landfilling Incineration Recycling 108
116 Figure 12. OFFICE PAPER: Waterborne Wastes from Production and Management A: System-Wide View Pounds per ton of paper managed AOX (x 10) BOD COD Suspended solids Effluent Flow (000 gal) Virgin Production plus Landfilling Virgin Production plus Incineration Recycled Production plus Recycling B: Waterborne Wastes from the Waste Management and Material Recovery Systems Only Pounds per ton of paper managed AOX 0 BOD COD Suspended solids Effluent Flow (000 gal) 0 Landfilling Incineration Recycling 109
117 Figure 13. CUK PAPERBOARD: Waterborne Wastes from Production and Management A: System-Wide View Pounds per ton of paper managed BOD COD Suspended solids Effluent Flow (000 gal) Virgin Production plus Landfilling Virgin Production plus Incineration Recycled Production plus Recycling B: Waterborne Wastes from the Waste Management and Material Recovery Systems Only Pounds per ton of paper managed AOX 0 BOD COD Suspended solids Effluent Flow (000 gal) 0 Landfilling Incineration Recycling 110
118 Figure 14. SBS PAPERBOARD: Waterborne Wastes from Production and Management A: System-Wide View Pounds per ton of paper managed AOX (x 10) BOD COD Suspended solids Effluent Flow (000 gal) Virgin Production plus Landfilling Virgin Production plus Incineration Recycled Production plus Recycling B: Waterborne Wastes from the Waste Management and Material Recovery Systems Only Pounds per ton of paper managed AOX 0 BOD COD Suspended solids Effluent Flow (000 gal) 0 Landfilling Incineration Recycling 111
119 Figure 10X. NEWSPRINT: Waterborne Wastes from Production and Management A: System-Wide View Pounds per ton of paper managed BOD COD Suspended solids Effluent Flow (000 gal) Virgin Production plus Waste Management Recycled Production plus Recycling B: Waterborne Wastes from the Waste Management and Material Recovery Systems Only Pounds per ton of paper managed BOD COD Suspended solids Effluent Flow (000 gal) 0 0 Waste Management Recycling 112
120 Figure 11X. CORRUGATED: Waterborne Wastes from Production and Management A: System-Wide View Pounds per ton of paper managed BOD COD Suspended solids Effluent Flow (000 gal) Virgin Production plus Waste Management Recycled Production plus Recycling B: Waterborne Wastes from the Waste Management and Material Recovery Systems Only Pounds per ton of paper managed BOD COD Suspended solids Effluent Flow (000 gal) 0 0 Waste Management Recycling 113
121 Figure 12X. OFFICE PAPER: Waterborne Wastes from Production and Management A: System-Wide View Pounds per ton of paper managed AOX (x 10) 16.8 BOD COD Suspended solids Effluent Flow (000 gal) Virgin Production plus Waste Management Recycled Production plus Recycling B: Waterborne Wastes from the Waste Management and Material Recovery Systems Only Pounds per ton of paper managed AOX 0 0 BOD COD Suspended solids Effluent Flow (000 gal) 0 0 Waste Management Recycling 114
122 Figure 13X. CUK PAPERBOARD: Waterborne Wastes from Production and Management A: System-Wide View Pounds per ton of paper managed BOD COD Suspended solids Effluent Flow (000 gal) Virgin Production plus Waste Management Recycled Production plus Recycling B: Waterborne Wastes from the Waste Management and Material Recovery Systems Only Pounds per ton of paper managed BOD COD Suspended solids Effluent Flow (000 gal) 0 0 Waste Management Recycling 115
123 Figure 14X. SBS PAPERBOARD: Waterborne Wastes from Production and Management A: System-Wide View Pounds per ton of paper managed AOX (x 10) BOD COD Suspended solids Effluent Flow (000 gal) Virgin Production plus Waste Management Recycled Production plus Recycling B: Waterborne Wastes from the Waste Management and Material Recovery Systems Only Pounds per ton of paper managed AOX 0 0 BOD COD Suspended solids Effluent Flow (000 gal) 0 0 Waste Management Recycling 116
124 c) Comparison of the Recycled and Virgin Manufacturing Processes [Note: No comparison of the three material recovery and waste management options was attempted for AOX or effluent quantity/water use.] (1) Adsorbable Organic Halogens (AOX) [Note: This parameter was examined only for office paper and SBS paperboard. A few recycled mills may use chlorinated compounds (hypochlorite) in their processes; these types of mills were not examined here and the finding may not apply to them.] The virgin processes for making office paper and SBS paperboard generate AOX, due to the use of chlorinated compounds (chlorine and/or chlorine dioxide) in the bleaching processes modeled in our analysis. No chlorinated compounds are used, and therefore no AOX is generated, in the deinking process employed for used office paper or paperboard. (2) Effluent quantity/water use For all grades except newsprint, the recycled manufacturing process results in less effluent discharge compared to the virgin manufacturing process, due to the relatively higher water use associated with chemical pulping and bleaching. For ONP, the recycled and virgin processes result in comparable quantities of effluent. This is due to a combination of the relatively high water use associated with the process used to deink recycled ONP, and the lower water use associated with virgin mechanical relative to virgin chemical pulping and bleaching. 5. Other Studies Very little other information was found that allows a direct comparison of air and water releases from landfilling, incineration and recycling of paper. In a separate study from the one discussed previously, Tellus compiled limited data on landfill leachate (but not landfill gas), incinerator air emissions, recycling facility air emissions (based on only one limited sampling study), and air emissions from recyclables collection and garbage collection. 86 Only the data on air emissions were reported for more than one option and therefore facilitate any comparison among options. Tellus allocated air emissions associated with incinerating MSW and collecting MSW and recyclables to individual materials; the results for both MSW and paper are shown in Table 7. (No allocation was attempted for air emissions from MRF operations, due to the scarcity of data.) Tellus made the following assumptions in order to allocate the air emissions estimates it derived for the mixed-material processes to specific materials. 117
125 Table 7: Comparative data on air emissions from facilities managing MSW and from collection of MSW and recyclables, and allocation of air emissions to the paper fraction of MSW and recyclables (all values are in pounds per ton of material managed) I. MSW MANAGEMENT a b c d e f g Incinerator Recycling Recycling Recyclables MSW Incineration Recyclables stack (inactive; (active collection collection*** plus MSW collection emissions* no sorting)** sorting)** Collection*** Criteria pollutants CO NOx Particulates SOx VOCs Metals Arsenic x10e6 36 ND ND Cadmium x10e Chromium (total) x10e Lead x10e Mercury x10e Nickel x10e Organics Benzene x10e Ethyl benzene x10e Toluene x10e Xylenes x10e II. PAPER MANAGEMENT Incinerator MRF MRF Recyclables MSW Incineration Recyclables stack (inactive; (active collection collection*** plus MSW collection emissions* no sorting)** sorting)** Collection*** Criteria pollutants CO NOx Particulates SOx VOCs Metals Arsenic x10e ND ND Cadmium x10e Chromium (total) x10e Lead x10e Mercury x10e Nickel x10e Organics Benzene x10e Ethyl benzene x10e Toluene x10e Xylenes x10e * assumes state-of-the-art incinerator equipped with a scrubber, fabric filter/baghouse, and thermal de-nox. ** may be underestimate because sampling device became saturated during sampling period *** underestimate because emissions from MSW collection vehicles are actually higher than assumed due to compaction cycles and slightly larger engine requirements to support compaction and hauling of a greater weight of material at full capacity SOURCE: Tellus Institute (1992) Assessing the Impacts of Production and Disposal of Packaging and Public Policy Measures to Alter Its Mix, prepared for the Council of State Governments, the U.S. Environmental Protection Agency, and the New Jersey Department of Environmental Protection and Energy, May 1992, Report #4, "Impacts of Production and Disposal of Packaging Materials - Methods and Case Studies," Chapter 2, citing SGS Engineers (1990) "NYC Solid Waste Ultimate Analysis." 118
126 For incineration: Criteria air pollutants: 87 Carbon monoxide and particulates were assumed to be proportional to the weight of material incinerated, and were allocated to paper based on its weight fraction of incinerated MSW; sulfur oxides were allocated to materials based on their sulfur content; VOCs were allocated even across all combustible categories of materials present in incinerated MSW. Nitrogen oxides were assumed to arise from nitrogen present both in combustion air and in waste materials, at a 50:50 ratio. The portion arising from nitrogen in combustion air was apportioned across all materials based on their weight fractions in incinerated MSW; the other portion was allocated based on the nitrogen content of the waste materials. (Note that this is the same approach adopted here, described above.) Metals: Metals were apportioned based on the content of each metal in each material category, derived from chemical analyses of individual components. Organics: These compounds were apportioned evenly to all material categories known to yield aromatic organic compounds upon combustion. For recyclables and MSW collection: Criteria pollutants and organics were derived from data on truck emissions, adjusted to reflect longer idle times and slow speeds relative to trucks transporting goods. The emissions estimates were allocated to various materials according to (1) in-truck volumes (used because trucks fill up by volume, not by weight), which differ between recyclables collection vehicles and garbage trucks due to differential compaction; 88 and (2) assumed truck collection miles. MSW collection and recyclables collection vehicles are assumed to generate identical emissions. The data in Table 7 indicate the following findings: Incinerator stack emissions are a far higher source (by several orders of magnitude) of heavy metals than are MRF operations (compare columns a to b/c). Paper's contribution to incinerator emissions is about 2 orders of magnitude lower for heavy metals, and 1-2 orders of magnitude lower for criteria pollutants, than total stack emissions (compare column a, section I, to column a, section II). MSW and recyclables collection activities are comparable to incineration as a source of emissions of criteria pollutants (compare columns a and d/e). Collection of recyclables generally is a higher source of criteria air pollutants and organics than is MSW collection, by a factor of 4-5 (compare columns d and e). This finding reflects the need for more trucks and/or miles traveled to deliver a given weight of recyclables compared to the same weight of MSW; the magnitude of difference may be overstated, however, due to the fact that emissions from MSW collection vehicles are actually higher per unit time than those from recyclables collection vehicles, due to compaction cycles and slightly larger engine requirements to support compaction and hauling of a greater weight of material at full capacity
127 Collection of recovered paper appears to produce greater emissions than MSW collection, by a factor of 2-4, with the caveat that MSW collection vehicle emissions has been underestimated in Table 7. Where it is possible to make a direct comparison, these findings are roughly consistent with those that can be drawn from the data presented earlier in this paper. D. Wood Use The virgin systems examined in this paper utilize wood from trees as the source of fiber used to make pulp and paper. This section describes the factors that determine how much wood is required to make each of the five grades of paper considered here, and then presents the comparative results with respect to wood use. Except for this consideration of relative wood use and the inclusion of energy used in harvesting trees and transporting logs, the environmental effects associated with obtaining virgin fiber from trees have not been considered in this paper, due to their largely qualitative nature. As discussed in Chapter 4 of the main report, intensive management of forests for fiber and wood production can have significant biological and ecological consequences, such as effects on biodiversity, wildlife habitat and natural ecosystems. Such consequences are an important difference between recycled fiber and virgin fiber-based systems. 1. Factors Associated with Virgin Fiber Acquisition and Manufacturing that Determine Wood Use A consideration often neglected in assessing virgin fiber-based systems involves the amount of wood in the form of trees that must be harvested and transported to serve as a source of raw material. This amount is in turn determined by the following factors: Wood in harvested trees (green wood or wet wood) contains approximately 50% moisture. Wood pulping and bleaching processes have yields that are considerably less than 100% and vary by process; bleached kraft pulping yields are on the order of 45%, unbleached kraft yields are approximately 55-65% and mechanical pulp yields are 80-95%. The specific assumed yields for each grade which we have used here and throughout this report are as follows: Office CUK SBS Yield of pulp Newsprint Corrugated Paper Paperboard Paperboard from dry wood 90% 63% 45% 57% 45% The percentage of fiber used to make a given type of paper also varies, based on the use of coatings and fillers and on mositure content. We have assumed a moisture content of 6% for all grades, and the following grade-specific pulp contents: 120
128 Office CUK SBS Pulp per ton Newsprint Corrugated Paper Paperboard Paperboard of paper (tons) Results Comparing the Recycled and Virgin Fiber Acquisition and Manufacturing Processes When the factors just discussed are combined, the tons of trees per ton of pulp or final paper can be calculated for each of the five grades studied here. Figure 15 shows the results. For newsprint, the high yield of the mechanical pulping process translates into efficient wood use and the lowest amount of trees consumed per ton of all the grades. At the opposite extreme, for office paper and SBS paperboard, the low yield of the chemical pulping and bleaching process means much more wood must be consumed to yield a ton of bleached pulp. Figure 15: Relative Use of Wood in the Form of Trees to Make Pulp and Paper Pulp Final Paper Tons of trees per ton of pulp or paper Newsprint Corrugated Office Paper CUK Paperboard SBS Paperboard
129 1995, 2002 Environmental Defense Appendices C and D Updated in February 2002 WHITE PAPER 3 APPENDICES APPENDIX A Members of the Task Force gratefully acknowledge the time, effort and expertise that the following individuals and organizations provided to its research. The work and final products of the Task Force are the sole responsibility of its members. Acknowledgment of the parties listed below does not imply their endorsement of this paper. PANEL AND ISSUE PAPER NO. 3 ENVIRONMENTAL COMPARISON OF RECYCLING AND OTHER MUNICIPAL SOLID WASTE MANAGEMENT METHODS PANELISTS (Panel held on August 10, 1994 in Oak Brook, IL) Marge Franklin, President, Franklin Associates Daniel J. Kemna, Manager, Strategic Planning, WMX Technologies Dr. Howard Levenson, Advisor to the Board, California Integrated Waste Management Board Mary Sheil, Director, Legislative Policy, Department of Environmental Protection, State of New Jersey Dr. Joseph Visalli, Program Manager for Environmental Research, New York State Energy Research and Development Authority ISSUE PAPER REVIEWERS (in addition to panelists above) Marjorie J. Clarke, independent consultant Dr. G. Fred Lee, G. Fred Lee & Associates N.C. Vasuki, General Manager, Delaware Solid Waste Authority 122
130 WHITE PAPER NO. 3 LIFECYCLE ENVIRONMENTAL COMPARISON: VIRGIN PAPER AND RECYCLED PAPER-BASED SYSTEMS WHITE PAPER REVIEWERS Marjorie J. Clarke, independent consultant Marge Franklin, President, Franklin Associates Linda Gaines, Energy Systems Division, Argonne National Laboratory Pete Grogan, Manager of Market Development, Weyerhaeuser Recycling H. Lanier Hickman, Executive Director, Solid Waste Association of North America Dr. G. Fred Lee, G. Fred Lee & Associates Dr. Howard Levenson, Advisor to the Board, California Integrated Waste Management Board Chaz Miller, Manager of Recycling Programs, Environmental Industry Associations Jeffrey Morris, Director of Economics and Econometric Analysis, Sound Resource Management Group Mary Sheil, Director, Legislative Policy, Department of Environmental Protection, State of New Jersey Richard Storat, Vice President, American Forest & Paper Association Frank Sudol, Chief of Research, City of Newark N.C. Vasuki, General Manager, Delaware Solid Waste Authority Dr. Joseph Visalli, Program Manager for Environmental Research, New York State Energy Research and Development Authority Allen White, Project Manager, Tellus Institute Jane Witheridge, Vice President, Strategic Planning, WMX Technologies 123
131 LIST OF PAPER TASK FORCE WHITE PAPERS Paper Performance Functionality Requirements for Uncoated Business Papers and Effects of Incorporating Postconsumer Recycled Content (White Paper 1) Functionality Requirements for Coated and Uncoated Publication Papers and Effects of Incorporating Postconsumer Recycled Content (White Paper 8) Functionality Issues for Corrugated Packaging Associated with Recycled Content, Source Reduction and Recyclability (White Paper 6A) Functionality Issues for Folding Cartons Associated with Recycled Content, Source Reduction and Recyclability (White Paper 6B) Recycling and Used Paper Management Economics of Recycling as an Alternative to Traditional Means of Solid Waste Management (White Paper 2) Lifecycle Environmental Comparison - Virgin Paper and Recycled Paper-Based Systems (White Paper 3) Economics of Manufacturing Virgin and Recycled-Content Paper (White Paper 9) Forest Management Environmental Issues Associated with Forest Management(White Paper 4) Economic Considerations in Forest Management (White Paper 11) Pulp and Paper Manufacturing Environmental Comparison of Bleached Kraft Pulp Manufacturing Technologies (White Paper 5) Economics of Kraft Pulping and Bleaching (White Paper 7) Environmental Comparison - Manufacturing Technologies for Virgin and Recycled-Content Printing and Writing Paper (White Paper 10A) 124
132 Environmental Comparison - Manufacturing Technologies for Virgin and Recycled Corrugated Boxes (White Paper 10B) Environmental Comparison - Manufacturing Technologies for Virgin and Recycled Coated Paperboard for Folding Cartons (White Paper 10C) Comparison of Kraft, Sulfite and BCTMP Pulp and Paper Manufacturing Technologies (White Paper 12) Nonwood Plant Fibers as Alternative Fiber Sources for Papermaking (White Paper 13) 125
133 Summary of Ratios Used in Analysis APPENDIX B: Ratios of Energy, Ash, Sulfur, Chlorine, Nitrogen and Carbon Content of Various Grades of Paper to Municipal Solid Waste Grade of Energy Content A sh Content A sh Content Sulfur Chlorine Nitrogen Carbon Paper (Btu/lb) (kwh/ton) (dry weight) (wet weight) (% by weight) (% by weight) (% by weight) (% by weight) Paper (grade not specified) Newsprint Corrugated Office Paper Paperboard TABLE B-1: Ash Content Residual Dry lbs of ash Ratio of paper Ash % Wet lbs of ash Ratio of paper Grade of Inorganic organic (LOI ) Total per ton of ash (dry weight) moisture per ton of ash (wet weight) Paper Contaminants content content ash content material burned to MSWash content material burned to MSWash Notes (% by dry wt) (% by dry wt) (% by dry wt) (% by dry wt) (wet weight) (wet weight) Newsprint Corrugated Office Paper Paperboard MSW (wet weight) NOTES: 1-3. Percent contaminants and inorganic content taken from White Papers 10A (newsprint, office paper) and 10B (corrugated); organic content ("loss on ignition") taken from Kosson et al., 1993 (average for combined fly and bottom ash); percent moisture content of ash taken from Franklin Associates, Percent contaminants, inorganic and organic content calculated using typical blend of newsprint (63%), corrugated (16%) and office paper (21%) in paperboard; taken from 1992 North American Pulp & Paper Factbook, op. cit., 1991, p. 275; organic content ("loss on ignition") taken from Kosson et al., 1993 (average for combined fly and bottom ash); percent moisture content of ash taken from Franklin Associates, Total ash content, wet weight of ash per ton of MSWburned, and percent moisture content of ash taken from Franklin Associates, 1994 TABLE B-2: Energy Content I. Heating value (Btus/lb) Grade of Paper Dry As Received Ratio to MSW Notes Newsprint Dry value from Ege and Brown, 1990; as-received value from Gershman et al., 1980 Corrugated Dry value from Ege and Brown, 1990; as-received value calculated using same dry : wet ratio as for newsprint Office Paper Dry value from Ege and Brown, 1990; as-received value calculated using same dry : wet ratio as for newsprint Paperboard Dry value calculated using typical blend of newsprint (63%), corrugated (16%) and office paper (21%) in paperboard (1992 North American Pulp & Paper Factbook, San Francisco: Miller Freeman, Inc., 1991, p. 275) MSW Middle of range given in Kiser and Burton, 1992; higher than EPA, 1994 (4800 Btu/lb), slightly lower than Morris and Canzoneri, 1992 (5200 Btu/lb) II. Electricity Generation Grade of Paper kwh/ton (net) kwh/ton (gross) Ratio to MSW Notes Newsprint Gross rate calculated by applying ratio of Btu value of newsprint to MSWto gross rate for MSWbelow; net rate is 12.5% of gross rate, as explained in note for MSWvalue below Corrugated Gross rate calculated by applying ratio of Btu value of newsprint to MSWto gross rate for MSWbelow; net rate is 12.5% of gross rate, as explained in note for MSWvalue below Office Paper Gross rate calculated by applying ratio of Btu value of newsprint to MSWto gross rate for MSWbelow; net rate is 12.5% of gross rate, as explained in note for MSWvalue below Paperboard Gross rate calculated using typical blend of newsprint (63%), corrugated (16%) and office paper (21%) in paperboard taken from 1992 North American Pulp & Paper Factbook, op. cit., p. 275; net rate as for other grades MSW Gross rate taken from Franklin Associates, 1994 and Kiser and Burton, 1992; net rate calculated assuming 12.5% of energy generated is utilized internally, which is midpoint of range (10-15%) given by Franklin A ssociates and Kiser and Burton 126
134 APPENDIX B: Continued Table B-3: Elemental contents Sulfur Content (percent) Grade of Paper Hollander 1980 Stillman 1983 Churney 1985 Alter 1974 M arr 1976 Tellus 1992 Typical value Ratio to MSW as received as received as received dry wt as received Paper < Newsprint Corrugated Office Paper Paperboard M SW combustible fxn Chlorine Content (percent) Grade of Paper Hollander 1980 Churney 1985 Ege/Brown 1990 Stillman 1983 Alter 1974 Marr 1976 Tellus 1992 Typical value as received as received as received dry wt as received Paper Unbleached Bleached Newsprint Corrugated Office Paper Paperboard M SW combustible fxn Nitrogen Content (percent) Grade of Paper Stillman 1983 Alter 1974 Tellus 1992 Typical value Ratio to M SW as received dry wt as received Paper < Newsprint Corrugated Office Paper Paperboard M SW Carbon Content (percent) Grade of Paper Stillman 1983 Alter 1974 Zerbe 1993 Tellus 1992 Typical value Ratio to M SW as received dry wt as received as received Paper Newsprint Corrugated Office Paper Paperboard MSW
135 APPENDIX B: Continued References Cited: Alter, H. et al. (1974) Chemical Analyses of the Organic Portions of Household Refuse; the Effect of Certain Elements on Incineration and Resource Recovery, Solid Wastes Management 64(12): Ege, H.D. and Brown, H.T. (1990) Designing for a Changing Fuel Stream, Solid Waste and Power, December, pp Franklin Associates, The Role of Recycling in Integrated Solid Waste Management to the Year 2000, prepared for Keep America Beautiful, Stamford, CT, September 1994, Chapter 6 and Appendix I. Hollander, H.I. et al. (1980) A Comprehensive Municipal Refuse Characterization Program, 1980 National Waste Processing Conference, The American Society of Mechanical Engineers, pp Kiser, J.V.L. and Burton, B.K. (1992) Energy From Municipal Waste: Picking Up Where Recycling Leaves Off, Waste Age, November, pp Kosson, D.S., T.T. Kosson and H. van der Sloot (1993) Evaluation of Solidification/Stabilization Treatment Processes for Municipal Solid Waste Combustion Residues, prepared for the U.S. Environmental Protection Agency, Risk Reduction Laboratory, Cincinnati OH, p. 56. Marr, H.E. et al. (1976) Concentration and Source of Trace Elements in the Combustible Fraction of Urban Refuse, Proceedings of the Fifth Mineral Waste Utilization Symposium, U.S. Bureau of Mines and IIT Research Institute, Chicago, Illinois, April 13-14, pp Morris, J. and D. Canzoneri (1992) Recycling Versus Incineration: An Energy Conservation Analysis, Sound Resource Management Group, Inc. (SRMG), Seattle, WA. Tellus Institute (1992) Assessing the Impacts of Production and Disposal of Packaging and Public Policy Measures to Alter Its Mix, prepared for the Council of State Governments, the U.S. Environmental Protection Agency, and the New Jersey Department of Environmental Protection and Energy, May 1992, Report #4, "Impacts of Production and Disposal of Packaging Materials - Methods and Case Studies," Chapter 2, citing SGS Engineers (1990) "NYC Solid Waste Ultimate Analysis." Stillman, G.I. (1983) Municipal Solid Waste (Garbage): Problems and Benefits, Annals New York Academy of Sciences 75(2): Zerbe, J.I. (1993) Reduction of Atmospheric Carbon Emissions Through Dispacement of Fossil Fuels, World Resource Review 5(4). 128
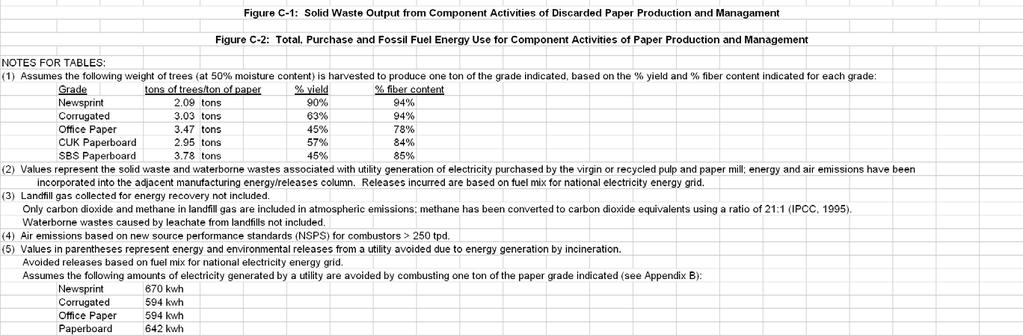
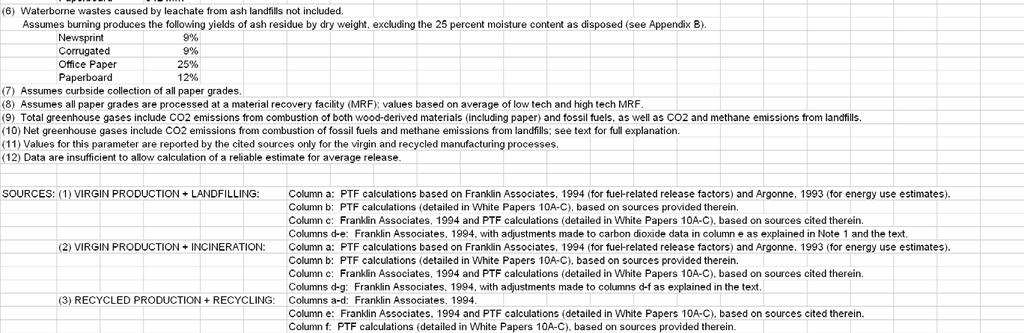
136 129
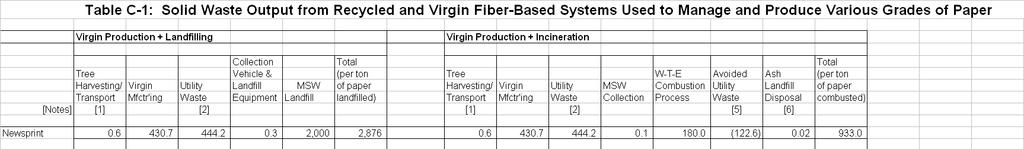
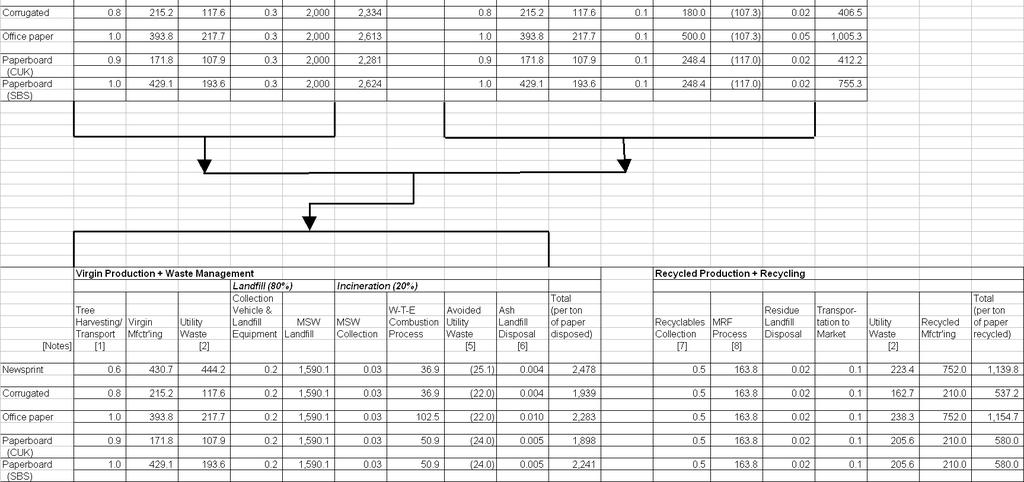
137 130
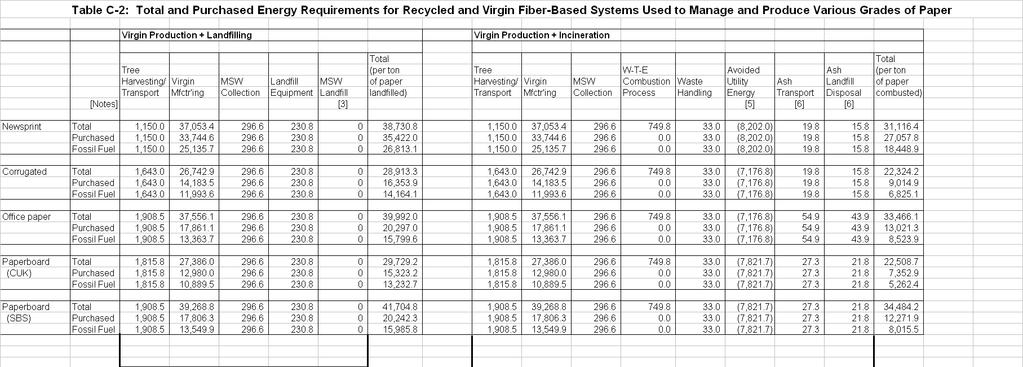
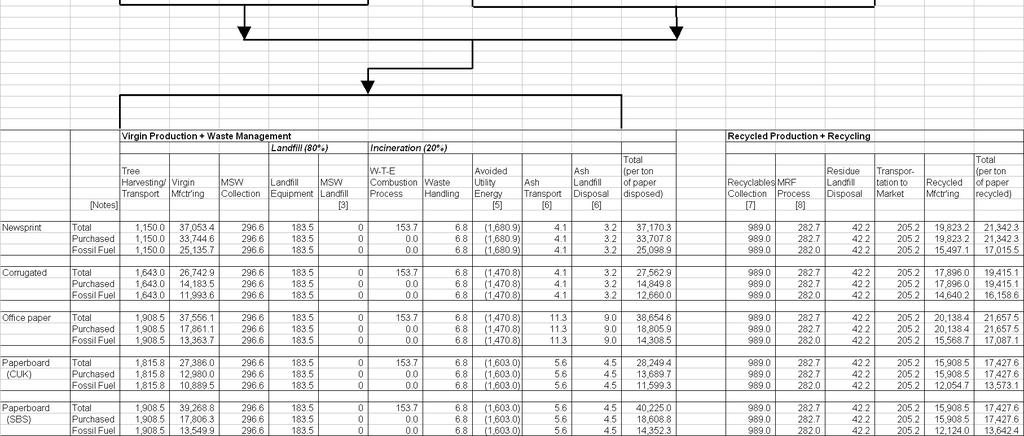
138 131
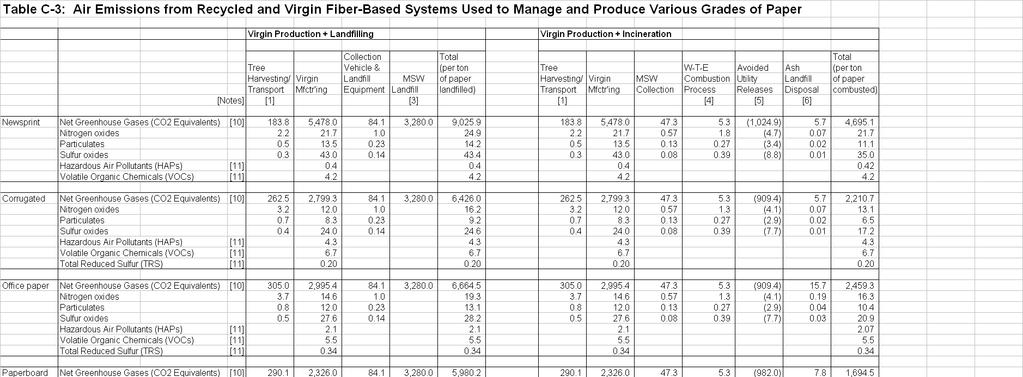
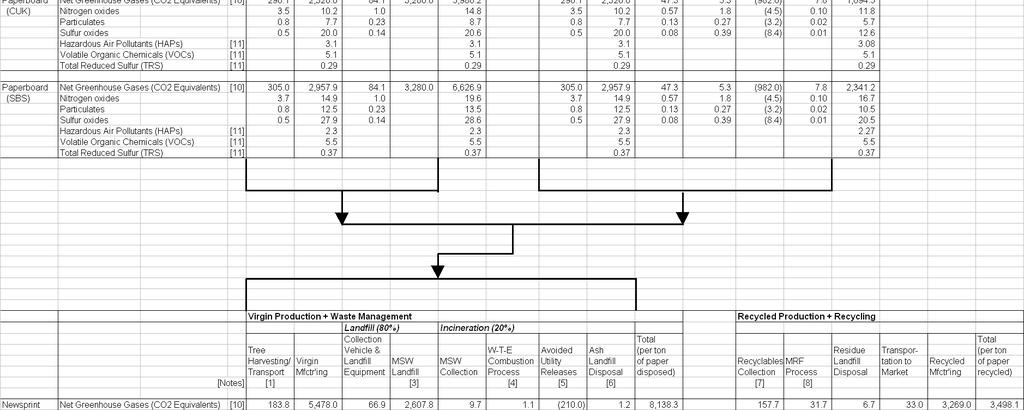
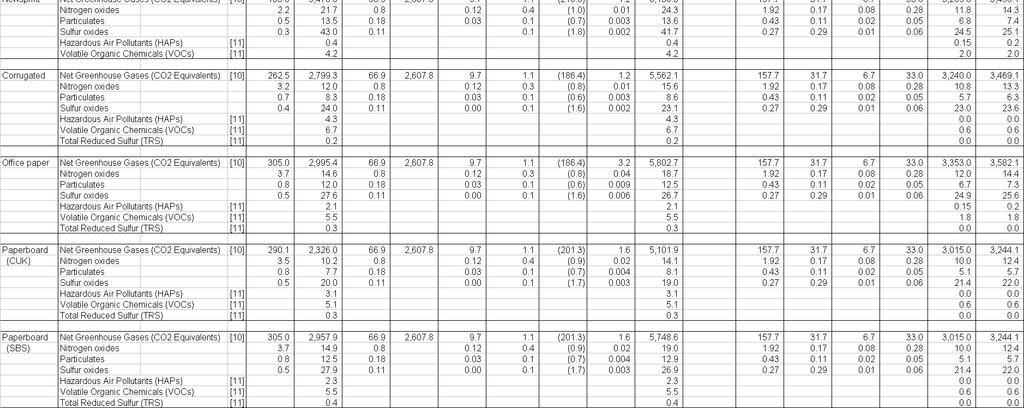
139 132
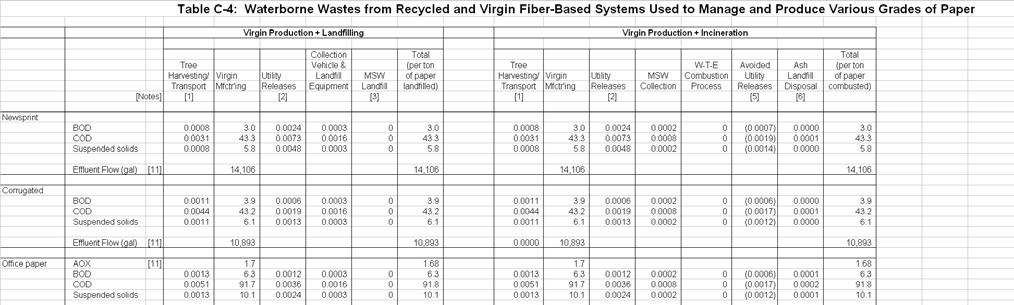
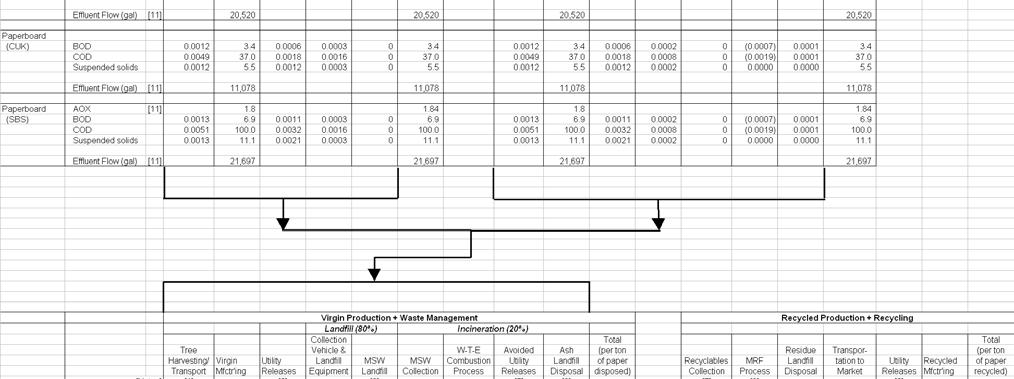

140 133