Bio 430: Chemicals in the environment. Jeffrey Jenkins Department of Environmental and Molecular Toxicology Oregon State University
|
|
|
- Milo King
- 5 years ago
- Views:
Transcription
1 Bio 430: Chemicals in the environment Jeffrey Jenkins Department of Environmental and Molecular Toxicology


2 Chemical fate: transformation and transport within and between Soil-Air-Water-Biota Source: U.S. Geological Survey
3 Chemical fate processes wind erosion wash off plant uptake interception volatilization sorption to soil particles leach toward groundwater photodegradation runoff microbial or chemical degradation
4 Chemical fate processes atmosphere direct + indirect photolysis runoff groundwater infiltration/ exfiltration air/water exchange wet + dry deposition chemical + biological transformation sediment/water water exchange sorption to sediment and particles chemical + biological transformation sediments photodegradation outflow
5 Chemical fate in the environment Molecular interactions (physical-chemical properties, reactivities) Environmental factors (Temperature, ph, light intensity, ion composition and strength, microbial activity, natural organic matter, etc.) Environmental processes (e.g. air/water exchange, sorption/desorption, chemical, photochemical and biological transformation)
6 Chemical fate in the environment Transport and mixing processes Dynamic behavior in a natural system (mathematical models and field investigations)
7 Chemicals in the Environment Initial distribution to environment (manufacture and use): emission in: air-soil-water-biota compartments Transformation: degradation/metabolism Redistribution- transport in and between compartments: diffusion/advection-dispersion/mass transport
8 Chemicals in the Environment Understanding chemical fate, what scale? Local scale: site-specific inputs, potential for off-site transport. Watershed scale: integration of site-specific inputs and transport, particular emphasis on water quality. Regional scale: integration of watershedairshed chemical inputs and redistribution, long range transport of persistent compounds.


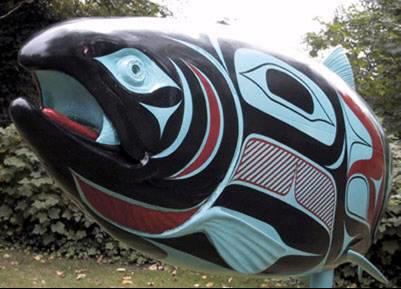
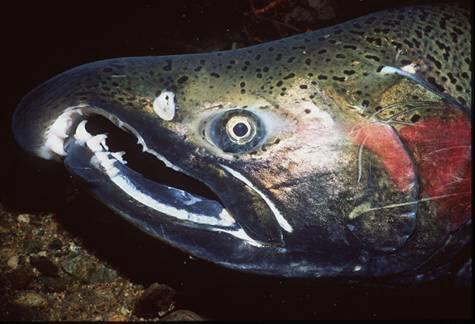
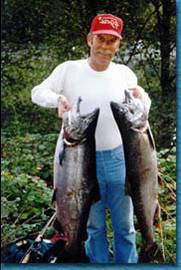
9 Range of ESA Listed Salmon


10 Pesticides in the Environment Initial distribution in the environment: method of application timing of application frequency of application amount of active ingredient formulation (other ingredients)
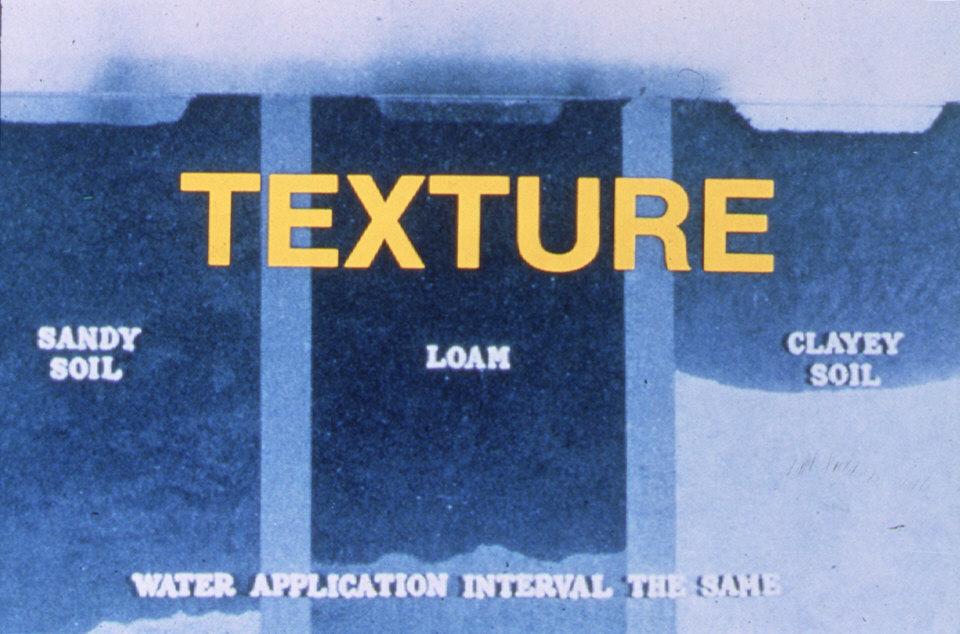
11 Environmental Behavior of Pesticides in Soils Initial distribution temperature soil ph soil texture Persistence and Mobility Environmental Fate sunlight organic matter moisture
12 Pesticide Fate and Transport Physical-chemical properties: Water solubility Vapor Pressure Kd (soil/water partition coefficient) Henrys Law Constant Soil half-life Foliar half-life
13 Sorption binding to soil or sediment particles
14 Soil sorption soil particle concentration of pesticide sorbed to soil soil water K d concentration of pesticide in solution K d describes the relationship between pesticide sorbed to soil particles and pesticide dissolved in soil water.
15 Soil sorption To account for different soil types and organic matter content the K d is normalized for % organic carbon. K = K % organic carbon d oc * * decimal equivalent
16 Soil Properties that Influence Leaching and Runoff Permeability Water table conditions Organic matter content Clay content
17

18 Course textured soils and other soil conditions that result in preferential flow paths must also be considered.

19 Pesticides in Ground and Surface Water
20 Pesticides in surface water Mass transfer primarily in the dissolved phase, will vary with pesticide s solubility in water and soil sorption. soil particle water concentration of pesticide sorbed to soil concentration of pesticide in solution
21 Partitioning between soil compartments (soil, water air) soil water air soil particle Chemical in water K h chemical in air K d K h describes the relationship between pesticide concentration in soil water and pesticide concentration in air.
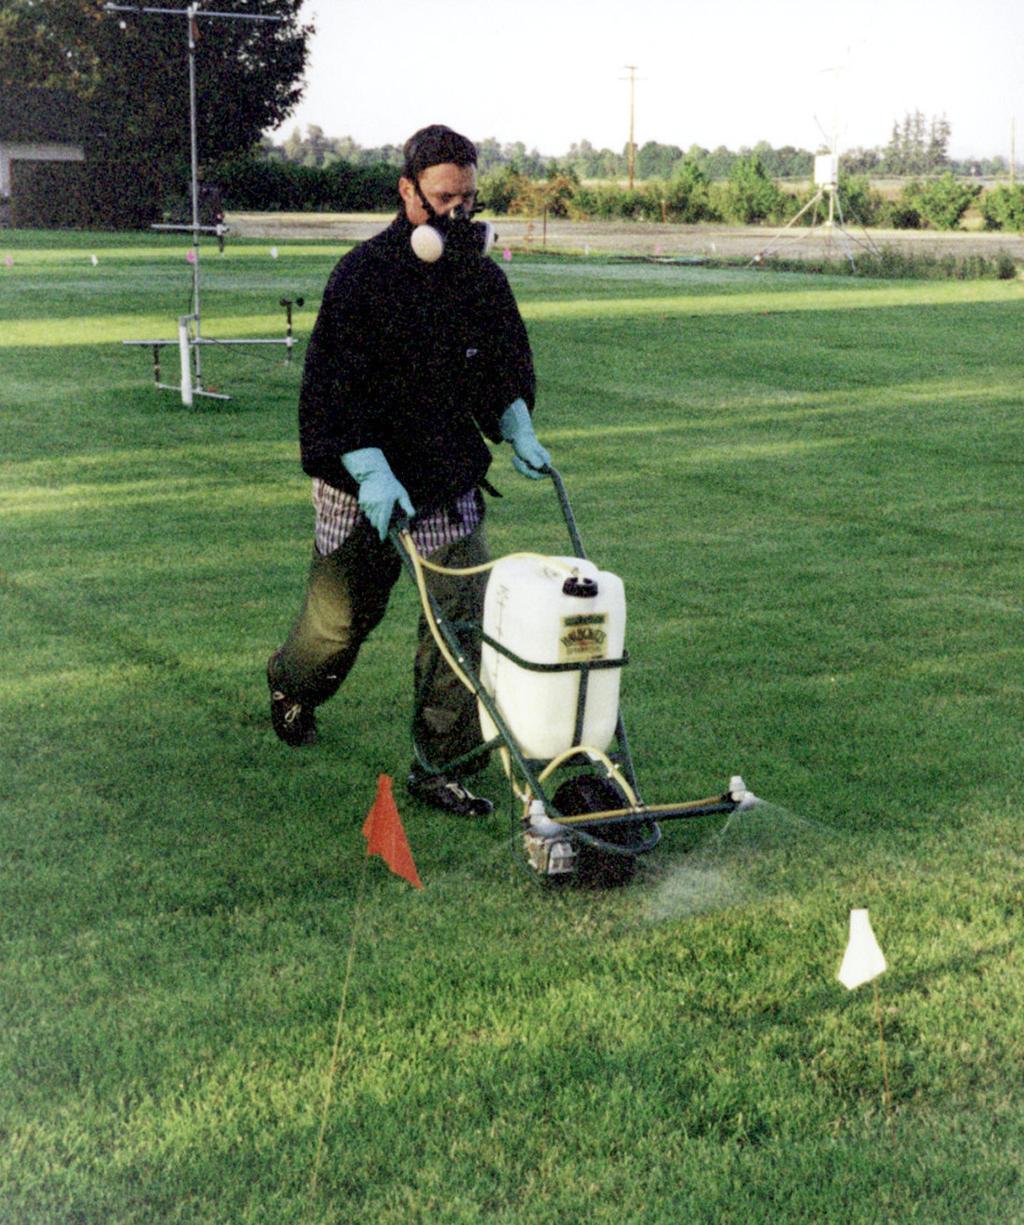
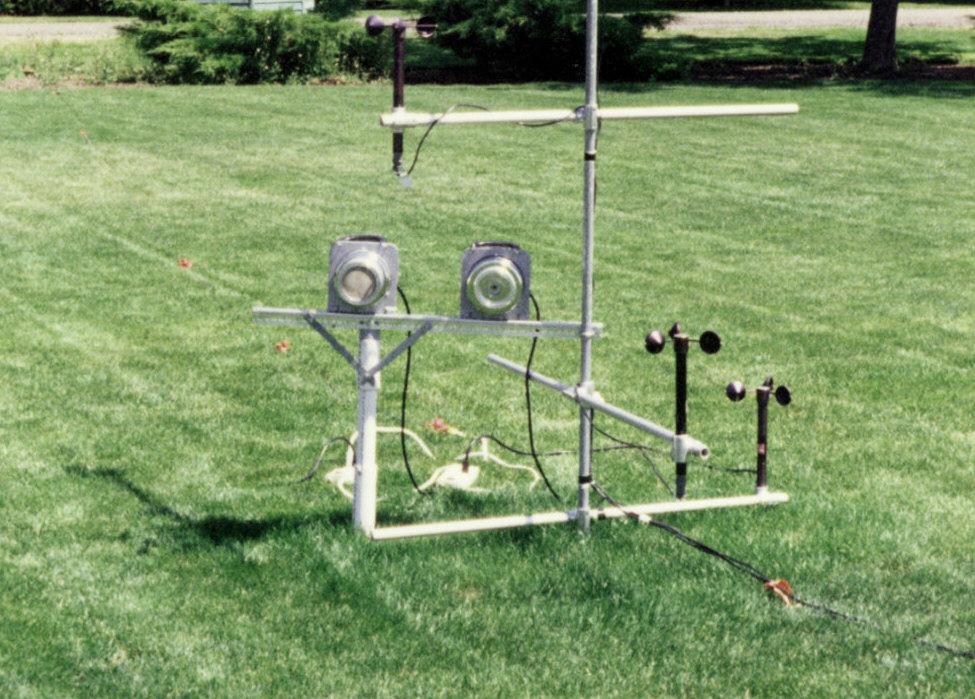
22 Volatilization volatile loss from plant, water, or soil surfaces

23 Atmospheric Transport Zones
24
25
26 Volatile loss as Percent Applied Pesticide Application Rate (kg a.i./ha) Vapor Pressure 25 o C) 24 hr Volatile loss as % Applied Chlorpyrifos Ethofumesate Triclopyr (acid) Triadimefon Propiconazole Cyfluthrin ND
27 Pesticide Fate Field dissipation: sum of chemical and biological processes including: Chemical degradation 1 Biological degradation (microbial + plant) 1 Photodegradation 2 Volatilization 1 Approximated with a 1 st order rate constant 2 Approximated with a psuedo 1 st order rate constant
28 Pesticide degradation half-life Half-life = the amount of time it takes the parent compound to decay to half its original amount Half-life in an environmental compartment: (soil-air-water-biota) sum of all degradation and transport pathways
29 Pesticide degradation half-life No of ½ lives % amount remaining
30 Sunlight photolysis of an aqueous suspension of nitrofen Cl OH OH Cl OH Cl OH HO OH Cl POLYMER Cl O NO 2 HO OH nitrofen Cl HO Cl O NH 2 HO NH 2 HO NH 2 Cl Cl Cl O N N O Cl
31 Chemical and microbial degradation of chloroanilines OH Cl NH 2 Cl COOH CHO Cl OH COOH CO 2 H 2 O A. faecalis COOH Cl O 2 OH OH O O COOH NH 2 Cl Ps. diminuta Cl O 2 Cl COOH COOH HOOC O COOH
32 LD 50 : lethal dose for ½ the test animals NOAEL
33 Aldicarb degradation pathways and LD 50 values (rat acute oral) H 3 C S CH 3 O N N CH 3 CH O 3 H 2 0 CH 3 CH 3 S H C N OH S 3 H N 3 C CH 3 CH 3 Aldicarb 0.9 mg/kg O 2, fast oxime 2380 mg/kg nitrile 570 mg/kg H 3 C O S CH 3 O N N CH 3 CH O 3 H 2 0 H 3 C O S CH 3 CH 3 N OH H 3 C O S CH 3 CH 3 N sulfoxide 0.9 mg/kg O 2 sufoxide oxime 8060 mg/kg sulfone nitrile 4000 mg/kg H 3 C O S O CH 3 O N N CH 3 CH O 3 H 2 0 H 3 C O S O CH 3 CH 3 N OH H 3 C O S O CH 3 CH 3 N sulfone 24 mg/kg sulfone oxime 1590 mg/kg sulfone nitrile 350 mg/kg
34 Pesticide Properties used to evaluate fate in the Environment water sol ppm Koc ml/g Vapor pressure mm Hg soil 1/2 life days foliar 1/2 life days Atrazine E Diuron E MCPA ester E pendimethalin E triclopyr ester E carbaryl E chlorpyrifos E malathion E esfenvalerate E
35 Chemical fate determines exposure to humans and aquatic life Chemical fate processes wind erosion photodegradation volatilization plant uptake sorption to soil particles leach toward groundwater runoff microbial or chemical degradation
36 13.4 million lbs of pesticides used annually in Oregon What are the risks and who decides? Federal Insecticide, Fungicide, and Rodenticide Act regulates pesticide manufacture, use, storage, and disposal (benefit-risk balancing statute.) Under Authority of the Clean Water Act, ODEQ has the authority to set pesticide water quality standards for waters of the state (TMDLs). Under the Endangered Species Act NMFS and USFWS have the authority to set rules deemed necessary to prevent more species declines under a provision called Four D. EPA, NMFS, and USFWS have overlapping jurisdiction with regards to pesticide use and the Endangered Species Act.


37 EPA Risk Assessment Risk = f (exposure, toxicity) Source: Purdue University Pesticides Program
38 Pesticide Risk Assessment RFD: The Reference Dose is the amount of a pesticide residue a person could consume daily for 70 years with no harmful non-cancer effects.
39 Pesticide Risk Assessment The RFD is determined by dividing the NOAEL by a safety factor, usually between 100 and 1000, to account for uncertainty in extrapolating from animal studies and to protect sensitive individuals, including infants and children.
 HA - Health Advisory: EPA guidance for drinking water contaminants based on")
 and assuming 70 Kg person drinks 2 liters per day over a lifetime.")
40 Quantitative Assessment of Health Risks of Pesticides in Drinking Water MCL - The Maximum Contaminant Level permissible in water which is delivered to any user of a public water system (Safe Drinking Water Act; ~50 pesticides have MCLs) HA - Health Advisory: EPA guidance for drinking water contaminants based on lifetime exposure and noncarcinogenic endpoints. HA is derived from the DWEL. DWEL - Drinking Water Equivalent Level, based on the Reference Dose (RfD) and assuming 70 Kg person drinks 2 liters per day over a lifetime. The DWEL has been adjusted assuming that drinking water comprises 20% of the allowable daily intake.
 Chronic toxicity (low dose-long exposure) Most sensitive adverse effect Sensitive")
41 Pesticide Risk Assessment: Wildlife What is the toxicity of the pesticide and it s degradates to wildlife? Acute toxicity (high dose-short exposure) Chronic toxicity (low dose-long exposure) Most sensitive adverse effect Sensitive sentinel species
42 EPA Pesticide Aquatic Risk: Wildlife Toxicity Assessment Laboratory tests are used to determine the NOAEL in representative species. The hazard quotient is the ratio of the NOAEL to the expected environmental concentration. If the hazard quotient is greater than 1.0, the potential exists for adverse ecological effects.
43 Use of models for evaluating hazards associated with chemicals in the environment Models use a systems approach to understanding complex phenomenon. Computer based environmental models present a conceptual framework and a mathematical formulation of fate and transport between compartments (soil, air, water, biota) based upon scientific principles.
44 Environmental fate models PRZM and EXAMS (EPA) CalTOX (California EPA) Fugacity Model Levels I, II, III (Mackay) Gaussian plume models (EPA, NOAA)
45 Fugacity Model for Biphenyl
46 Fugacity Model for Biphenyl
47 How Do We Assess Risk? Follow the National Academy of Sciences (NAS) four-step risk assessment paradigm*: Hazard Identification Dose- Response Assessment Exposure Risk Characterization * From the National Research Council s Risk Assessment in the Federal Government: Managing the Process, 1983.