POTENTIAL ENERGY AND COST SAVINGS THROUGH PROPER TREATMENT OF HEATING AND COOLING SYSTEMS
|
|
|
- Blaze Rice
- 5 years ago
- Views:
Transcription

1 POTENTIAL ENERGY AND COST SAVINGS THROUGH PROPER TREATMENT OF HEATING AND COOLING SYSTEMS A Webinar for Facility Managers and Operators at Institutional and Industrial Facilities October 16, 2018 Jeremy Overmann, B.S. Ch. E., Water Treatment Specialist Institutional Water Treatment (IWT) Services
2 MAIN FACTORS AFFECTING COSTS 1. ENERGY EFFCIENCY: HEAT TRANSFER 2. MAINTENANCE AND REPAIR 3. EQUIPMENT LIFE / REPLACEMENT 4. WATER, SEWER, TREATMENT CHEMICAL

3 IMPACTS OF POOR WATER TREATMENT
4 IMPACTS OF POOR WATER TREATMENT Mineral Scale, Corrosion, Biological Growth Significantly reduce heat transfer Lower energy efficiency, increase costs Reduce equipment life Increase maintenance / cleaning costs / labor costs
5 IMPACTS OF POOR WATER TREATMENT Increased blowdown / bleed in boilers, cooling towers Higher water, sewer, and treatment chemical costs Lower energy efficiency for steam boiler if no heat recovery from blowdown

6 STEAM BOILER SYSTEMS

7
8 STEAM BOILER SYSTEMS Poor treatment / control can cause scale deposits Reduce boiler efficiency significantly 1/16 inch scale 4-11% loss of efficiency 1/8 inch ~ up to 18% loss of efficiency Can result in ruptured tubes (overheating) Increases cleaning (de-scaling) / maint. costs
9 EFFECT OF DEPOSITS ON HEAT TRANSFER EFFICIENCY Fire Side Water Side Fire Side Water Side Tube 600 F Wall 500 F 800 F Tube Wall 500 F 100 F Heat Loss 100 F Heat Loss Insulating Scale 200 F Heat Loss

10
11 STEAM BOILER, WATER DIAGRAM STEAM Condensate FEEDWATER BOILER BLOWDOWN (Bleed) Make-Up Water
12 Cycles of Concentration (COC) Number of times dissolved solids in the feedwater are concentrated in the boiler. Conductivity or chloride can be used to estimate. Example: Feedwater conductivity = 100 us/cm, Boiler = 3000 us/cm. Boiler COC based on feedwater = 3000/100 = 30. COC should be > 40, otherwise room for improvement
13 PERCENT BLOWDOWN Calculate directly from COC. %Blowdown = 100/COC. Example: COC = 10, Blowdown = 100/10 = 10% increase to 40, Blowdown = 100/40 = 2.5% Blowdown is lost water and treatment chemicals Blowdown means Fuel lost! Energy (Fuel) is consumed by water that is blown down the drain!
14 STEAM BOILER SYSTEMS Often, if treatment / control are poor, blowdown (bleed) can be reduced resulting in: Higher Cycles of Concentration Energy / Fuel savings, due to less blowdown Reduced treatment chemical use Reduced water use (less make-up water)

15 REVERSE OSMOSIS SYSTEMS
16 STEAM BOILER SYSTEMS Reverse Osmosis (RO) System RO provides very clean water, resulting in higher COC in boiler and reduced blowdown (up to 70% lower) Significantly decreases boiler energy/ fuel use, ~ 5% or more depending on thickness of original scale Treatment chemical use decreases 50-90% Greatly reduces need for boiler cleaning, can remove existing scale Lower alkalinity reduces corrosivity of condensate; can increase condensate purity by reducing carryover
17 WHEN IS AN RO SYSTEM ECONOMICAL? If you have poor quality Feedwater (conductivity > 100 us/cm) If system has a high make-up rate (typically > 20 %) Larger boiler systems (typically > 350 Boiler Horse Power) Must be determined case by case Typical payback 1 2 years

18 COOLING TOWERS / EVAPORATIVE CONDENSERS
19 EFFECTS OF POOR WATER TREATMENT MINERAL SCALE DEPOSITS CORROSION BACTERIA, ALGAE, BIOFILM ON SURFACE LEGIONELLA BACTERIA HEALTH RISK
20 MINERAL SCALE DEPOSITS REDUCE COOLING TOWER EFFICIENCY Increase electricity use & cost REDUCE CHILLER ENERGY EFFICIENCY 1/32 scale on condenser ~ 9% reduction 1/16 scale ~ 14% reduction INCREASE CLEANING / MAINT. COSTS Cooling Tower & Chiller (condenser tubes)

21

22

23
24 CORROSION DEPOSITS REDUCE TOWER AND CHILLER EFFICIENCY REDUCE LIFE OF CHILLER AND TOWER INCREASE DIFFICULTY OF REMOVING BACTERIA / BIOFILMS

25
26 BACTERIA / BIOFILM VERY LOW HEAT TRANSFER COEFFICIENT Reduces chiller efficiency greatly 1/16 film up to 35% loss of efficiency INCREASES CORROSION UNDER THE BIOFILM Reduces life of Chiller tubes and Tower Increases maint. / repair costs CAN CAUSE LEGIONNAIRES DISEASE Transmitted by inhaling droplets / mist Biofilm protects Legionella bacteria

27

28

29
30 Cooling Tower Water Usage COC Evap. Blowdown Total Used
31 Cooling Tower Chemical Usage COC Dosage lb/1000 gal Tower Conc. mg/l
32 COOLING TOWERS / EVAPORATIVE CONDENSERS If chemical treatment / control is poor or non-existent, a good treatment program can: Reduce energy use in chiller (and tower) $10,800 saved /yr, for 500 ton chiller, 6 months, 12 hrs/ day, 0.9 KWH/ton, $0.08/kWh, after 1/16 scale removed Reduce water and sewer use Reduce treatment chemical use Reduce operating costs Reduce equipment maintenance costs Prolong equipment life Reduce the risk of Legionnaires Disease
33 CLOSED LOOP HEATING & COOLING SYSTEMS
34 CLOSED LOOP HEATING & COOLING SYSTEMS Filled with water or solutions of ethylene or propylene glycol No exposure to the atmosphere, normally no evaporation of water Ideally loses less than 5% of system volume per year. Reality: many systems have larger leaks Transfer heat or cooling from equipment such as heat exchangers, chillers, and boilers to the areas that require heating or cooling. Various types: Low Temperature Hot Water (LTHW), Medium Temperature Water (MTW), High Temperature Hot Water (HTHW or HTW), Chilled Water (CW), ALSO GEOTHERMAL LOOPS.

35

36
37 EFFECTS OF POOR / NO WATER TREATMENT Corrosion or poor protection from corrosion; leaks! Microbiological growth: Bacteria / Fungi < 55 deg. C (131 deg. F) and no glycol present. Also found in higher temp systems if dead legs / low flow areas. Cause corrosion, can produce ammonia High Ammonia: very corrosive to copper Glycol systems can experience decomposition with age, high temp, or due to bacteria if glycol concentration < 20%. Decomposed glycol typically has a low ph and is very corrosive.

38

39
40 INSTITUTIONAL WATER TREATMENT PROGRAM (IWT) Started in 1949 at IL. State Water Survey. Founder: Russel W. Lane, published book on water treatment, Years of experience in water treatment. Service and consulting: institutional / industrial heating/cooling systems, potable water Numerous research projects: Corrosion, lead/copper, scale, cooling tower treatment, potable water treatment, monitoring tech, gadgets (esp. magnets)
41 OVERVIEW OF PROGRAM Currently serve ~120 facilities in IL., including Prisons, Mental Health Centers, Universities, High Rise buildings Saves State Millions $ annually: energy, water, treatment chemicals, maintenance, equipment Can also save private companies $, past projects: heating/cooling system evaluation, treatment consulting, cooling tower treatment technologies (evaluation)
42 SERVICES OFFERED 1. On-Site Corrosion Testing / Monitoring 2. Thorough, Unbiased Lab Analysis Water and Glycol samples Corrosion and Deposit samples (solids /sludge) 3. Unbiased Ongoing Water Treatment Service and Consulting (what we do for current clients): heating, cooling, potable water systems 4. 3 rd Party Audit of water systems Energy, Water, Chemical savings Deficiencies in current treatment program
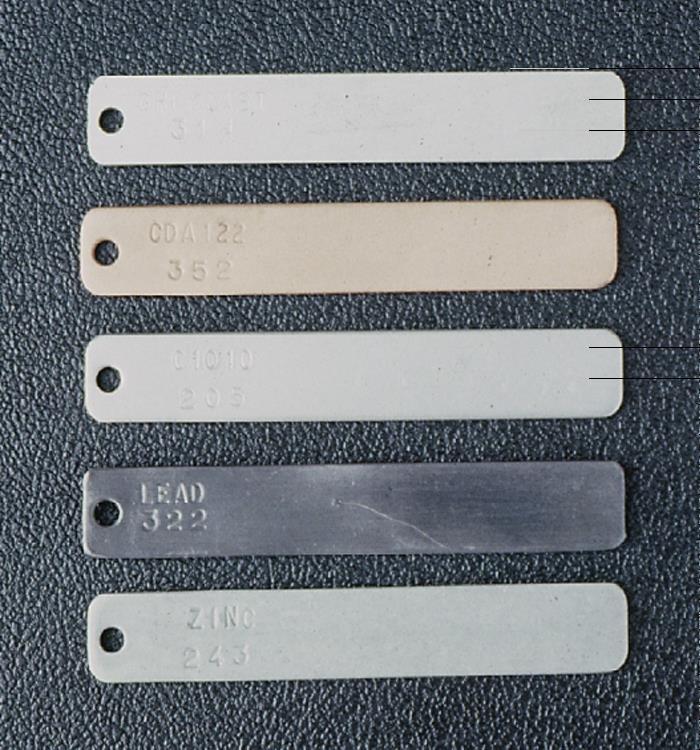
43 ON-SITE CORROSION TESTING Standard Test Method using metal test specimens (coupons) Various metals; Mild Steel and Copper most common Specimens installed in system for 3 12 months Corrosion rate determined by weight loss of metal
44

45
46 IWT LAB ANALYSIS OF WATER SAMPLES Very thorough analyses Have developed some custom analytical methods for specific systems Capability to analyze > 50 different key parameters in heating, cooling, boiler, condensate, make-up (ie: Softener, RO), raw (wells, lakes, rivers), and potable water systems
47 IWT LAB ANALYSIS OF WATER SAMPLES Benefits of Lab Analysis: Unbiased 3 rd party results Find evidence of corrosion Determine scale and corrosion indices (Potable) Bacteria + Fungi levels: Cooling Tower, Closed Loops, other Determine corrosion & scale inhibitor levels Determine metals present Expert report of results including recommendations
48 IWT LAB ANALYSIS OF SCALE AND DEPOSITS Benefits: Can help determine source / cause of deposit Info can be used to recommend a solution Knowledge of presence / absence of metals
49 WATER TREATMENT SERVICE AND CONSULTING Begins with evaluation of source water and current systems: design and materials of construction Then, treatment plan developed for each system Treatment control charts for operators Includes recommended on-site tests, intervals If needed, system operators can be trained on test procedures and treatment application IWT Field Chemist visits 1 6 times per year Test systems, collect samples for lab, report
50 Benefits of Ongoing IWT Service Control of corrosion, scale, and biofouling Increases energy / water efficiency Reduces chemical treatment costs Reduces maintenance / cleaning costs Extends equipment life Reduces system down-time Reduces risk of Legionnaire s Disease from Recirc. Domestic Hot Water and Cooling Towers IWT monitors trends, can prevent serious damage
51 Benefits of Continual IWT Service (cont.) Can detect changes in source water quality which will affect systems, and then change treatment plan Provide consulting for client questions (phone, ) Can ensure compliance with wastewater discharge permits and regulations (ie: molybdenum in Cooling Tower Blowdown water) Can provide annual water and energy efficiency reports (if client has data)
, degraded testing")
52 UNBIASED 3 RD PARTY AUDIT OF WATER SYSTEMS Evaluate individual systems Look for potential for reducing energy, water, and treatment chemical use; unbiased assessment Determine performance of current treatment, a second set of eyes Discover possible deficiencies: Corrosion, Scale, Biofouling, unsafe Dom Hot Water condition (Legionnaire s Disease risk), degraded testing chemicals
53 UNBIASED 3 RD PARTY AUDIT (CONT.) Collect equipment, history, current treatment, and operating data on-site Test system samples on-site Collect samples for full lab analysis (water, glycol, scale /deposit)
54 UNBIASED 3 RD PARTY AUDIT (CONT.) Use data and sample results to evaluate present treatment and control of system List any deficiencies found For State institutions (IL), we can recommend chemicals from the state bid list, often 10x less $ than proprietary treatment from a vendor. Give unbiased recommendations to mitigate any deficiencies or problems found, and treatment and control changes that will improve energy, water, and/or chemical treatment efficiency and thus save $

55 INSTITUTIONAL WATER TREATMENT SERVICES CONTACT US TO SCHEDULE A SITE VISIT! Jeremy Overmann, B.S. Ch. E., Water Treatment Specialist Phone jovermann@illinois.edu Jenn Tapuaiga, Coordinator of IWT Field Services Phone jenn210@illinois.edu Mike Springman, Environmental Engineer, Manager Phone springma@illinois.edu