Carbon Footprint and Life. Experience. Christian Leroy, ESTAL Congress Sept 2009
|
|
|
- Calvin Hawkins
- 5 years ago
- Views:
Transcription
1 Carbon Footprint and Life Cycle Analysis: the EAA Experience Christian Leroy, ESTAL Congress Sept 2009
2 Executive Committee General Assembly 2009 Market groups - Packaging - Building - Automotive & Transport Service Providers - Communication & Public Affairs - EHS & Product sustainability - Standards - Education Statistics & Technology Alu-related associations (World, Europe & national) Divisions - Primary - Rollers - Extruders - OEA (Recycling) - EAFA (Foil)


3 Sustainable Development A Global Objective development that meets the needs of the present without compromising the ability of future generations to meet their own needs -- Brundtland Commission, 1987 All three areas should be equally addressed


4 Sectoral approach: SD Indicators for the European Al industry CONTENTS: 1. PRODUCTION 2. POLICY AND MANAGEMENT EFFORTS 3. COMPETITIVENESS 4. REVENUES AND INVESTMENTS 5. EMPLOYEE DEVELOPMENT AND RELATIONS 6. COMMUNITY RELATIONS. 7. HEALTH AND SAFETY. 8. RESOURCE USE AT GLOBAL LEVEL 9. RESOURCE USE AT EUROPEAN LEVEL 10. EMISSIONS 11. PRODUCT LIFE CYCLE


5 Life Cycle Assessment : measuring the environmental dimensions of sustainability Focus: process, product or service
6 What is Life Cycle Assessment? Evaluation of the inputs, outputs and potential environmental impacts of a product throughout its life cycle Inputs from other Product Systems SORTING SHREDDING VEHICLE SERVICE Outputs to other Product Systems VEHICLE ASSEMBLY Inputs from Nature REMELTING Outputs to Nature PARTS MANUFACTURE BAUXITE EXTRACTION ALUMINA REFINING PRIMARY SMELTING INGOT CASTING FABRICATION (Sheet, extrusions, castings)
7 Bauxite What is included in an LCA of an Aluminium Product? Coal Salt 1. An inventory of all resources taken out of the earths crust or Ore Lime taken from other product systems Gas Oil Water to produce, use and recycle the specified product

8 What is included in an LCA of an Al Product? CO H 2 SO4 2- Dust VOC NO x CO 2 CF 4 PAH HCl SO 2 Cr(III) Acidification 2. An inventory of all emissions to air, water and soil affecting the environment during production, use and recycling of the specified product Global Warming i.e. Carbon footprint Summer Smog Waste Health Eutrophication Ozone Depletion
9 LCA - An Ecological Balance Sheet Looking at Selected Environmental Indicators Terrestrial Eutrophication Ozone Layer Depletion Ecosystems Toxicity Cumulative Energy Demand Use of Natural resources Land Use Carbon footprint Acidification Acidification Deforestation Which indicators are most important and the focus of (today s) attention? Aquatic Eutrophication Water Consumption Non-renewable Energy Resources Fine Particles Other Human Toxicity
10 What about the building sector LCA of roofing materials Global Warming Potential in kg - GWP Equivalent kg - GWP Equivalent per m2 15,00 10,00 5,00 95% Recycling Rate! Use phase not included! 0,00 Zinc Copper Aluminium Stainless Steel Source: Fraunhofer Institute, ISI GDA
11 Other Impact Categories than Global Warming Potential Human Toxicity Potential per m 2 roofing 2,000 kg DCB-Eqv. 1,000 Red mud disposal not considered! 0,000 Zinc Copper Aluminium Stainless Steel Source: Fraunhofer Institute, ISI GDA
12 EAA has a long experience in LCI data & LCA Primary production Recycling Sheet, Foil, extrusion For 15 years, EAA publishes Life Cycle Inventory (LCI) data representative for aluminium production and transformation processes in Europe. Life Cycle Inventory data are part of the building blocks of LCA studies LCI datasets include ancillary materials production and ancillary processes

 datasets Interactive critical reviewing of the whole")

13 Update of the Environmental Profile Report Extensive environmental survey organised in 2006/2007 (reference year 2005) for developing/ modelling updated Life Cycle Inventory (LCI) datasets Interactive critical reviewing of the whole LCI project by a renown independent LCA expert, Professor Walter Klöpffer New report published in May 2008 and available on the EAA website


14 Special Publication Life Cycle Performance of Aluminium Applications Special Edition of The International Journal of LCA Volume 14 Supplement 1 May 2009
15 The three main steps of the average LCI datasets development 1. Calculation of foreground average data (i.e. processlevel data): collection, consolidation and averaging of input and output data for the various aluminium processes through European surveys 2. Development of Life Cycle models: use of LCA software, determination of material flows, combination of the aluminium processes or subprocesses, integration of supplementary processes (electricity production, ancillary materials, etc.). 3. Calculation of LCI datasets: Calculation of the elementary flows and associated environmental indicators for a pre-set of impact categories
16 Bauxite mining Material flow for the primary aluminium model Petrol coke Limestone mining Pitch production 395kg 93 kg 100% NaOH production Lime calcination Anode and paste production AIF3 production 130 kg 83 kg 536 kg 108 kg of anode butt 18.9kg 4259 kg bauxite Transport Alumina production Transport 1936 kg alumina Electrolysis (10% Söderberg/ 90% prebaked) 1006 kg liquid metal Cast house 1000 kg slab, billet, etc.
17 Main LCI data for 1 tonne of primary aluminium Main inputs (kg) Year Direct process Auxiliary Electricity Thermal energy Transport Total Total Total Main raw materials (kg) Bauxite 99,70% 0,30% 0% 0% 0% Limestone (calcium carbonate) 1% 68% 27% 27% 4% 261, ,4 Sodium chloride 0% 100% 0% 0% 0% 112, Fossil-based energy resources (kg) Crude oil 37% 2% 13% 45% 3% Hard coal (crude) 12% 4% 83% 1% 0% Brown coal (crude) 1% 9% 89% 0% 0% Natural gas (crude) 4% 4% 62% 29% 0% Main Emissions to air (kg) Carbon dioxide - CO 2 21% 4% 54% 21% 1% Nitrogen oxides - NO x 9% 3% 58% 19% 10% Sulphur dioxide -SO 2 34% 2% 44% 18% 2% 34,2 66,3 72 Methane CH 4 14% 4% 64% 17% 0% 14, Fluorides (particles) 100% 0% 0% 0% 0% 0,55 0,44 0,49 Hydrogen fluoride - HF 94% 0% 5% 0% 0% 0,6 0,71 0,75 Group PAH to air 100% 0% 0% 0% 0% 0,151 0,066 0,1 Benzo{a}pyrene 100% 0% 0% 0% 0% 0,0024 0,0018 0,0032 Tetrafluoromethane -CF 4 100% 0% 0% 0% 0% 0,109 0,16 0,252 Hexafluoroethane -C 2 F 6 100% 0% 0% 0% 0% 0,01 0,014 0,028
18 10 9 Carbon footrpint of primary aluminium production for Europe tonne CO2-equ uiv Electricity mainly used at electrolysis step Anode consumption and PFC emissions Transport (1%) Electricity (50%) Auxiliary (4%) Direct process (26%) Thermal energy (19%) 2 1 Mainly alumina process & anode production 0 GHG emission

19 Example of LCI model for semi-finished product fabrication: extrusion
20 Extrusion Direct energy input per tonne of finished profile (process data) Year Unit Extrusion Scrap Remelting Total Total total End use Energy Heavy Oil kg 0 0 0,4 Diesel and light fuel Oil kg 1 0,3 1,4 1,25 0,65 Natural Gas kg 47,7 25,6 73, Total thermal energy MJ Electricity kwh Thermal energy significantly down vs (-25%), slightly down vs (-7%) Electricity significantly down vs (-34%), slightly down vs (-4%)
21 Main LCI data (kg) per tonne of profile Year Inputs (kg) Total From electricity Total * Total * Aluminium ingot Fossil energy resources Crude oil 22,7 65% Hard coal 77,1 95% Brown coal 126,2 94% Natural gas 123,7 29% Outputs (kg) Aluminium extrusion Main air emissions CO % NOx 1,56 56% 1,1 1,5 SO2 2,6 92% 3,2 3,2 Dust 0,11 90% 0,47 0,69 Methane 1,58 58% 1,6 2,2 * Dross recycling not included in the model
22 LCI indicators per tonne of profile GHG emission: 726 kg CO2-equiv/tonne 69% from electricity Electricity model plays a very big role Use of EU25 electricity model (ref year 2002) EAA indicators (per tonne of aluminium profile) Total From electricity Abiotic Depletion (ADP) [kg Sb-Equiv.] 4,70 54% Acidification Potential (AP) [kg SO2-Equiv.] 3,80 82% Eutrophication Potential (EP) [kg Phosphate-Equiv.] 0,22 55% Greenhouse gas emission (GW P 100 years) [kg CO2-Equiv.] % Ozone Layer Depletion Potential (ODP, steady state) [kg R11-Equiv.] 1,22E-04 97% Photo-Oxidant Creation Potential (POCP) [kg Ethene-Equiv.] 0,23 76% Primary energy from renewable raw materials (net cal. value) [MJ] % Primary energy from non-renewable resources (net cal. value) [MJ] %
23 GHG per tonne of Al output Primary production 9677 kg CO2 equiv (50% electricity) 506 kg CO2 equiv (23% electricity) Recycling Sheet, Foil, extrusion 644 kg CO2 equiv (63% electricity) 1353 kg CO2 equiv (66% electricity) 726 kg CO2 equiv (69% electricity)
24 What about anodizing and powder coating processes? No European data available Cooperation EAA - ESTAL makes sense Benefits: Development of robust/verified LCI data on both processes Ability to communicate on environmental performances and indicators of both processes Benchmarking for ESTAL members and for future European update More robust data into Environmental Product Declarations (EPD) of building products

25 Sustainability assessment of buildings/construction is on track Environment Planet Certificate & Rating Social People Economic Profit
26 Environmental Product Declarations are essential elements EPDs Environment Planet Environmental Product Declaration Social People Economic Profit
27
28
29 Processes and life cycle stages of the EPD Extrusion Cooperation for data collection Thermal break Anodising process Complemen tary products EAA LC CI data availa able Rolling Composite production PE / Glue Surface treatment Coating process Manufacturing of product / Assemblage Erection EPD Social Environment Recycling Maintenan ce/ Repair Demolition Operat ion Economic EPD Environmental Product Declaration Building Performance Declaration
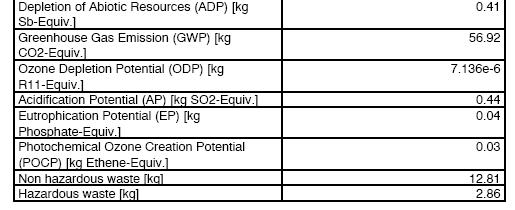
30 Result
31 Conclusions EPDs and building assessment schemes are on track in Europe Developing credible and robust environmental data and indicators on aluminium building products is a must Anodizing and powder coating are essential processes for numerous applications Joining the EAA and ESTAL forces make sense to close the gap