Economic growth, energy independence, and environmental stewardship for Wisconsin and its neighbors
|
|
|
- Julianna Richard
- 5 years ago
- Views:
Transcription

1 BioEnergy in the Midwest: Economic growth, energy independence, and environmental stewardship for Wisconsin and its neighbors Presented at the Heating the Midwest Conference By Dr. William Strauss President, FutureMetrics Co-founder and Director, Maine Energy Systems April, 2012 FutureMetrics Award Winning Consultants in BioEnergy
2 The slides in this presentation are organized as follows: First: What is the sustainable amount of biomass that can be used for fuel? Second: How many homes and businesses will that allow to convert to pellet fueled boilers? Third: What are the potential profits and cash flows? Last: Lots of material on the economic and environmental impacts of bioenergy in the Midwest. 2

3 This analysis assumes that pulp and paper mills and sawmills will remain at current capacity. Note: Does not include Pennsylvania Source: From the 25 x 25 Study, 3
4 Estimated Annual Sustainable Production of Bioenergy Feedstock in green tons (50% of estimate of total sustainable wood harvest ) State Wisconsin 4,964,000 Minnesota 2,494,000 Michigan 6,112,000 North Dakota 155,000 South Dakota 135,000 Iowa 1,195,000 Illinois 2,393,000 Indiana 2,675,000 Total 20,123,000 forestland (green tons). Merchantable biomass is the main stem of all species > 5 d.b.h. between a 1-foot stump height and a 4 top diameter (outside the bark), including rough and rotten culls. from attribute.jsp analysis by FutureMetrics A very rough estimate of sustainable biomass available for energy based on Forest Inventory Analysis (FIA) data million tons of green wood can make enough pellets for about 1.26 million homes and businesses. Note that these numbers do not include an analysis of the potential for dedicated energy crops 4
5 If we assume that each state provides biomass for its own needs, the table below shows the conversion rates. Wisconsin is highest proportionally with 10.12% of its homes and businesses converting. Michigan is highest in absolute numbers with 424,000 homes and businesses converting. Occupied Households Equivalent Number of Businesses and Other Total Number of Household Equivalents Total Biomass for Pellets Production per Year (green tons) Total Number Converting in each State if the is NO Interstate Transport of Pellets (based on 8 tons per user per year average) Wisconsin 2,624, ,846 3,407,204 4,964, % 344,722 Minnesota 2,347, ,170 3,047,371 2,494, % 173,194 Michigan 4,532,233 1,351,965 5,884,198 6,112, % 424,444 North Dakota 317,498 94, , , % 10,764 South Dakota 363, , , , % 9,375 Iowa 1,336, ,653 1,735,070 1,195, % 82,986 Illinois 5,296,715 1,580,010 6,876,725 2,393, % 166,181 Indiana 2,795, ,910 3,629,451 2,675, % 185,764 TOTAL 19,613,401 5,850,678 25,464,079 20,123,000 1,397,431 analysis by FutureMetrics 5
6 Given these levels of penetration and assuming $20/ton profit for pellet manufacturing and $20/ton profit for pellet fuel delivery, the annual profit for pellet flow is more than $447 million. Installing 1.6 million pellet boilers with an assumed margin of $3500 per unit yields a total gross margin on boiler sales of about $4.9 billion. Annual Profits from Pellet Sales Total Gross Margin on Boiler Sales Wisconsin $110,311,111 $1,206,527,778 Minnesota $55,422,222 $606,180,556 Michigan $135,822,222 $1,485,555,556 North Dakota $3,444,444 $37,673,611 South Dakota $3,000,000 $32,812,500 Iowa $26,555,556 $290,451,389 Illinois $53,177,778 $581,631,944 Indiana $59,444,444 $650,173,611 $447,177,778 $4,891,006,944 analysis by FutureMetrics 6
7 But why should we care about conversion to this form of renewable energy? 7
8 Economic Consequences and Energy Independence 8

9 9

10 United States Energy Policy? 10
11 The Opportunity is to replace Fuel Oil, Propane, and Electricity (glass half full = 30.9% not on natural gas) 11

12 12
13 At current heating oil prices, the Midwest states export more than 8 BILLION dollars per year* Number of Households that use Heating Oil or Propane Average Gallons Used per Year by all Users Average Total Expenditure Per Year (#2 at $3.80/gal) Amount that Does not Stay in the State (EXPORTED) Wisconsin 647, ,775,000 $ 2,028,345,000 $ 1,582,109,000 Minnesota 488, ,600,000 $ 1,529,880,000 $ 1,193,306,000 Michigan 765, ,125,000 $ 2,398,275,000 $ 1,870,655,000 North Dakota 103,000 84,975,000 $ 322,905,000 $ 251,866,000 South Dakota 137, ,025,000 $ 429,495, ,006,000 Iowa 312, ,400,000 $ 978,120, ,934,000 Illinois 413, ,725,000 $ 1,294,755,000 1,009,909,000 Indiana 436, ,700,000 $ 1,366,860,000 $ 1,066,151,000 Total 3,301,000 2,723,325,000 $ 10,348,635,000 $ 8,071,936,000 Source: US Energy Information Administration, 2012, US Census, analysis by FutureMetrics *The US EIA data shows that 78% of every dollar spent on heating oil 13 leaves the region and most of those dollars leave the country.
14 At current heating oil prices, about a half a million jobs are destroyed as money is drained from those states economies and sent to other places. #2 Distillate Fuel and Propane use in Residential, Commercial, and Industrial (not Transportation) Average Gallons per Year Money Exported from Regional Economy at $3.80/gal Permanent Job Destruction Wisconsin 533,775,000 ($1,582,109,100) -106,285 Minnesota 402,600,000 ($1,193,306,400) -71,296 Michigan 631,125,000 ($1,870,654,500) -114,132 North Dakota 84,975,000 ($251,865,900) -16,142 South Dakota 113,025,000 ($335,006,100) -21,551 Iowa 257,400,000 ($762,933,600) -45,841 Illinois 340,725,000 ($1,009,908,900) -54,736 Indiana 359,700,000 ($1,066,150,800) -65,279 2,723,325,000 ($8,071,935,300) -495,262 analysis by FutureMetrics 14

15 15

16 A lot of homes in the Midwest are connected to natural gas 16

17 But a significant number are not connected! 17
18 What if some of that dependence on heating oil were converted to biomass? Job Destruction would become Job Creation. This is due to three effects (they all have direct and multiplier effects): Money spent on fuel stays in the regional economy, Lower cost fuel releases money for investment and consumption, The supply chain for regionally produced fuels will create jobs. 18
19 How much of the Midwest can be converted depends on the SUSTAINABLE quantity of biomass. What is the SUSTAINABLE annual harvest from timberland? How much idle cropland and pastureland could be used for energy crops (we have ignored this in this analysis)? What uses other than biomass thermal applications of the sustainable harvest have a higher value added for the forest products industry? 19
20 Pulpwood Demand is Declining. Wood-to-Energy will Replace the demand that has traditionally come from that sector. 20


21 Wood pellet production for domestic use in the Midwestern states to replace heating oil. Modern wood pellet boilers are common in Europe and are growing in the use in the US. They are fully automatic, clean, and reliable. 21

22 Wood pellet fuel is common in Europe where more than a million homes have home heating systems automatically fueled with wood pellets. 22
23 Modern Wood Pellet Boilers are CLEAN and completely automatic 23


24 To put this into perspective, let s compare using one cord of wood in a fireplace and one cord of wood s worth of energy from wood pellets in a modern pellet boiler. 375 pounds Particulate emissions (SMOKE!) 0.28 pound 24


25 25
26 What if 20% of those homes in the Midwest that are using heating oil or propane convert to pellet heating systems? The three job creating effects and the multiplier effects will create or sustain more than 62,000 jobs. Income and Jobs if 20% Convert Total Permanent ANNUAL Income Total Permanent Jobs Wisconsin $ 52,859,986 9,154 Minnesota $ 132,184,725 11,484 Michigan $ 209,549,917 10,387 North Dakota $ 26,095,436 1,859 South Dakota $ 75,268,056 3,465 Iowa $ 164,607,776 7,359 Illinois $ 5,720,778 4,197 Indiana $ 416,385,723 14,723 $ 1,082,672,398 62,629 analysis by FutureMetrics 26
27 What is the Future for Renewable Energy? Europe is more than a decade ahead. Note the role of biomass in the European renewable energy portfolio. Solar and wind are less than 10% while biomass makes up 67% in the most recent year s data. Total Renewable Energy Production in Europe in 1000's of tons of oil equivalent (TOE) Year Solar energy 0.4% 0.4% 0.4% 0.5% 0.5% 0.6% 0.6% 0.7% 0.8% 0.9% 1.2% 1.6% Biomass 60.7% 60.5% 60.1% 59.2% 62.3% 64.1% 63.8% 65.4% 66.0% 66.8% 66.6% 66.8% Geothermal Energy 4.5% 4.7% 4.8% 4.5% 4.8% 5.0% 4.8% 4.6% 4.5% 4.3% 4.0% 3.9% Hydro power 31.3% 30.9% 30.8% 31.5% 27.2% 24.8% 24.5% 22.4% 21.4% 19.8% 19.6% 18.7% Wind power 1.0% 1.3% 1.9% 2.3% 3.1% 3.6% 4.5% 5.2% 5.7% 6.7% 7.2% 7.6% source: Eurostat Energy Statistics,
28 Environmental Advantages Using biofuel like wood pellets made from sustainably managed forests are carbon neutral in combustion.

29 Why should we care about CO 2? Era of Combustion of Fossil Fuels Thousands of Years Source: NOAA
![CCSR/NIES: Center for Climate System Research [1] & National Institute for Environmental Studies, [2], CCSR/NIES AGCM + CCSR OGCM Models 1890-2100 CCCma: Canadian Center for Climate Modelling and](/docs-images/89/99830477/images/30-1.jpg "Analysis [3], CGCm2 Model 1900-2100 CSIRO: Commonwealth Scientific and Industrial Research Organisation [4], CSIRO-Mk2 model 1961-2100 Hadley Centre: Hadley Centre for Climate Prediction and Research")
30 CCSR/NIES: Center for Climate System Research [1] & National Institute for Environmental Studies, [2], CCSR/NIES AGCM + CCSR OGCM Models CCCma: Canadian Center for Climate Modelling and Analysis [3], CGCm2 Model CSIRO: Commonwealth Scientific and Industrial Research Organisation [4], CSIRO-Mk2 model Hadley Centre: Hadley Centre for Climate Prediction and Research [5], HADCM3 model GFDL: Geophysical Fluid Dynamics Laboratory [6], R30 Model MPI-M: Max Planck Institute für Meteorologie [7], ECHAM4/OPYC coupled model NCAR PCM: National Center for Atmospheric Research [8], PCM model NCAR CSM: National Center for Atmospheric Research [9], CSM Model
31 an extensive dataset of 1,372 climate researchers and their publication and citation data show that 97% to 98% of the climate researchers most actively publishing in the field support the tenets of anthropogenic climate change From Expert credibility in climate change, published in the Proceedings of the National Academy of Sciences of the United States of America, June 21, 2010.
32 It is Really this Simple: Suppose we have a biomass fueled central heating plant for which 3650 tons per year are needed. That is 10 tons per day every day of the year. A northeastern forest can sustainably produce about one ton of new growth per acre per year. That means that the 3650 tons per year of biomass needed to fuel our CHP plant will need 3650 acres of forestland if we require that the forest does not shrink over time. For our CHP plant, 10 tons per day are harvested and delivered off of our 3650 acre FSC or SFI certified forest. But during that same day on our 3650 acre plot, 10 new tons of wood grow and sequester the amount of carbon that was just released. Combustion of wood from a sustainably managed forest is carbon neutral.
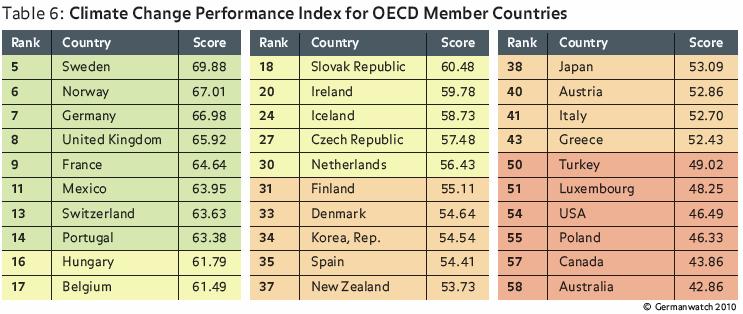
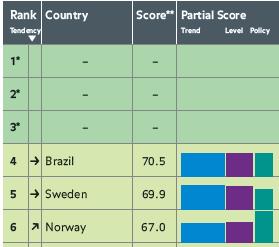
33 A case study Sweden 33
34 The smoothed trend in GDP per capita is virtually identical. 34

35 And as an added benefit. 35
36 36
37 The foundations for an energy independent low carbon future for heating our homes and businesses is in place: Fuel refineries exist (some call them pellet factories) and more can be built; European style pellet boilers and bulk fuel delivery are in the US now (see ); The forest products sector has a long history in the Midwest and can, as pulp and paper declines, supply the raw materials for fuel from our own region; There are hundreds of thousands of acres of fallow agricultural land that can grow fast rotation fuel crops. 37
38 The penalty for failure is dire! When oil prices rise and push heating oil from the current $3.80/gallon to $5.00/gallon, massive numbers of jobs will be lost if the midwest does not curtail its use of heating oil and propane. #2 Distillate Fuel and Propane use in Residential, Commercial, and Industrial (not Transportation) Average Gallons per Year Money Exported from Regional Economy at $3.80/gal Money Exported from Regional Economy at $5.00/gal Annual Increased Loss of Money if Heating Oil goes to $5.00/gal Permanent Job Destruction Wisconsin 533,775,000 $1,582,109,100 $2,081,722,500 ($499,613,400) -33,564 Minnesota 402,600,000 $1,193,306,400 $1,570,140,000 ($376,833,600) -22,515 Michigan 631,125,000 $1,870,654,500 $2,461,387,500 ($590,733,000) -36,042 North Dakota 84,975,000 $251,865,900 $331,402,500 ($79,536,600) -5,098 South Dakota 113,025,000 $335,006,100 $440,797,500 ($105,791,400) -6,805 Iowa 257,400,000 $762,933,600 $1,003,860,000 ($240,926,400) -14,476 Illinois 340,725,000 $1,009,908,900 $1,328,827,500 ($318,918,600) -17,285 Indiana 359,700,000 $1,066,150,800 $1,402,830,000 ($336,679,200) -20,615 2,723,325,000 $8,071,935,300 $10,620,967,500 ($2,549,032,200) -156,399 38

39
40 Thank you! William Strauss, PhD President, FutureMetrics FutureMetrics Globally Respected Consultants in BioEnergy 40