STUDIES ON ASSESSMENT OF VULNERABILITY TO DROUGHT
|
|
|
- Horatio Robinson
- 5 years ago
- Views:
Transcription


1 STUDIES ON ASSESSMENT OF VULNERABILITY TO DROUGHT By Dr Rakesh Kumar Scientist F & Head Surface water Hydrology Division NATIONAL INSTITUTE OF HYDROLOGY, ROORKEE , INDIA HYDROLOGIC EXTREMES: Two opposite faces of same coin Circumstances when there is FLOODS excess water that causes damage DROUGHTS deficit of water that causes scarcity in sustaining usual activities and life
2 HYDROLOGIC EVENTS Truncation Level Mean or Median Flood Low Flow High Flow Drought Day Months Years Time Unit
3 Drought differs from other natural hazards Slow-onset, creeping phenomenon (early warning systems, impact assessment, response) Absence of universal definition (leads to confusion and inaction) Severity is described through multiple indicators and indices Impacts are non-structural and spread over large areas RESULTS: Slow scientific advancement of drought early-warning, forewarning, vulnerability and preparedness systems
4 Critical issues in drought mitigation We are lacking in Data networks and Data sharing Early warning system and preparedness Drought forecasting Drought monitoring tools Integrated drought/climate/water supply monitoring Impact assessment methodologies Reactive to proactive response systems


5 Drought Prone Arid Semiarid Sub-humid Humid
6 Drought vulnerability scenario in India 120 million ha 185 districts in southern and western India 1173 development blocks 28 drought years in India, during 20th Century Seasonal rainfall deficits cause droughts and often lead to migration of people and livestock
7 Occurrence, population affected and damage from droughts in India (Source: Samra, Working Paper No 84, IWMI) 1900 Bengal - 13 lakh deaths Date State, region or district Population Affected (#) Loss/ Deaths (Rs.) July states 300 million million May states deaths Nov districts in Chattisgarh April states 90 million million March 1996 Rajasthan - - March states 1.2 million -- July 1987 Orissa deaths States + 4 UT 300 million 300 deaths April/ states 100 million Central India 100 million 2500 million 1972 Central India 100 million 2500 million Aug Mysore 166 million Rajasthan, Central India 0.5 million Kolkata, Bengal region - 15 lakh deaths
8 Drought management scenario in India Rainfall Monitoring 1. IMD 2. Revenue Department Crop Weather Watch Group District collector monitors the district MoA, Govt. of India IMD, CWC, ICAR, MoP, Ec & St. and others Revenue Tahsil, mandal, district Drought watch at state level State Relief Commissioner Estimation of Losses Declaration Responsibility of State Govt. Verification by Central Team Relief & Rehabilitation
9 Response to Drought in India Efforts have been largely on recovery from drought rather than proactive mitigation Strategies may be characterized as ad hoc, short-term and superficial: knee-jerk reaction Response is too little, too late
10 RISK OF DROUGHT Drought risk involves two major components (natural event) Climatology ( Physiographic & social factors) Population growth and shifts Urbanization Technology Soils and land use practices Environmental degradation Water use trends Government policies Awareness
11 OBJECTIVES Strengthening R & D Identify and characterize the drought indicative parameters -- meteorology, hydrology, agriculture and social in realizing drought and preparedness Prepare drought vulnerability scenario under different conditions at macro and micro levels (watershed or district / mandal / villages) Capacity building in understanding / realizing the preparedness and vulnerability
12 INPUT DATA Temporal satellite images of IRS, NOAA & INSAT Long term precipitation data ( years) Stream flow data Ground water levels Cropping system, crop coverage area, yield, and soil characteristics Human and cattle population and other water demanding activities, etc.
13 APPROACH Indicators of onset of drought Prevalent (meteorological, hydrological, agricultural and social) conditions Reported / experienced drought events Analysis and identification of pattern and critical parameters Monitoring of present day conditions Evaluation of threshold of critical parameters Deriving a drought susceptibility map and ground reality Assessing runoff storages and possibilities of enhancing runoff conservation Preparing geographically referenced systems for regional information base
14 Plan of Work Technology Transfer Characterization of drought susceptibility (Defining various Groups) Threshold for various indicators Time Series Event Evaluation Storage Potential Agril., human Cattle & Industry, etc Different rainfall scenario Cropped area vegetation Reservoir pond spread Rainfall Runoff Demand Assessment Deficit Computation Satellite Data Analysis Instrumentation Monitoring Data Collection

15 Location of Study Sub-basins in different states Sonar Sub-Basin in Damoh/Sagar M.P. Manar Sub-Basin in Nanded, Maharashtra Don Sub-Basin in Bijapur, Karnataka Lanth Sub-Basin in Bolangir, Orissa Sarala Sagar Sub-Basin in Mahboobnagar, A.P.
16 Particulars of sub-basins selected for the study Sl. No. Name of subbasin selected for study 1 Sonar subbasin Name of major river system Ken River (A tributary of River Yamuna) Geographical location (Districts/States) Damoh/Sagar districts in M.P. 2 Don sub-basin Krishna River Bijapur in Karnataka and Sangli district in M.S. 3 Lanth subbasin 4 Manar subbasin 5 Pedda Vagu up to Sarala Sagar Dam site Tel River (a tributary of River Mahanadi) Godavari Krishna River Bolangir in Orissa Nanded and Latur districts in Maharashtra Mahaboobnagar in A.P. Catchment area (Sq Km.) Mean Annual Rainfall (mm) (Dry subhumid) (Semi arid) (Subhumid) (Dry Subhumid) (Semi arid)
17 Status of drought at different sites during 2006 & & 2007, Meteorological- DROUGHT PREVAILED 2006 & 2007, Meteorological- DROUGHT PREVAILED Sl No. Name of the site Bijapur Near Normal Near Normal 2 Bolangir Near Normal Near Normal 3 Nanded Near Normal Near Normal 4 Damoh Drought prevailed 5 Mahboob -nagar Drought prevailed Drought prevailed Drought prevailed 2006 & 2007, Meteorological- DROUGHT PREVAILED
 P a = 100-450 mm E p = 2000-2500 mm North eastern")
 Pa = 450-700 mm")
18 E P and P a variation in India estern Rajasthan (Very low rainfall) P a = mm E p = mm North eastern region P a = 6400 mm E p = Central India Pa = mm Ep = mm South India (Low Rainfall) Pa = mm Ep = mm
19 Relationship of av. Drought Frequency with the E p /P a ratio (sub-humid, semi-arid and Arid) Wet Dry
20 %Deviation Relationship-Pae/PET & % Dev. Plot of Annual %Dep Vs Pae/PET y = x R 2 = Pae/PET At Y = -25% deviation ---- Pae/PETratio is 0.6. Relationship-Pae/PET & SPI Plot of Annual Percentage Departures of Rainfall from mean Vs Pae/PET SPI index y = Ln(x) R 2 = Pae/PET Where X is Pae/PET and Y is SPI at X=0.6, the value of SPI = However, in original SPI classification, SPI up to represents normal condition. Relationship-P ae /PET & EDI Plot of Annual EDI Values Vs Pae/PET Revised Index value w.r.t. IMD criteria EDI index y = x R 2 = Pae/PET At X =0.6, theedii.e.y=-0.75, close to the original classification value of EDI Where, X is Pae/PET, and Y is EDI X= Pae/PET a Y= % Rainfall deviation 0.60 to % to -37% 0.50 to % to -43% 0.40 to % to -59% Below % and below b Y= SPI index to to to and below c Y= EDI index to to to 1.65 Drought Type Mild Moderate Severe Below Extreme
21 X= Pae/PET Comparison of Drought Indices Revised Index value w.r.t. IMD criteria a Y= % Rainfall deviation b Y= SPI index c Y= EDI index Drought Type 0.60 to % to -37% to to 1.11 Mild 0.50 to % to -43% to to 1.47 Moderate 0.40 to % to -59% to to 1.65 Severe Below % and below and below Below Extreme Original Classification of SPI & EDI S.N. SPI-index value Classification of Drought EDI-index value Classification of Drought to 0.99 Near normal -0.7 to Mild drought to Moderate -1 to Moderate to Severe -1.5 to Severe or less Extreme -2 or less Extreme
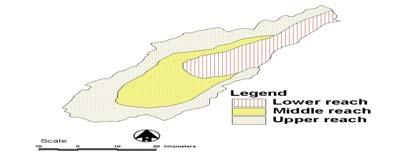
22 ASSESSING VULNERABILITY TO DROUGHT 1. Static factor of vulnerability (Physiographic factors: w.r.t. space ) Topographic factors (General Slope and drainage etc.) Soil (Soil water holding capacity) climatic components (Precipitation & ET), 2. Semi-static factors of vulnerability (w.r.t. space and long-term temporal variability) Irrigation support Status of surface water storage availability Status Ground water availability Population density (Population concentration, industrial/ commercial activities) Land use Regional cropping system Region-specific activities (like cattle farming/wildlife preservation etc) 3. Variable factors of vulnerability (w.r.t. space and time) Rainfall (monthly/seasonal/annual) Stream flow Storages (if any) --- Classification and spatial representation of drought vulnerability using geographic processing techniques --- Evaluation of weight of the factors that contribute to drought risk / vulnerability.
23 Assessing vulnerability to Drought (Weighing Scheme) Vulnerability factor Vulnerability Drought Vulnerability class s score (weight) Reach location Probabilities of seasonal crop moisture deficiency(%) Soil root zone water holding capacity (mm) Land use types Irrigation Support (canal) Population concentration Status of Groundwater Status of surface water storages in tanks, lakes etc.w.r.t. domestic/cattle and other drinking water demand Lower Middle Upper Less than 30 (low) (Moderate) (high) More than 70 (very high) More than Less than 100 (low) Forestland Grassland Cropland/habitation Water bodies/swamp/wetland Complete irrigation Tank/Lift irrigation Unirrigated Less than average Near average More than average Safe Semi critical Critical Over exploitation Deficit Moderately deficit Surplus
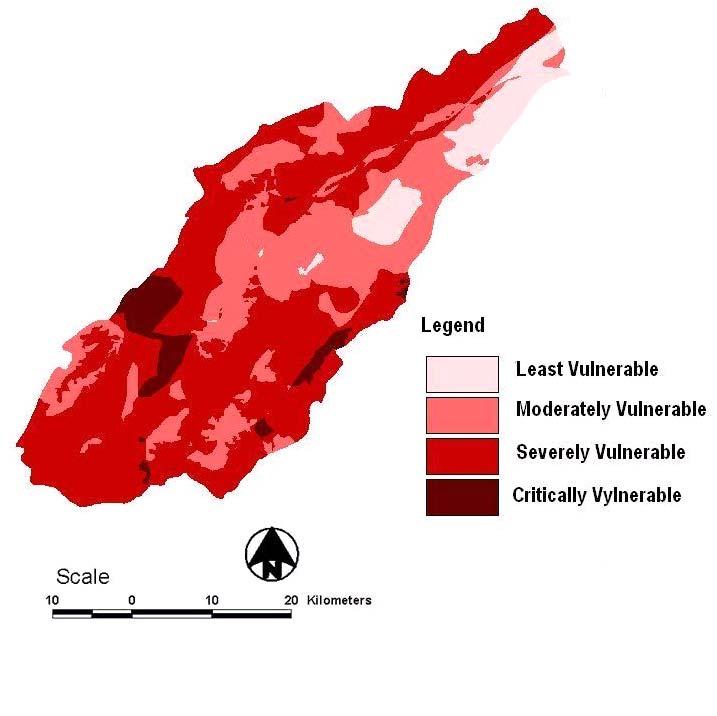
24 Integrated drought vulnerability Index (DVI) (Proposed) DVI = DVI = Drought Vulnerability Index N = Number of indicators under consideration w i = Weights of drought vulnerability indicators, (where, i= 1,2, N) k = Upper limit of vulnerability weights (Say, range = 0-k, where, k is highest value of W i ) kn Classification of DVI w i Sl. No Values of DVI Vulnerability Class Least vulnerable Mild vulnerable Moderately vulnerable severely vulnerable 5 >0.8 Critically vulnerable


25 Integration of physiographic factors Integration Grid Size m x 100m
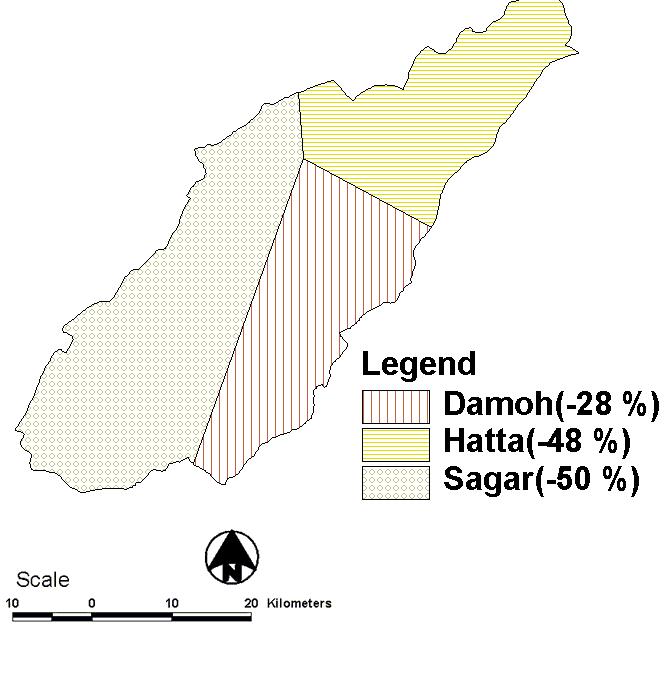
26 Integration with rainfall departure +
 51.590 1779.88 0 4516.")
27 Integrated vulnerability to drought (October-2007) Feb. 200 Vulnerability Class Least Moderate Severe Critical Area(k m2) % Area
28 Components of Integrated Drought Management System (Proposed) Nodal Unit (Decision Making) Scientific Community Stake Holders Water Managers (site units) Drought Partnership Data - historical - real time (monitoring) Tools -forecasting -predictions Drought Watch System Drought Management
29 Drought Partnerships Purpose: to improve the coordination of drought related activities in India. Partnership would act as a platform to initiate and discuss scientific inputs with multidisciplinary experts and it would insure exchange of information. Develop regional real time monitoring system to identify progression and critical areas vulnerable to drought. based on precipitation, river flows and groundwater data Identify gaps in knowledge and coordinate research activities. Develop analytical tools for estimating drought severity, extent and frequency. Support harmonization of methods for drought analysis. Share experiences in drought planning and management. Establish best practice guidelines for drought monitoring, forecasting, prediction and mitigation to support operational drought management. Improve mobility of operational and research staff. Develop links with international programmes and national drought activities inside & outside India. To carry out specific research projects, e.g. estimation event frequency from non-stationary data, impact or climate change on drought and medium-range drought forecasting. Develop and implement training activities. Communicate with stakeholders and the public
30 Summary of Project activities Field investigations, historical data/ information collection, processing and analysis etc. of hydro-meteorological data. Analysis of occurrence of dry spells, seasonal, and annual rainfall departure Application of Departure analysis, SPI, EDI and Decile Index for monthly, seasonal and annual time scale. Establishing of revised Index values for SPI and EDI in reference to our field conditions. Interim report- prepared & submitted Remote Sensing and GIS data processing, analysis and NDVI estimation. Formulation of vulnerability assessment criteria using combinations of static (physical) and variable factor. Proposed an index for integrated assessment of vulnerability to drought Formulating guidelines to facilitate development of drought early warning systems, preparedness plans for vulnerability reduction and Mitigation
31 OUTCOME OF THE STUDY Study evolved a methodology for integrated assessment of vulnerability to drought. Proposed revised index values for application of SPI and EDI in different study areas/regions. Proposed functional guidelines for the possible monitoring and management of drought situation. It is hoped that this study may contribute as an important input of early warning and preparedness to the National Action Plan for drought mitigation
32 Thank You