Chapter 3: Employee Involvement
|
|
|
- Gerard Hudson
- 5 years ago
- Views:
Transcription
1 Chapter 3: Employee Involvement Maslow s Hierarchy of needs: Motivation Self actualization Esteem Social Security Survival
2 Herzberg s two factor theory Motivators- recognition, responsibility, achievement, advancement etc. (equivalent to Maslow s upper level) Dissatisfiers/hygiene factor-salary, fringe benefits, working condition, organisational policy and technical supervision
3 Employee wants and manager s perception of employee wants: Factors Employee rating Manager rating Interesting work 1 5 Appreciation 2 8 Involvement 3 10 Job security 4 2 Good pay 5 1 Promotion/growth 6 3 Good working condition 7 4 Loyalty to employees 8 7 Help with personal problems 9 9 Tactful discipline
4 Achievement of motivated workforce 1. Know the self 2. Know your employees 3. Establish a positive attitude 4. Share the goals 5. Monitor progress 6. Communicate effectively 7. Celebrate the success 8. Develop interesting work Job rotation (Fig. a) Job enlargement (Fig. b) Job enrichment (Fig. b)


5 Job rotation, Job enlargement, Job enrichment Fig. a. Job rotation Fig. b. Job enlargement and job enrichment Fig. c. Job rotation, Job enlargement and job enrichment
6 Merits of job rotation, job enragement and job enrichment Benefits of job rotation Helps managers to explore the hidden talent Helps individuals to explore their interest Identifies knowledge, skills and attitudes Motivate employees to deal with new challenges Benefits of job enlargement Interesting and challenging job Improves in decision making Identifies future managerial calibre Identifies higher order needs of employees Reduces workload of superiors Benefits of job enrichment Gives the worker autonomy, responsibility and control The worker get achievement, recognition and self actualisation The worker get the sense of belongingness and importance in the organisation The workers find the job more meaningful Motivates the worker to give best performance
7 Team Importance of team: Many heads are more knowledgeable than one The whole is greater than the sum of its members The team members develop a good relationship with each other
8 Types of team Process improvement team: members 6-10, limited the work unit, life cycle is temporary. Cross functional team: members 6-10, represent a no. of different functional areas such as engineering, accounting, production, quality etc. This team is also temporary. Natural work team: it is not voluntary. Manager is part of the team. Self directed or self managed team
9 Characteristics of a successful team 1. Sponsor 2. Team charter 3. Team composition 4. Training 5. Ground rules 6. Clear objective 7. Accountability 8. Well-defined decision procedure 9. Resources 10. Trust 11. Effective problem solving 12. Open communications 13. Appropriate leadership 14. Balanced participation 15. Cohesiveness
10 Types of decision making 1. Nondecision 2. Unilateral decision 3. Handclap decision 4. Minority rule decision 5. Major rule decision 6. Consensus
11 Methods to involve employees Suggestion system 1. Be progressive 2. Remove fear 3. Simplify the process 4. Respond quickly 5. Reward the idea Recognition and reward Gainsharing: it is a financial reward and recognition that result from organisational improved performance. Performance appraisal
12 Benefits from employee involvement Improves the quality and increases productivity Makes better decision using their expert knowledge of the process Employees are able to spot and pinpoint areas for improvement Employees are better able to take immediate correction for improvement Reduces labour/management hassle by more effective communication and co-operation Employees are better able to accept change because they control the work environment Employees have an increased commitment to unit goals because they are involved
13 Chapter 4: Continuous Process Improvement We continuously improve by 1. Viewing all works as process whether it is associated with production or business 2. Making all the process effective, efficient and adoptable 3. Anticipating changing customer needs 4. Maintaining constructive dissatisfaction with the present level of performance 5. Eliminate waste and rework 6. Investigating the activities that donot add value to the product or service with the aim of eliminating these 7. Using benchmarking to improve competitive advantage 8. Innovating to achieve breakthroughs 9. Using technical tools-spc, experimental design, QFD, benchmarking
14 Process Feedback i/p Material Money Information Data etc Process People Equipment Methods Procedures Environment material O/P Information Data Product Service etc Outcome Fig. input output process model
15 Improvement of process Reduce resources Reduce errors Meet or exceed the expectation of the customers Make the process safer Make the process more satisfactory-ergonomic design
16 Juran triology 1. Planning a) Determine the customer b) Discover the need of the customer-stated need and real need c) Planning to develop the product or service having the required features d) Develop the process which is able to produce the required or service e) Translate the process into operation 2. Control a) Evaluate actual operating performance b) Compare actual performance to goals c) Act on difference 3. Improvement a) Repair b) Refinement c) Renovation d) Reinvention
17 PDSA cycle It is a problem solving method. Developed by Shewhart and modified by Deming. Act on the difference by identifying what worked as planned what didn t Act Plan Plan carefully what to be done Study Do Carryout the plan
18 Phases of PDSA cycle Ph-1 Identify the opportunity Ph-7 Ph-2 Plan for future Analyze the process Ph-6 Standardise the solution Act Plan Ph-3 Develop the optimal solution Study Do Ph-5 Ph-4 Study the results Implement
19 KAIZEN 5 S Philosophy SEIRI (segregation/simplify): simplify what is useful and what is not SEITON (orderliness): SEISO (cleanliness) SEIKETSU (standardisation):continuous improvement requires evaluation and comparison with a set of target and to make the process standardised. SHITSUKE (sustain): continuous process improvement should repeat to sustain to achieve a higher level of future development
20 Quality circle Prof. Kaoru Ishikawa is the father of quality circle. It is voluntary group of people, who meet together on regular basis to identify, analyse and solve quality, productivity, cost reduction, safety and other problem in their work area leading to improvement in their performance and enrichment of the work life. Members: 5-10 Problem areas: productivity, quality, cost reduction, safety etc Composition: member, leader, facilitator and coordinator Periodicity: once in a week, however it may vary depending upon the situation Steps involved in QC: 1. Problem identification 2. Problem selection 3. Problem analysis 4. Recommendation and implementation
21 Techniques applied by QC Brainstorming Data analysis Pareto analysis Cause and effect diagram
22 Cause and effect diagram People Stack holders Latest/conventional technology Trained/untrained Regular/temporary New/old Motivated/demotivated Digital/analog Highly precise/less precise Material Composition Properties i.e., k, µ, α, c etc. Light Temperature Morphology/microstructure Humidity, wind, space etc. Quality of product /service Equipment/methods Environment
23 Frequency of occurrence % of frequency of occurrence Pareto analysis (Italian economist, Vilfredo Federico Damaso Pareto) Vital few Trivial many Causes/ type of failure
24 Just in Time (JIT) A philosophy rather than a technique. Its main aim is to eliminate all types of wastes and to create a manufacturing system which is responsive to changing customer/market needs. JIT provides the necessary parts at right quantity and right parts at right time and place by using minimum facilities. Products are assembled just before they are sold, subassemblies are made just before they are assembled and components are fabricated just before they are subassembled
25 JIT contd. When you buy bananas all you want is the fruit not the skin, but you have to pay for the skin also. It is a waste. And you the customer should not have to pay for the waste. - Shigeo Shingo 7 wastes (Shigeo Shingo, Japanese industrial engineer, Toyota Production System, TPS) Waste of overproduction Waste of waiting Waste of transportation Waste of processing itself Waste of stock Waste of motion Waste of making defective products

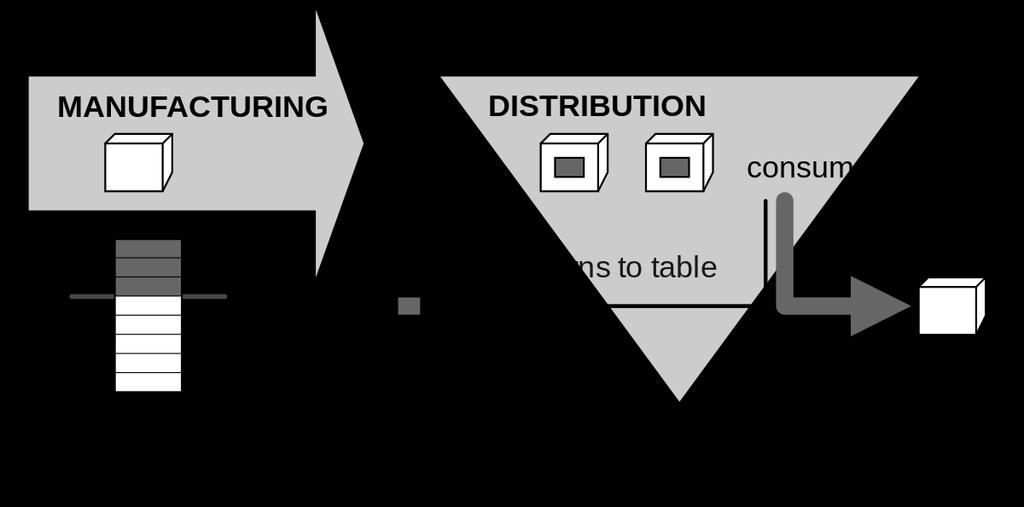
26 Pull and push system
27 Benefits of JIT 1. Product cost: Due to reduction in manufacturing cycle time, waste and inventories. 2. Quality: Because of continuous quality improvement programme. 3. Design: Due to flexible system, alternative design can be brought quickly into the shop floor by fast respond to changing market. 4. Administrative ease and simplicity
28 Kanban Visual card or signal
29 KANBAN
30 6 generally accepted rules for KANBAN 1. Downstream may only withdraw items in the precise amount specified on the Kanban. 2. Upstream process may only send downstream in the precise amount and sequences specified by the Kanban. 3. No items are made or moved without a Kanban. 4. A kanban must accompany each item at all the time. 5. Defects and incorrect amounts are never sent to the next downstream process. 6. The number Kanban should be monitored carefully to reveal problems and opportunities for improvement

31 Chapter 5: Supplier Partnership 3 key elements: 1. Long term commitment 2. Trust 3. Shared vision
32 Type of sourcing Sole source: patent, specification, raw material, location etc. Multiple sourcing: 2 or more suppliers. Competition results in better quality, low price and better service. Single sourcing: planned decision to select one supplier where suppliers are available. Results in long term commitment, patterning relation, trust etc
33 Supplier selection Make or buy decision Conditions : 1. The supplier understands and appreciate the management philosophy of the organisation. 2. The supplier has stable management system 3. The supplier maintains high technical specifications/standards. 4. The supplier can supply precisely those items which are required by the customer 5. The supplier has the capability to produce the amount of production needed. 6. There is no danger of supplier separating corporate secrets 7. The price is right and delivery date is maintained. They are easily accessible in terms of transportation and communication. 8. The supplier is sincere in implementing the contract provision 9. The supplier has an effective quality system-iso/qs 9000 etc. 10. The supplier has a tract record of customer satisfaction and organisational credibility
34 Chapter 6: Performance Measures Objectives: 1. Establish a baseline measures and reveal the trends 2. Determine which process needs to improve 3. Indicate process gain or losses 4. Compare goals with actual performance 5. Provide information for individual or team evaluation 6. Determine overall performance of the organisation
35 Typical measurements Human resources: lost time due to accident, absenteeism, employee satisfaction index, training hours per employee, training cost per employee, number of grievences. Customer : no of complaints, no of on time deliveries, customer satisfaction index, time to resolve complaints, report cards Production : SPC chart, amount of scrap/rework, machine downtime period, cost per unit, actual performance to goal. R & D : new product time to market, design change period, average time to process proposal. Suppliers : on time delivery, billing accuracy, JIT delivery target, supplier that are error free. Marketing and sales: sales expense to revenue, order accuracy, new customer, gain or loss account, no of successful customer per week. Administration : revenue per employee, expense to revenue, cost of poor quality, percent of payroll distributed on time
36 Basic characteristics that measure the performance of a product, process or service 1. Quantity 2. Cost 3. Time 4. Accuracy 5. Function 6. Service 7. Aesthetics
37 Presentation of performance measures 1. Time series graph 2. Control chart 3. Capability index 4. Taguchi s loss function 5. Cost of poor quality 6. Malcolm Baldrige National Quality Award

38 Frequency Quality characteristics 1. Time series graph 2. Control chart No of subgroups/samples
39 3. Capability index: ratio of tolerance to process capability, i.e., c p = = =<
40 4. Taguchi s loss function Step function/traditional view Target Continuous or quadratic function / Taguchi s view
41 5. Cost of poor quality: Cost associated with any product, process or system when they are deviated from its perfectness. Cost associated with poor quality. Quality cost bases: Labour : quality cost per hour of direct labour. Production: quality cost per dollar of production. Sales: quality cost per dollar of net sales. Unit: quality cost per unit, e.g., no. of boxes, kilogram of material, meter of cloth etc
42 Elements of quality cost 1. Preventive cost: cost incurred in taking precautions to prevent and recurrence the causes of failures in upcoming products or services. 2. Appraisal cost: cost associated with all types of inspection, tests, audits and evaluation of any product or service. 3. Failure cost a) Internal failure: cost associated in evaluating, disposal, replace or rework of any defective products found after production. b) External failure: cost incurred for the products or services not meeting the customer requirement after delivery to the customer. E.g., warranty claim, liability lost, penalties, lost sale etc
43 Optimum quality cost
44 Quality improvement strategy Every failure has some root causes and causes are preventable and prevention is cheaper and better than detection. Some strategies: Reduce failure cost by problem solving: concentrate on external failure cost as it gives more return on investment Invest right prevention activities: 1. Comprehensive review before release of a product 2. Involve the personal of appropriate functional areas at beginning (concurrent engineering) 3. Selection of supplier based on quality not on price. 4. Reliability testing 5. Proper training Reducing appraisal cost:
45 Reducing appraisal cost: 1. Is 100% inspection is required? 2. Can inspection be reduced, relocated or eliminated? 3. Is the inspection method most efficient? 4. Could inspection be made automated? 5. Should SPC be used? 6. Should operating personal be responsible for inspection? 7. Is appraisal is being used as the substitute of prevention?
46 MBNQA The award is given to the US organisations for their excellence in performance. The name of the award is given after the name of US secretary of commerce during Eligible organisations: 1. Manufacturing 2. Service 3. Health care 4. Small business 5. Education 6. Non profit
47 Baldrige criteria for performance excellence 1. Leadership: how the mgt. leads the organisation and organisation leads the community. 2. Strategic planning: how the organisation plans to implement in strategic direction. 3. Customer and market focus: how the organisation builds and maintains the strong and long lusting relations with customers. 4. Information and analysis: how the mgt. uses data to support key processes and organisational performance. 5. Human resources focus: how the organisation empowers and involves the work force. 6. Process management: how the organisation design, manage and improve the key processes. 7. Business/organisational performance results: How the organisation performs in terms of customer satisfaction, finance, operations, governance, social responsibility and how the organisations compares with its competitors