YOU WON T FALL. WITH RUN CHARTS
|
|
|
- Frank Simon
- 5 years ago
- Views:
Transcription

1 YOU WON T FALL. WITH RUN CHARTS KATRINA STROWBRIDGE, RN ST. LUKE COMMUNITY HOSPITAL Questions? How many of you currently use run charts? How many of you can create a run chart? How many of you currently use your run chart to tell your QI story? How many of you know if a run chart is the appropriate chart to use? 1
2 Objectives Why run charts Basics of run charts Easy tools for creating run charts Interpretation of run charts Our fall data story How we look at data now: Rate Patient falls by month by year Jan Feb Mar Apr May Jun Jul Aug Sep Oct Nov Dec 2010 Median Median Median pre PfP 10.7 post PfP Pt Falls per 1000 pt days pts, multiple falls All AP 1 major injury Total Falls by Year Total Falls by Year 1 pt, multiple falls AP NO INJURY Median Jan Feb Mar Apr Ma Jun Jul-10 Au Se Oct No De Jan Feb Mar Apr Ma Jun Jul-11 Au Se Oct No De Jan Feb Mar Apr Ma Jun Jul-12 Au Se Oct No De No falls Jan 2
3 Why run charts??????? Why run charts? Helps you track over time Clearly illustrates improvement (or not) Helps you determine if you met your goal/aim Gives you direction Helps you identify variation Helps you understand.. Variation 3


4 Aggregated data presented in tabular formats or with summary statistics will not help you measure the impact of process improvement efforts. Aggregated data can only lead to judgment, not improvement. (IHI) But..I am NOT a statitician, I am a QI Coordinator.. 4

5 Basics of run charts Data 15 or more points Draw the vertical and horizontal axis Label the axis Y is up and down and is number being measured or rate or percent X is time or sequence for data collected Plot data Draw lines to connect dots Calculate the mean or median and draw it in Title the chart Add a goal line Annotate the chart Time Data, frequency, etc What measured 5

6 In the beginning 50 0 Total Falls by Year Total Falls by Year Transitions How does this Get to that? Patient falls by month by year Jan Feb Mar Apr May Jun Jul Aug Sep Oct Nov Dec Rate 2010 Median Median Median Pt Falls per 1000 pt days 3 pts, multiple Jan-13 Dec-12 Nov-12 Oct-12 Sep-12 Aug-12 Jul-12 Jun-12 May-12 Apr-12 Mar-12 Feb-12 Jan-12 Dec-11 Nov-11 Oct-11 Sep-11 Aug-11 Jul-11 Jun-11 May-11 Apr-11 Mar-11 Feb-11 Jan-11 Dec-10 Nov-10 Oct-10 Sep-10 Aug-10 Jul-10 Jun-10 May-10 Apr-10 Mar-10 Feb-10 Jan-10 6

7 Templates! Excel Or Excel based Run chart template Days between template Institute for Healthcare Improvement aka IHI 7

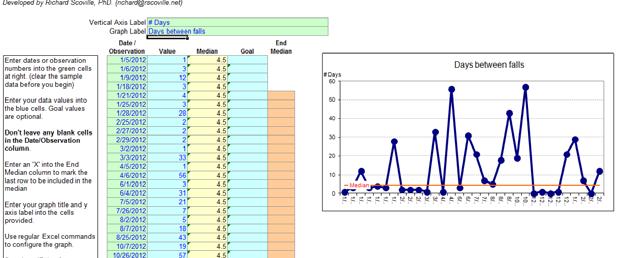
8 Run chart template 8

9 What if. Rate is low all of the time Events are rare Use the DAYS BETWEEN Why run charts? They help you focus on the 1 They give you credit for work that is done They help you see the run 9

10 Interpretation of run charts A phenomenon will be said to be controlled when, through the use of past experience, we can predict, at least within limits, how the phenomenon may be expected to vary in the future Dr. Walter Shewhart Economic Control of Quality of Manufactured Product 1931 Understanding variation Common Cause Inherent to the process (part of design) Is due to regular, natural, ordinary causes Affects all of the outcomes of the process Results in a stable process that is predictable Also known as random or unassigned variation Special Cause Due to irregular or unnatural causes that are not inherent in the process Affect some but not necessarily all aspects of the process Result in an unstable process that is not predictable Also known as non random or assignable variation 10

11 Pt Falls per 1000 pt days Rate Median Median Median pre PfP 10.7 post PfP pts, multiple falls All AP 1 major injury pt, multiple falls AP NO INJURY Median Jan-10 Feb-10 Mar-10 Apr-10 May-10 Jun-10 Jul-10 Aug-10 Sep-10 Oct-10 Nov-10 Dec-10 Jan-11 Feb-11 Mar-11 Apr-11 May-11 Jun-11 Jul-11 Aug-11 Sep-11 Oct-11 Nov-11 Dec-11 Jan-12 Feb-12 Mar-12 Apr-12 May-12 Jun-12 Jul-12 Aug-12 Sep-12 Oct-12 Nov-12 No falls Dec-12 Jan-13 But they don t get it. Then change your style! 11
12 Other ways to use run charts Confused upon arrival, current portacath, EKG, Ibuprophen, straight cath 3cc UO, ATB Levofloxacin? Given NS infusion 400 mls bag #2, levophed initiated, life flight Acetominophen given, foley IV access, 2nd bag NS Piperacillin started 4th liter NS hung, Pt state 10 sbp dbp MAP temp Pulse References & Sources: Institute for Healthcare Improvement found at Run chart template: Chart.aspx 12

13 Our hands may be different. But its our Hearts that make us the Heart of healthcare in the Mission Valley 13