Let me start with today s key takeaways. There are two major points I would like to highlight. The first is our Q1 results.
|
|
|
- Stephany Page
- 5 years ago
- Views:
Transcription

1
2 Let me start with today s key takeaways. There are two major points I would like to highlight. The first is our Q1 results. I am very pleased to report that our results for Q1, significant as the first reporting period in the first year under our new medium-term plan, were excellent. We posted significant YoY gains in both revenues and profits, hitting new record highs for the quarter. IAB, in particular, was very strong and was the driver for our overall performance. The positive start has heightened the confidence we have in our ability to achieve dramatic growth as set out in our medium-term strategies. The second is our efforts to sustainably create corporate value over time. In the latter part of the presentation, I will talk about my thoughts as CFO on ROIC management, capital efficiency and shareholder returns. Let s begin the presentation. Please turn to slide 4. 1
3 2
4 3


5 I will start with Q1 results. As you can see, sales rose more than 10% YoY and OP improved by more than 2.3-fold, up significantly from the previous year. At all levels of profit, both on the basis of absolute value and margins, we hit new record highs. For your information, the quarterly sales figure was the second highest on record. GPM, which is a key KPI for OMRON, rose to 41.3%, only further reinforcing our conviction that we continue to make progress in improving our ability to generate profits. As a consequence, OPM rose to 11.1%. 4


6 Next, let us look at the sales results in more detail. Here we show Q1 sales broken out by segment. Our mainstay business, IAB, reported substantial topline growth of more than 20%, and contributed meaningfully to overall sales growth. The significantly better-than-expected market conditions in China for the digital industry was a major factor, but we also attribute our success to our ability to fully capture this opportunity. In other words, we believe our focus on strategic industries is delivering results. 5


7 Turning to operating income broken out by segment. Please look at the column on the far right side of the table. As you can see, profits improved YoY for all of our business segments. IAB, in particular, reported very strong growth. The Q1 OPM for IAB exceeded 20%. 6

8 On this next chart, we show the YoY change in overall operating profit. I would like to spend a little time to discuss this in more detail. The waterfall chart shows the YoY change in overall Q1 operating profit, broken down into the key elements. The significant YoY growth is partly a function of the challenging conditions in Q1 FY2016. However, in terms of improving our ability to generate profits as represented by added value in the chart, you can see that we were able to make significant gains YoY. On fixed manufacturing costs, although we were growing sales, we benefited from the contribution of ongoing restructuring efforts which allowed us to reduce fixed manufacturing costs by 0.7 billion. SG&A increased only slightly, by 0.8 billion. We had indicated that we would be proactively investing from this fiscal year. Investments increased by 2 billion, in line with our plan, but this was offset by a decline of slightly more than 1 billion resulting from ongoing restructuring measures, for a net increase of 0.8 billion. Going forward, we are firmly committed to continuing our investments to accelerate future growth. As such, fixed costs and expenses will increase from Q2 onward. We are investing to create a structure that will allow us to fully capture growth opportunities, and will execute in line with our plans. 7

 through our own ongoing internal efforts to reform and improve the profit structures of our businesses and the broad adoption of ROIC management throughout the organization.")
9 At the outset, I noted that we hit record high profit margin levels in Q1. Using the next two slides, I will compare Q1 FY2017 results with Q1 FY2014, when we recorded our previous record highs, to highlight how our profit and business structures have changed. I will start with the evolution of our profit structure. Despite a headwind of a generally appreciating yen, we were able to improve our GPM 1.6 percentage points (pp) through our own ongoing internal efforts to reform and improve the profit structures of our businesses and the broad adoption of ROIC management throughout the organization. We believe that we have clearly improved our ability to generate profits. Improved operational efficiencies have allowed us to lower the SG&A ratio by 0.1 pp. However, we are not satisfied with the 10-basis point reduction and will continue to pursue further efficiencies. The improved GPM and strong discipline in controlling SG&A has allowed us to generate funds for investment. We have allocated funds toward investments to enhance our core technologies and product development. As a consequence, R&D spend as a percentage of sales has increased by 0.6 pp. We view these investments as necessary to build for our future. As a result of all this, although we are increasing R&D spend, our OPM has improved by 1.1 pp. As you can see, the record high Q1 results in FY2017 reflect the significant evolution and improvement to our profit structure versus our previous Q1 FY


10 Next, from the standpoint of measures to enhance our business portfolio, we had selectively focused on growth industries and have been taking a disciplined approach to portfolio management. As a result, IAB and HCB now represent a larger proportion of overall sales. As you can see here, IAB s share of total revenue increased by 7 pp to 47%. HCB s share of revenue rose by 2 pp. Also, please look at the Other segment, at the bottom of the column. Businesses included in the Other segment were the target of corporate restructuring and optimizing in FY2016. As a result, the proportion of revenue from the Other segment has declined by 7 pp. These changes over the last three years have clearly allowed us to convert our business portfolio into one where it is possible to improve profitability while continuing to grow. We are increasingly confident that we are on the right track with our initiatives, given the clear results we are getting from measures to improve profitability and enhance our business portfolio. In line with the policies incorporated in VG 2.0, the new medium-term management plan unveiled in April, we will concentrate investments on IAB and HCB, which have been driving revenue and profit growth, to further enhance our business portfolio. 9


11 I would now like to talk in more detail about the background to the strong growth enjoyed by IAB in Q1. It has been and should continue to be OMRON s key growth driver. There are several reasons for IAB s strength in Q1. The first is that we have been able to achieve high levels of growth for the four focus industries we have identified: Auto, Digital, Food & Beverage and Infrastructure. In FY2016, we talked about our success in capturing growth in the focus industries in China. We have expanded our Global Industry Strategy to regions beyond China and have been able to grow our business significantly as a result. Specifically, global revenues for these four industries grew 38% YoY. Greater China revenues for the focus industries increased 54% YoY, while the aggregate growth of Japan, Americas, Europe and Asia combined was a very healthy 33% YoY. Many of our peers in factory automation (FA) are also reporting similarly firm growth, so there was a contribution from a solid underlying market. Having said this, according to our internal analysis, we have been able to capture growth above and beyond underlying market growth. We believe this confirms that our strategies are correct. We have also been able to grow revenues for industries outside of the four focus industries. We attribute this to our success in increasing the number of customers, and believe this is a strong reflection of how highly the value we provide is rated by our customers. This was the first reason for the robust performance. 10


12 The second reason reflects the fact that our customers increasingly recognize the value of OMRON s solutions. We believe our comprehensive and broad-based product lineup makes it possible to create solutions that only OMRON can deliver. Our greatest strength is our ability to create solutions by combining the broadest product lineup within the industry and a diverse array of control application software. We provide a single, easy-to-control integrated controller that is the fastest in the industry, to deliver high-speed, high precision control for a vast array of devices. The key to making this possible is our control application software. We already have more than 100 control applications; this is the root source of the value we provide to our customers. Our solutions proposals leverage our control application software and devices, matching the needs of our customers in the fast growing focus industries. We believe our ability to fully capture such growth has contributed to our robust performance. Going forward, we will continue to create revolutionary new products and technologies to further elevate our ability to provide sophisticated solutions to our customers. 11


13 Separately, as covered in a recent press release, we completed the acquisition of Sentech on July 3, This acquisition further expands our product lineup, which will allow us to broaden the range of solutions we can provide to our customers. Sentech boasts more than 200 industrial camera models and has superior technological expertise in developing high-resolution, compact solutions for use in factory automation. Please look at the right-hand side of the slide. Although it may not look like it, this is a SCARA robot. What we envision is the use of Sentech s compact cameras in SCARA robots. Going forward, the smart cameras embedded in robots will need to have small form factors and have few restrictions on where they can be mounted. We believe this will enable increasingly complex assembly processes, the automation of inspection processes that currently rely on demanding visual inspections, and new revolutionary manufacturing technologies. We will continue to engage in M&A as a tool to further expand our product lineup and solutions capabilities. This will allow us to develop a business platform with clear growth potential. We hope you will hold high expectations for our progress on this front. 12

14 This covers our performance in Q1. I would now like to explain our view of the business environment from Q2 onward by region. Overall, although there is some uncertainty in certain industries and regions, the global economy should continue to recover and we see the operating environment as generally positive. 13


15 Next, I will touch upon our view of the environment from Q2 onward by business segment. Highlighting the potential negatives, we do see some uncertainty around smartphone-related investments, which was the key driver of growth in Q1. Given the high level of smartphone investment in Q1, we believe we could see a decline in Q2 from the high levels of Q1. In addition, for the auto industry, we see some potential risks, such as a possible peak-out in auto demand in North America. Autos in China may also be weaker on the back of the termination or reduction of tax breaks. When you look at individual industries or regions, there are pockets of uncertainty. That said, we view the overall operating environment for mainstay IAB and our other businesses as generally solid. With regard to our view of the operating environments for each of our businesses, please refer to the explanations we provide in the handouts at your leisure. 14


16 Based on what we have just discussed, I would like to sum up our outlook. First, we expect that FA investments will remain strong, and as such, we expect a solid operating environment from Q2 onward. Second, we have already seen solid results from our IAB strategies. This has increased our confidence in our strategies. Third, we have made significant progress in improving our profit structure. From Q2 onward, we are committed to accelerating our growth by building on what we have achieved to fully capture opportunities. We will increase investments from Q2 onward, to proactively expand capacity and headcount. I note, as mentioned earlier, the China market in Q1 was stronger than we had initially expected. As such, our Q1 results came in ahead of our expectations. In addition, Q1 FY2016 was very challenging: the resulting low base for comparison contributed to the high YoY improvements in Q1 FY2017. Given that we have only completed three months of the current fiscal year, we have chosen to leave the full-year forecasts we announced in April unchanged. That said, our view of the operating environment is as I stated earlier. We will review our forecasts thoroughly once we have seen the results of Q2. Subject to our view at that point, we may choose to revise our full-year forecasts at that time. This completes my remarks on our earnings. 15
17 I would now like to turn to a discussion of how I, as the new CFO, view creating corporate value on a sustainable basis. 16


18 I will start with a brief biography. In 1983, I joined OMRON, which was called Tateisi Electronics at the time, as an engineer. I was mainly involved in the ATM business as an engineer. The ATM business has since been transferred to a joint venture now run by Hitachi. I was responsible for product and technology development as well as business alliances. In 2002, I moved to the Global Strategy HQ. I am concurrently serving as the Senior General Manager of Global Strategy HQ but before becoming Senior General Manager, I spent several years at the Global Strategy HQ in a management role, focusing on M&A and a number of restructuring initiatives. During that period, I worked with Mr. Oue, who is with us today. Together we developed the application of concepts such as ROIC management and business portfolio management at OMRON, and were responsible for their initial adoption. I subsequently moved to HCB, becoming the General Manager of the Management Strategy HQ, and then was named the Senior General Manager of Global Resource Management HQ for OMRON. After that I returned to the Global Strategy HQ as the Senior General Manager, taking on the responsibility for developing and executing management strategies for OMRON as a whole. As a part of this role, I was responsible for the formulation of the new medium-term management plan VG 2.0, which we announced in April. From April 2017, my brief has expanded to include the role of CFO. My role here is to focus on managing for corporate value creation. 17


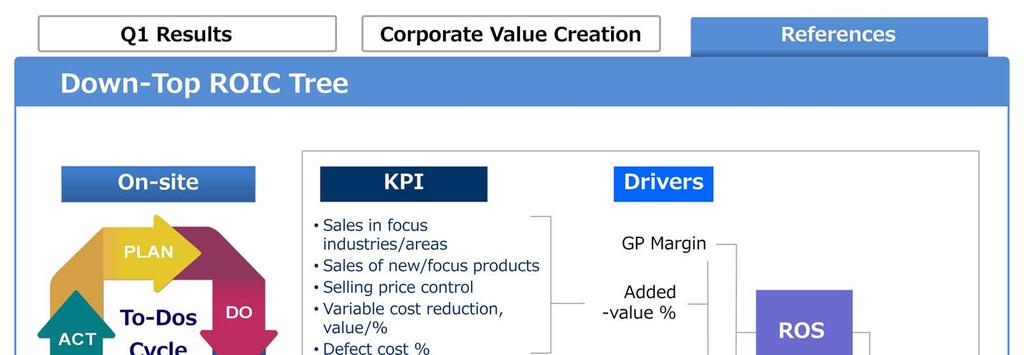
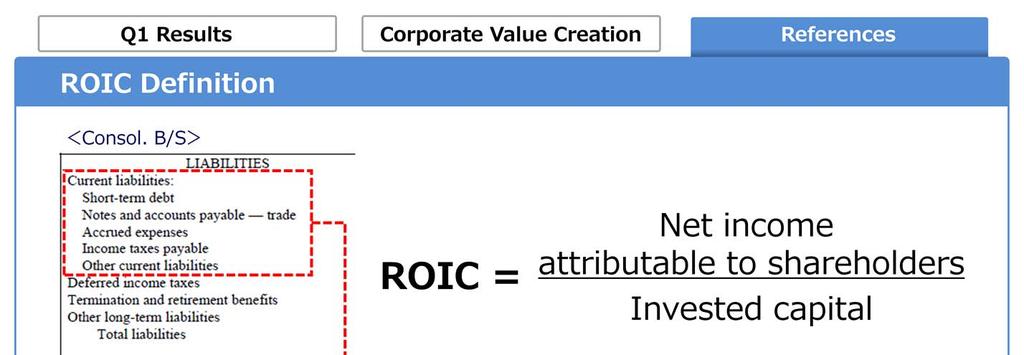
19 This slide encapsulates ROIC Management, a concept with which I believe you are already familiar. OMRON manages its businesses using ROIC management. The diagram depicts the structure of ROIC Management in simple terms. The most important message I would like to convey using this slide is the fact that I am ultimately responsible for the execution of ROIC Management and as CFO, I will focus even more on accelerating understanding and implementation throughout the organization. 18

20 I believe that we have shared this slide with you before at a previous results briefing, as presented by CEO Yamada. Two years ago, we unveiled ROIC Management 2.0, which is a translation formula for ROIC, as we show here. I, in my role as Senior General Manager of the Global Strategy HQ, along with my predecessor CFO Suzuki and Mr. Oue, was very deeply involved in the development and adoption of this translation formula. I believe my most important mission as CFO will be to proactively increase the management resources (variable N) necessary to create corporate value while also increasing the value we provide to our customers (variable V), although we must monitor the balance between actively allocating management resources and profitability. Furthermore, management resources being wasted or lost (variable L) that decrease the value we provide for our customers (V) must be reduced in order to maximize variable N. We will seek to ensure that the virtuous circle functions properly. As CFO, I will be keenly focused on assessing and quantifying how successful we are at linking increases in necessary investments (N) to increases in value to customers (V). VG 2.0 is a growth strategy. We will prioritize investments for future growth. That said, we will still expect a minimum of 10% in ROIC and ROE from these growth investments. Ideally, we will achieve a level between 10% - 15% during the current medium-term management plan period. Disciplined implementation of ROIC Management 2.0 will clarify the priorities for investment. As CFO, I will focus on continuing to manage our businesses with a focus on capital efficiency. 19


21 As a part of my focus on capital efficiency, I am announcing a share buyback program for a maximum amount of 20 billion. This was approved by the board today. We have set the ceiling in terms of number of shares at 5 million. The program will be terminated when we hit one of the two ceilings. The program will run for a year; we will be buying back shares over the course of this 12-month period. We will be flexible in buying back shares, taking a comprehensive view which factors in the level of cash on hand and the then-current share price. 20
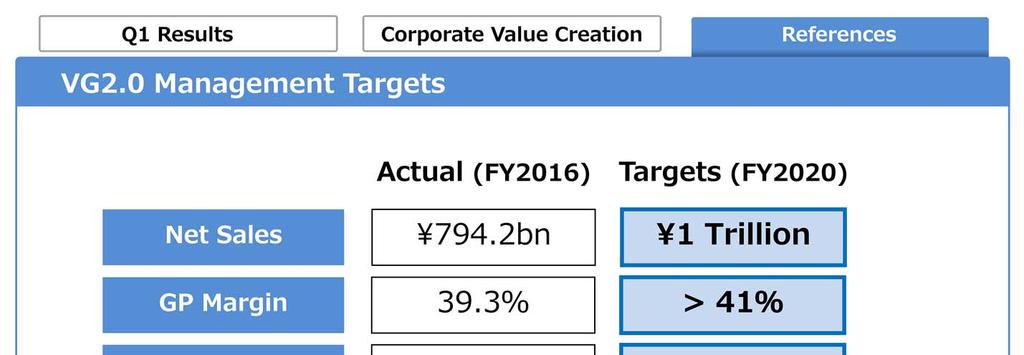
22 Finally, as I touched upon earlier, we have gotten off to an extremely good start for VG 2.0 and FY2017, the first year of the medium-term plan. Q1 revenues and profits were up significantly YoY. We believe the strategies we have deployed in our mainstay IAB business and improvements to our overall profit structure are bearing fruit. The Q1 results give us solid confidence in our ability to achieve the VG 2.0 targets for FY2020. However, I will reiterate that we have as yet only completed 3 months of FY2017 and we still have 9 more months to go. As such, we have chosen to leave our full-year forecasts unchanged at this time. We will review the situation as of the end of Q2, and if necessary, will adjust our forecasts at that time. As CFO, I am firmly committed to ROIC management in order to maximize the value we generate for our customers. At the same time, I will also focus on capital efficiency and enhancing shareholder returns as well as sustainably creating corporate value. I humbly ask for your continued support as shareholders and investors. This completes my presentation. Thank you. 21
23 22

24 23

25 24

26 25
27 26
28 27