London Branch Meeting Thursday 11 January 2018
|
|
|
- Lily Newton
- 5 years ago
- Views:
Transcription
1 London Branch Meeting Thursday 11 January 2018
2 Agenda: 15:00 - Doors open 15:15 - Welcome and introduction 15:30 - Presentation: An Integrated Approach to Performance Measurement by John Nelson 16:00 - Questions and closing comments 16:15 IIRSM Update: IIRSM CEO Phillip Pearson 16:30 - Networking 16:45 - Close
3 Welcome & introduction IIRSM CEO: Phillip Pearson
4 An integrated approach to performance measurement John Nelson


5


6 Findings

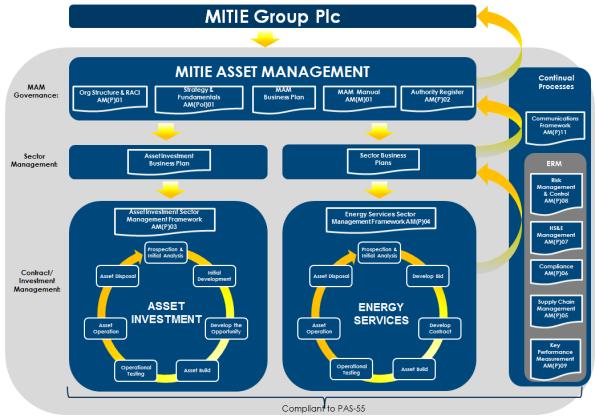
7 MITIE Asset Management Context


8 Framework Learning To deliver continual and sustainable improvements in all that we do Governance Providing the assurance to achieve our strategic objectives and achievement of agreed and acceptable outcome or results Risk Management Anticipate, respond, recover and learn to reduce the missed opportunities and minimise risks.


9 Project Lifecycle Prospect Sales Validation Delivery Testing & Commissioning Operation & Maintenance Handback

 formal measure of achievement;")

10 Performance Measurement KEY PERFORMANCE MEASURES KEY OBJECTIVES the influencer ; accelerates or decelerates progress (achievement) formal measure of achievement; allows MAM to track progress against recognised standard LEADING & LAGGING INDICATORS hard data which may be analysed


11 Established Excellence Models Safety Culture Maturity Model Risk Management Maturity Model BS EN ISO 9004; Managing for the sustained success success of an organization Asset Management Excellence Model EFQM Excellence Model


12 Partnership AMCL Asset Management Excellence Model: Maturity Scale (AMEM)

 the organisation will be")
13 Partnership This diagram shows the Asset Management Maturity Scale. In order to achieve the Excellence Model an organisation needs to be scoring above 70%. The organisation is scoring just below 35%. By addressing all the PAS 55 Major & Minor non-conformances (see next slide) the organisation will be moving closer to the Excellence model. These actions were completed through the implementation of Project TOM.

14 Moving towards excellence This diagram shows the score against each of the PAS 55 requirements (24) In order to achieve the excellence model we needed to hit 70% on all subjects. In order to see if we were moving towards the Excellence Model we looked at all Major & Minor non conformances. The diagram also shows the PAS 55 clauses that were being addressed via the implementation of Project TOM, therefore moving beyond both PAS 55 and closer to Excellence. The 24 subjects in this model largely represent the 39 subjects in the AMEM.

15 Quality Management Approach

16 Key Performance Measures Mutually Beneficial Supplier Relationship Factual Approach to Decision Making Customer Focus Leadership Involvement Of People Continual Improvement Process Approach System Approach to Management
17 Performance Measurement KEY OBJECTIVES the influencer ; accelerates or decelerates progress (achievement) KEY PERFORMANCE MEASURES formal measure of achievement; allows MAM to track progress against recognised standard Stewardship & Governance People Risk Committee/ AMSG established Clear accountabilities and job description for all AMEM Leadership Culture Asset Management Excellence Model Visible engagement with staff Measurement and analysis of feedback from employee surveys Risk Management Performance Improvement CHaSPI Corporate Health & Safety Performance Index ISO Quality Management Guidelines for Realizing Financial & Economic Benefits Business opportunities that meet risk appetite Benchmark against peer group LEADING & LAGGING (PERFORMANCE) INDICATORS hard data which may be analysed Increase in near miss reporting Accidents & Incidents Accident frequency rates Improvement captured thru audits Continual Improvement Number NC s not closed out Communication of business performance Employee Involvement Poor comms. lead to unwanted results Measure use of natural resources Natural Resources Volume water used per sqm Number of persons using EAP Absence Management Percentage of work related absences Contractors approved as per procedure Supply Chain Management Failure to meet agreed KPI Assets performing to requirements Asset Management Asset failure rates No. assets meeting design specification Design Management No. assets failing to meet specification All legal contract req ments identified Legal, Contractual & Other Enforcement action taken Statutory health assessments Occupational Health & Wellbeing Reportable cases of ill health Energy Management Number of energy interventions Energy usage & CO2 emission Procedures meet business requirements Systems & Process Incorrect procedure implemented Authorisations tally with competence Competence Number incidents; lack of training No. people trained for emergencies Emergency Preparedness & Incident Management Contingency plans ineffective on use Statutory inspections carried out Monitoring, Audit & Review Number of non-conformities Number of permits closed Permit To Work Failure to control PTW activities Frequency of periodic tests of BCP Business Continuity Number of BCP s not fit for purpose KEY: Example leading indicator Example lagging indicator
18 Appendix


19 Target Operating Model 1 STRATEGY & RISK MANAGEMENT 2 3 ORGANISATION & CAPABILITY GOVERNANCE & POLICIES SYSTEMS & PROCESSES PERFORMANCE MANAGEMENT TOOLS & TECHNOLOGY
20 Business Process Re-engineering
21 21
22 Decision Making
23 Rules To ensure that the appropriate performance measures were applied the following rules were observed: 1. Objective, easy to measure and collect; 2. Relevant to the organisation and groups whose performance is being measured; 3. Providing immediate and reliable indications of the level of performance; 4. Cost efficient in terms of the equipment, personnel and additional technology required to gather the information; 5. Understood and owned by those whose performance is being measured.
24 Thank you. Any further questions?... John Nelson Mobile:
25 Questions and closing comments
26 IIRSM Update: IIRSM CEO Phillip Pearson

27 Networking