Partial Least Squares Structural Equation Modeling PLS-SEM
|
|
|
- Ariel Watkins
- 5 years ago
- Views:
Transcription


1 Partial Least Squares Structural Equation Modeling PLS-SEM New Edition Joe Hair Cleverdon Chair of Business Director, DBA Program Statistical Analysis Historical Perspectives Early 1900 s 1970 s = Basic Statistics: First Generation (correlation / regression / factor analysis / variates) almost entirely with slide rules and calculators s Initial applications of SEM in business s Widespread adoption of PCs; Point & Click user interface; Explosion in data begins s Continued improvements in measurement and software. Expanded applications of SEM, particularly PLS-SEM. Data analytics Big Data.
2 Today = Demystification For Better or Worse... Users: No longer need to be a trained statistician or know how to write a computer program. But must know how to design a study, choose the correct multivariate method, apply assumptions and rules of thumb, and identify and deal with red flags in the results. First journal article using SEM SEM Model: Predicting the Birth Weight of Guinea Pigs X & Y = different outcomes B, C & D = common causes A & E = independent causes Sewall Wright, Correlation and Causation, Journal of Agricultural Research, Vol. XX, No. 7, 1921.
3 Classification of Multivariate Methods First Generation Methods Second Generation Methods Primarily Exploratory Cluster analysis Exploratory Factor Analysis (EFA) Multidimensional Scaling PLS-SEM No Software Primarily Confirmatory Analysis of Variance (ANOVA) MANOVA Multiple Regression Logistic Regression Discriminant Analysis Covariance-based SEM (CB-SEM).. LISREL 1 st AMOS 2 nd (early 1980 s) (early 1990 s) Classification of Multivariate Methods First Generation Methods Second Generation Methods Primarily Exploratory Cluster analysis Exploratory Factor Analysis (EFA) Multidimensional Scaling PLS-SEM Exploratory & Confirmatory Primarily Confirmatory Analysis of Variance (ANOVA) MANOVA Multiple Regression Logistic Regression Discriminant Analysis CB-SEM Confirmatory only (established theory)..


4 CB-SEM dominant 2 nd generation approach, but PLS-SEM applications are increasing rapidly... Data from marketing and strategic management journals, and the MIS Quarterly. Why SEM? Scholars historically assumed minimal error Multi-item Scales = improved measurement EFA = exploratory Need for confirmation of theory CFA = confirmatory (reliability & particularly validity) GoF (Chi square statistic) CB-SEM has limitations...
5 Why PLS SEM? Convergence = always get a solution with PLS-SEM! No identification No Heywood Cases No Chi-square GoF Maximizes prediction (including assessment of error) In-sample prediction Out-of-sample prediction (hold out samples) Small samples with caution Large samples and complex models are always OK Non-parametric = distribution free Can confirm Theory (measurement & structural) EFA initially but... exploratory Confirmatory Composite Analysis (CCA) Measurement R 2, f 2, Q 2 and PLSpredict = confirmation Higher-order constructs (2 versus 3) Continuous moderators Latent variable scores are determinant... Theoretical Reputation Model With Indicators
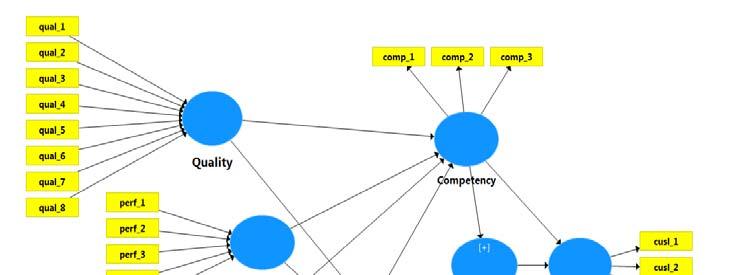
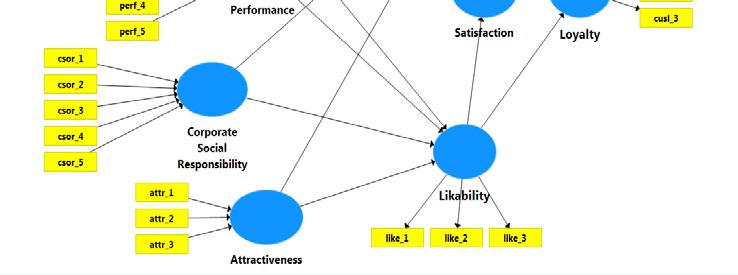


6 Formative Constructs OK Extended Theoretical Model Indicators for SEM Model Constructs
7 Beta Coefficient R 2 Multiple Regression Simple Reputation Model Beta Coefficient R 2 Reputation Model Regression Results
 = assess the reliability and validity of the model s constructs. CB-SEM = must achieve fit to move to 2 nd step.")
 = determines whether hypothesized theoretical relationships exist between the constructs.")
8 Beta Coefficient R 2 Loadings Reputation Model PLS-SEM Results Structural Equation Modeling (SEM) Two Step Procedure: 1. Confirm theoretical measurement model (CFA & CCA) = assess the reliability and validity of the model s constructs. CB-SEM = must achieve fit to move to 2 nd step. PLS-SEM = confirms measurement theory (no fit; uses other metrics). 2. Evaluate structural model (SEM) = determines whether hypothesized theoretical relationships exist between the constructs. PLS prediction In developing models researchers draw upon theory, prior experience, expert judgment, and research objectives to identify and develop hypotheses about relationships between multiple independent and dependent variables.
9 PLS-SEM Sample Size 10 Times Rule The overall complexity of a structural model has little influence on the sample size requirements for PLS-SEM. The reason is the algorithm does not compute all relationships in the structural model at the same time. Instead, it uses OLS regressions to estimate the model s partial regression relationships. The 10 times rule indicates the sample size should be equal to the larger of: (1) 10 times the largest number of formative indicators used to measure a single construct, or (2) 10 times the largest number of structural paths directed at a particular latent construct in the structural model. This rule of thumb is equivalent to saying that the minimum sample size should be 10 times the maximum number of arrowheads pointing at a latent variable anywhere in the path model. The 10 times rule offers a rough guideline for minimum sample size requirements. But PLS-SEM, like any statistical technique, requires researchers to consider the sample size against the context of the model and data characteristics and the required sample size should be determined using power analyses based on the part of the model with the largest number of predictors.
, Sage, 2 nd Edition, 2017, p. 26.")
10 . Source: Hair, Hult, Ringle & Sarstedt, A Primer in Partial Least Squares Structural Equation Modeling (PLS-SEM), Sage, 2 nd Edition, 2017, p. 26. = size & sig.?


11 Some Critics of PLS-SEM... But! An important technique in the researchers toolbox. The center of a lively scholarly debate. Some scholars claim Never use PLS. PLS methodologists quick to demonstrate claims as unsubstantiated or grossly exaggerated. More recent scholars saying Feel the love... Haters gonna be haters! Remember, CB-SEM has limitations too...
12 PLS Model Evaluation Concepts and Metrics General Construct Loadings Size & Significance Path Coefficients Size & Significance Measurement Model Reflective Loadings & Squared Loadings =/>.708 & =/>.50 Item Reliability = Squared Loadings Communalities =>.50 Construct Reliability =/>.70 Convergent Validity AVE =/>.50 Discriminant Validity HTMT Criterion Measurement Model Formative Convergent Validity Redundancy Analysis Multicollinearity of Indicators Outer Measurement Model (VIF) Indicator Weights Indicator Loadings (when necessary) Definitely =/> 5 Possibly =/> 3 Size & Significance Size & Significance PLS Model Evaluation Concepts and Metrics Structural Model Multicollinearity Predictor Constructs (VIF) Path Coefficients R 2 = Explained Variance f 2 Effect Size In-sample prediction Q 2 Predictive Relevance/Blindfolding In-sample validity PLS Predict Definitely =/> 5 Possibly =/> 3 Size & Significance Depends on Context Values of 0.02, 0.15, and 0.35 represent small, medium, and large effects Values larger than zero are meaningful. Out-of-Sample Predictive Validity


13 Statistical analysis and hypothesis testing are useful, but we must never let them be a substitute for thinking!