Last update to this document:
|
|
|
- Doreen Bruce
- 5 years ago
- Views:
Transcription


1 Last update to this document:


2
3


.")


4 CSRI SCALES SUPPORTIVE STAFF RELATIONSHIP EFFORTS SELF-CARE HEALTH MAINTENANCE EFFORTS CONFIDENT/PERSEVERANT FRAME OF MIND CONTROLLED/LOGICAL PROBLEM SOLVING GROUP SCORE SCALE SCORE INTERPRETATION SUBSTANTIAL IMPROVEMENT NEEDED. An average/group CSRI scale score of 1.8 is a LOW SCORE by clinically-derived criteria. SLIGHT IMPROVEMENT NEEDED. An average/group CSRI scale score of 2.2 is a SLIGHTLY LOW SCORE by clinicallyderived criteria. FAIRLY GOOD SITUATION. An average/group CSRI scale score of 2.6 is a SLIGHTLY ELEVATED SCORE by clinicallyderived criteria. VERY GOOD SITUATION. An average/group CSRI scale score of 3.2 is an ELEVATED SCORE by clinically-derived criteria. This score is also significantly higher than the national average scale score for corrections professionals. RESULTS NARRATIVE CSRI scale scores were calculated for your facility based upon a total of 552 fullycompleted CSRI assessments. Scale scores demonstrated varying results. In the areas of CONFIDENT/ PERSEVERENT FRAME OF MIND and CONTROLLED/LOGICAL PROBLEM SOLVING, your staffs average scores indicate that Resilience-Promoting Behaviors (RPBs) are taking place at a good rate. The average score for the CONTROLLED/LOGICAL PROBLEM SOLVING scale was also significantly higher/better than the national average (p<.05). In the area of SUPPORTIVE STAFF RELATIONSHIP EFFORTS, substantial space for improvement in the RPB rate was found. In the area of SELF-CARE HEALTH MAINTENANCE EFFORTS, slight space for improvement was found. RECOMMENDATIONS In order to increase the classes of behaviors associated with the SUPPORTIVE STAFF RELATIONSHIP EFFORTS and SELF-CARE HEALTH MAINTENANCE EFFORTS scales, targeted programming focused on these content areas is recommended. In order to maintain optimal health and functioning of the workforce, additional health maintenance recommendations include: Training on the nature of Corrections Fatigue, Supervisor Support programming, and periodic quantitative assessment of both Corrections Fatigue levels and RPB levels for the purpose of monitoring and informing the direction of improvement efforts or other intervention types as needed.


5 α α

, after converting scale data from raw to z-scores.")
6 Comorbidity CSRI Overall Score Ranges Versus Presence of Negative Health Conditions CSRI Overall Score Ranges *Comorbidity was defined for analysis as an aggregate score from several health-related assessment scales (i.e., the CFSA Overall score, PCL-5 total score, DDS score, DASS-21 Depression score, DASS-21 Anxiety score, and DASS-21 Stress score), after converting scale data from raw to z-scores. In the line chart above, the mean Comorbidity score is plotted against CSRI overall score ranges that included an approximately equal number of cases between them.


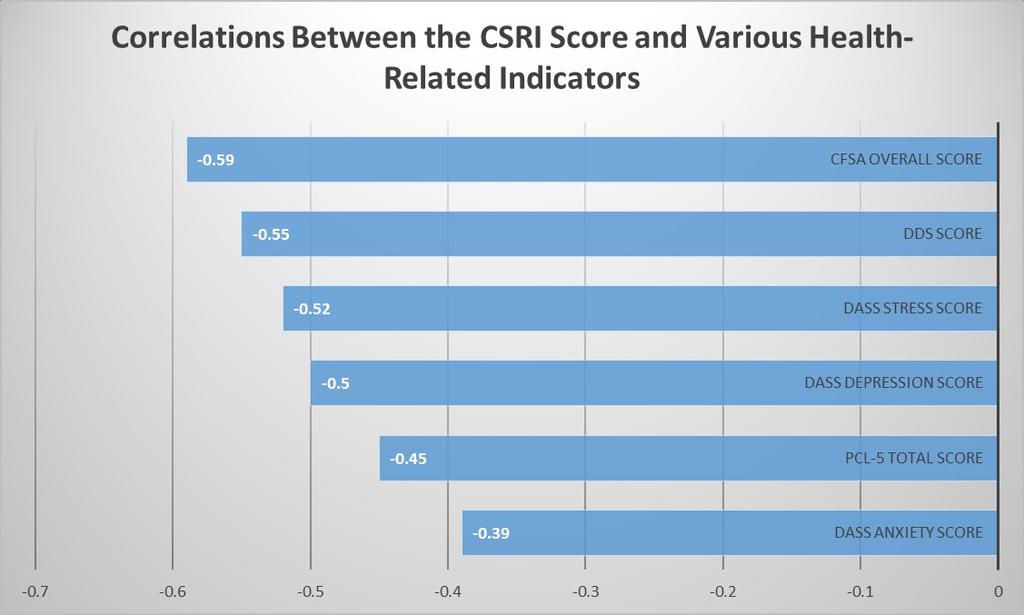
7 Correlations Between the CSRI Overall Score and Various Established Health-Related Measures *All (Pearson) correlations are statistically significant using the p<.01 criterion. uploads/2014/01/dds_data_sheet.pdf


8 CSRI Measurement Model Analysis Notes: Because the replication sample size was not large (n=176) and because item-level variables often departed from normality, as is typical of clinical variables, a variable parceling strategy was employed for analysis to improve distributional characteristics and to reduce potential analysis distortion following from non-normality and small sample size (Floyd and Widaman, 1995) 1. For each set of scale item-constituents, the items with the highest and lowest level of kurtosis were combined for analysis, as indicated in the path diagram. *Kurtosis is more problematic than skew in structural equation modeling (SEM), as indicated in computer simulation studies. Large circles represent latent variables (i.e., factors); rectangles represent indicator variables (CSRI items); small circles represent unique variance (error) of indicator variables; curved arrows represent factor correlations and straight arrows spanning from factors to indicator variables represent regression weights. 1 Floyd, F. J., & Widaman, K. F. (1995). Factor analysis in the development and refinement of clinical assessment instruments. Psychological Assessment, 7(3), Arbuckle, J. A., & Wothke, W. (1999). Amos 4.0 User s Guide. Chicago: Smallwaters Corporation. 3 Bentler, P. M. (1990). Comparative fit indexes in structural models. Psychological Bulletin, 107, Bollen, K. A. (1989). A new incremental fit index for general structural equation models. Sociological Methods and Research, 17, Tucker, L. R., & Lewis, C. (1973). A reliability coefficient for maximum likelihood factor analysis. Psychometrika, 38, Browne, M. W., & Cudeck, R. (1993). Alternative ways of assessing model fit. In K. A. Bollen & J. S. Long (Eds.), Testing structural equation models (pp ). Newbury Park, CA: Sage. 7 Joreskog, K. G., & Sorbom, D. (1988). LISREL 7: A guide to the program and applications. Chicago: SPSS. 8 Kline, R. B. (1998). Principles and practice of structural equation modeling. New York: Guilford. 9 Hu, L. T., & Bentler, P. M. (1999). Cutoff criteria for fit indexes in structural analysis: Conventional criteria versus new alternatives. Structural Equation Modeling: A Multidisciplinary Journal, 6, Fit Criteria Notes: CMIN/DF values between 2 and 5 are indicative of acceptable model fit. CFI, IFI, and TLI values are indicative of good model fit when their value exceeds.9 (Kline, 1998) 8. RMSEA values <.06 indicate good fit and.08 to.1 mediocre fit (Hu & Bentler, 1999).