Equality and Diversity Annual Report
|
|
|
- Maria Chandler
- 5 years ago
- Views:
Transcription

1 Equality and Diversity Annual Report Where we all make a difference
, age, marital status and pregnancy and maternity for staff-in-post, applicants for jobs, promotion and training as well as the results of")
2 1.0 Introduction The employment duty of the Equality Act 2010 requires public bodies to monitor the workforce for the protected characteristics of disability, ethnicity, gender, gender reassignment, sexual orientation, religion and belief (or lack thereof), age, marital status and pregnancy and maternity for staff-in-post, applicants for jobs, promotion and training as well as the results of training, disciplinary and grievance procedures, performance appraisal and leavers. In addition to this historically the Department of Health document the vital connection recommended monitoring bullying and harassment, violence and aggression, sickness absence, applicants for flexible working, maternity leave, percentage of staff working part-time, occupational groups, and length of service and carers status. All of the this is reflected where possible in the breadth of the workforce equality monitoring reporting produced. The new national workforce race equality standard has introduced new performance metrics and these are published separately on the Trust website. The purpose of workforce equality monitoring is to identify if the workforce is representative of the local population and if the composition of the workforce is representative at all levels in the organisation; to identify if there is any difference in experience and outcomes of employment processes between staff that hold different protected characteristics and if there is to investigate any underlying reasons and take action to address and remove those differences. The aim is for there to be no difference in experience based on protected characteristics.
3 2.0 Purpose The purpose of this paper is to report the results of employment monitoring between 1 April 2016 and 31 March 2017 in accordance with the statutory equality duty. The equality monitoring data presented in this report is extracted from ESR (electronic staff record) data, the employee relations tracker in business HR and from TRAC for applicants for employment. Staff are reminded periodically through internal communications to check and update personal equal opportunities monitoring information and have the ability to do this through ESR self-service. There is still some unknown data for some protected characteristics and staff continue to have the option of choosing not to disclose equality monitoring data. Equal opportunities monitoring information is captured on the standard application form on NHSjobs, this interfaces with ESR to automatically transfer equality data for new appointments. Therefore by a process of natural attrition the % of complete equality data recorded in ESR should increase on a year on year basis as staff leave the Trust and are replaced by new staff. The completion levels of disclosed, do not wish to disclose and unknown data for each characteristic reported at end of March 2017 are detailed in the table below. The trust target for unknown or unanswered data has been set at 0% for all protected characteristics, the target of 0% unknown data has not been met for the characteristics highlighted in red above. However the amount of unknown data has clearly decreased in the last year. A target has been set of less than 25% I do not wish to disclose for all protected characteristics, this year there has been an increase in disclosure levels and the target for less than 25% do not wish to disclose has been met for all protected characteristics with the exception of religion and belief where despite some improvements 26.06% do not wish to disclose. The workforce diversity and disclosure targets are now included in the monthly PMR reports and the people report and are RAG rated. Both non-disclosure (choosing to specify I do not wish to disclose) and unknown data (where staff have not completed the equal opportunities monitoring form at all) should be borne in mind when interpreting the data. Gathering reliable workforce diversity data remains an important issue in order to plan improvements and analyse the employment data and process outcomes effectively. The data could still be improved in order to effectively meet statutory reporting duties on an ongoing basis and this is detailed where appropriate throughout the report. Further actions have been agreed in the E & D forward plan for to address this. percentage Target <25% Target 0% Protected characteristic Disclosed % Do not wish to disclose % Unknown % Gender Age Disability Religion or belief (or lack of) Sexual orientation Ethnicity Staff group PT/FT status Marital status

4 3.0 Staff in post 3.1. Occupational Group The Trust employed 6557 staff on 31st March The composition of the workforce by occupational group is shown in Table 1. Nursing and midwifery represents the largest staff group, accounting for % of the workforce this has remained static since 13/14. Almost a quarter (23.82%) of the workforce is employed in an Admin and Clerical capacity. Additional Clinical Services makes up 16.99% of the workforce and Medical and Dental staff equate to 9.43 % of the workforce. the population are over 65 and this is the highest ever). The trust has a flexible retirement policy that allows staff to manage their retirement, following the removal of the statutory default retirement age. The Trust is a DWP Age Positive employer and this is demonstrated in the age diversity of the workforce Table 2 Table Age The majority of the workforce employed is almost equally distributed in the age groups between with 12%/13% in each age group inbetween. The age group represents only 5.78% of the workforce (0.18% of which are under age 20), the number of school leavers is reducing and the number of staff employed in the age group decreased since last year. 16% of the local population are aged between and this is higher than the national average and reflects Liverpool city s popularity with students and young professionals. The age group under 20 are significantly underrepresented in the workforce. 7.41% are aged over 60 and this has increased slightly each year over the last three years. (it is anticipated that 41% of the population will be over 60 by 2033, the office of national statistics mid-year population estimates show that the median age of the population nationally is 40 and 17.75% of 3.3 Ethnicity Overall, the Trust employs 16.7% BME staff (for the purpose of this report BME is defined as any ethnic group other than White British) or % (if classifying BME as any other group than White British/White Irish). The percentage of BME staff employed has increased over the last four years. The number of staff whose ethnicity is undefined has decreased this year to 3.98% and the number of staff who do not wish to disclose has decreased to 1.48% staff are actively encouraged to updated their equal opp data through selfservice in ESR. The 2011 census data shows that the BME population has increased from 69% in 2001 and an estimate of 9% in 2009 to 13.8% in 2011(BME in the census is defined as any other ethnic group other than White British/White Irish). The BME staff employed using this definition is % and this demonstrates that BME staff are represented in line with the population at a whole trust level. Nationally the population is becoming more ethnically diverse and across England the proportion of white British has remained static and the BME community has been growing by around 4.1% a year.

5 It is expected that the workforce profile would shift in the same way and that the number of BME staff employed would increase annually in line with this population change. Recruitment diversity targets have been set for the Trust of 11% of applicants, shortlisted and appointed to be BME, this target will be monitored and reviewed over time. Table Religion and Belief This table depicts the breakdown of the workforce profile by religion / belief at a Trust level % of staff have stated that they do not wish to disclose their religion/belief this is a slight positive improvement in disclosure from % last year. 8.45% of staff have chosen not to provide any data which is an improvement from 9.77% last year. 50.3% of staff are Christian and this has increased each year over the last three years. Buddhism, Hinduism, Islam, Judaism, Sikhism and `other religions are all represented in small numbers in the workforce. In the 2011 census 71% of people in Liverpool reported that they were Christian, 17.3% reported no religion and 3.3% Muslim, other religions were represented in small numbers. Table Sexual orientation The majority of the workforce has declared that they are heterosexual % and % have stated that they do not wish to disclose their sexual orientation, this has decreased from 25.64% that did not wish to disclose last year. 8.54% have left this unanswered in comparison to 9.9 % last year. The number of staff declaring that they are gay and lesbian has increased each year over the last 4 years and the number of staff overall that have declared that they are LGB has increased to 1.81% of the workforce (equating to 119 staff). The number of staff disclosing their sexual orientation has increased from 58% to over 65 % in the last couple of years and the number of staff disclosing that they are LGBT is increasing each year. The trust is a member of the Stonewall Diversity Champions programme and aims to increase staff confidence in disclosing sexual orientation for equality monitoring purposes and to increase the number of Lesbian, Gay and Bisexual staff that we employ we have set a 6% recruitment target for LGBT staff. We actively promote stonewall initiatives and hold LGBT staff focus groups to engage with staff. Table Gender Nationally the population of England is approximately 50 percent male and 50 percent female (ONS) and in Liverpool 2011 census this was 50.6% female and 49.4% male and no change is projected by % of the workforce is female and % male, the number of males employed increased from however it has decreased slightly this year and males are still significantly underrepresented in the workforce (this reflects the
6 national workforce profile in the NHS). This may be attributable to nursing and healthcare being a female dominated profession and historical gender occupational segregation. Last year we set recruitment targets of over 30% male applicants, shortlisted and appointed to try to improve the representation of males in the workforce. Table Gender reassignment No staff have declared in equal opportunities monitoring information that the gender that they identify with now is not the gender that they were born in. This data was collected in 2008 via a data cleanse but is not currently collected on an ongoing basis via the application process as it is not included on the standard equal opportunities monitoring form on NHS jobs. There is no clear consensus on how to define the trans population, transgender people represent only a small proportion of those who might be considered trans with estimates of around 1550 and 5000 nationally (ONS). Although quantitative data is not available the business HR team have qualitative data that shows that Trans staff are supported within the workplace and a gender reassignment policy is in place Census within Liverpool 17.9% of working age considered themselves disabled compared to 13% nationally and disabled staff are significantly under represented in the workforce. A recruitment target has been set to increase the representation of disabled staff in the workforce. Anonymously in the staff survey around 17% of staff declare that they are disabled. Data is collected and recorded on an equal opportunities monitoring form in relation to impairment type however it is not currently possible to report on this from ESR. Work is underway nationally in preparation for the new workforce disability standard to explore the ability to report on impairment type in future reports. The Trust is a member of the Employers Forum on Disability and Mindful Employer. The Trust also has the Disability confident employer accreditation, one of the benefits of which is the offer of a guarantee of interview for disabled applicants who meet minimum requirements for a role. This year we have started to hold disabled staff focus groups to discuss how to support disabled staff, improve staff experience and encourage disclosure, The reasonable adjustments policy and process has been reviewed and redesigned and we work with the health and wellbeing service to provide staff with information on how to update and record their disability status on ESR, further opportunities to disclose are given at different points in employment e.g. via the annual PDR process, at occupational health appointments, at sickness review meetings etc. Table Disability 72.07% of staff have disclosed their disability status in 16/17. There are 105 staff that have declared that they are disabled (1.6 %) this has reduced over the last few years from 2.18 % in 2013/ % have declared that they do not consider themselves to be disabled and this has increased each year from 60.77% in 2013/14, 21% have not answered the question and 6.92% do not wish to disclose and these figures have improved since last year. In the

7 3.9 Carer Status We collected carer data on the my details data collection in 2008 and had a low response to this. At the time the aim of this was to enable us to define a baseline position however it is not requested on the national equal opportunities monitoring form, it cannot be recorded on ESR and because of this the data is not routinely collected for new starters Marital Status We collect marital status routinely on the standard recruitment application form. We have 100% complete data for marital status. The Liverpool census 2011 showed that almost half of the local population are single 49.7 % and 32.4 % married, the majority of our staff are married (43.13%) closely followed by 42.7% single and 0.78 % of the workforce is in a civil partnership. Single staff are under represented and married staff over-represented in relation to the local population. in 2010 and this is consistent with an increase in cohabiting couples and the general decrease in marriages since the early 1970 s. The proportion of adults who are married is projected to decrease over the next 25 years from 49 % to 42% and the proportion of people who have never married is projected to increase from 35 to 43%, the workforce profile is shifting in accordance with these projections and this trend is expected to continue. Table 8 The number of married couples decreased by 100,000 between 2001 and 2010 to 12.2 million

8 4.0 Applications for employment In 16/17 there were applicants for employment with the trust. Detailed tables breaking down applicants, short-listed and appointed staff by protected characteristics are detailed below. Diversity in recruitment targets were set last year for applications, shortlisting and appointed with an aim of improving workforce representation in under-represented groups and managers involved in recruitment are requested to complete equality and diversity training and to undertake unconscious bias testing and training. Diverse recruitment panels are also requested. 4.1 Gender Females accounted for 72.4% of all applicants for employment with the trust (a steady increase from 62.71% in ), 59% of people short listed and 78% of people appointed. We set a target of over 35% of male applicants, short-listing and appointed. Males accounted for 27.4% of all applicants (a reduction from last year), 40.7 % of those shortlisted and only 22% of appointments. Therefore we met the target for short-listing male applicants but not for all applications and appointments. From the information above and monitoring information it would appear that males are disproportionately less likely to apply and more likely to be shortlisted however females are more likely to be appointed at interview. Table 9a Table 9b Table 9c 4.2 Disability Applicants declaring a disability represented 4.6 % of all applications in 16/17 and this has increased each year since 13/14, this may indicate that confidence in working for the hospital is increasing in the disabled community. 5.3 % of people short-listed were disabled and 2.1% of people appointed meaning that a similar percentage of applicants that declared they were disabled were shortlisted however less disabled staff were appointed. We set a target of 15% of applicants disclosing disability at applications, short-listing and appointed last year and we have not met these targets. We are aware that there are issues with disclosing disability status at interviews and in employment (e.g. only 2% of staff disclose disability on ESR and 17% in staff survey), therefore it is recommended that the target for disability is reviewed to ensure that it is more realistic and achievable.

9 In line with the Disability confident employer scheme practiced by the Trust, those people who met the essential criteria for a post and requested that they were considered under the guaranteed interview scheme were automatically offered an interview, however not all disabled applicants wish to have a guaranteed interview. Table 10c The recruitment team have guidance on managing disabled applicants in the recruitment process they also have access to the Employers Forum on Disability advice line, Disability Directions, for specialist advice and support if required. From the information above it appears that disabled applicants are more likely to be shortlisted however non-disabled people are slightly more likely to be appointed. Further exploration is required around this in terms of barriers in completing the NHS application forms, short-listing and interview processes in the hospital. It may help to ensure that disabled staff are included and represented on interview panels. Table 10a 4.3 Ethnicity All ethnic groups were represented in our applicant, short-listing and appointed breakdowns, of which the highest number of applications received were from White British 69.6% (this has decreased from 73.8% last year). The number of applications from BME candidates has reduced each year over the last four years to 23.5% in 2017 and this needs to be explored further as it could be indicative of a loss of confidence in the BME community with the hospital as an employer. The BME application rate is a good representation in relation to the BME population in Liverpool. We set a recruitment target of 11% declared BME applications, short-listing and appointed last year. We have exceeded the target for applicants, short-listing and appointments of BME applicants as BME applicants made up 23.5 % of applicants, 42.4% of people short-listed and 16.4 % of appointments. Table 10b From the data analysis it appears that BME applicants are disproportionately more likely to be short-listed and less likely to be appointed than white applicants. The Commission for Racial Equality s code of practice advises that, in order to be able to draw reasonable conclusions from monitoring data, the ethnic coding should normally be a minimum of 90%; we have high quality ethnicity data for recruitment applicants. Action is being undertaken


.")

10 Table 11a applicants were from age group 16-20, of these 12.4% were shortlisted and 19.1 % appointed. The age group 60+ is under-represented in the Trust and the level of recruitment activity for these groups means that this is not likely to change in the near future without a concerted targeted recruitment programme to recruit older people. Table 12a Table 11b Table 12b Table 11c Table 12c 4.4 Age All age groups were represented throughout the recruitment and selection process. In 16/17 the largest group of applicants were from the age group (20.5 %). As age are significantly under- represented a target of 10% applicants, short-listed and appointed has been set for this group. This target for applications, shortlisting and appointing age year olds was met (21.3% in total) as 18.2% of applicants were from age group and 3.1% of


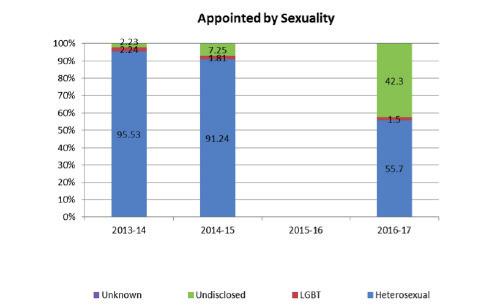
11 4.5 Religion and Belief In 16/ % of applicants declared their religion and belief and 14.1% did not wish to disclose this is an increase in non-disclosure for 15/16 and may be indicative of a change in public confidence in disclosing religion and belief in applying for a new job. Within the trust there is still a high number of staff who do not wish to disclose their religion (over 26%) and trust and confidence needs to be built in the use of this sensitive information. Applicants from all religions were included in the applicant breakdown. The majority 56.6% declared a religion of Christianity % of shortlisted applicants and 36.9% of appointments. Atheism again followed Christianity as the 2nd most declared religion at 11.5 % of applicants, 8.1% of short-listed and 10.1% of appointments. The number of applicants that declare that they are Islamic has increased in the last year to 4.9 % The number of applicants declaring a religion of `other has increased over the last four years. Table 13a Table 13c 4.6 Sexual Orientation Over 88% of applicants declared their Sexual Orientation; this gives us an indication of public confidence in disclosing sexual orientation when applying for a new job although within the Trust there are still % of staff who do not wish to disclose sexual orientation. Through work with Stonewall and awareness raising of LGB issues we are continuing to increase disclosure rates. The majority of applicants (85.6%) declared their sexual orientation as heterosexual and this is decreasing annually from % in 13/14. We set a diversity recruitment target of 6% of applicants, shortlisting and appointed to be LGB. We did not meet this target this year as only 2.8 % of applicants declared that they were LGB, 2.5 % of shortlisted and 1.5% of appointments. Of heterosexual staff applicants 91.7 % were shortlisted, and 55.7% appointed. Table 13b This appears to show that LGB applicants were more likely to be shortlisted but less likely to be appointed than heterosexual applicants. This needs to be explored further. We take positive action to promote the trust as an LGB positive employer via recruitment advertisements, supporting Liverpool Pride and our Stonewall Diversity Champion status.

12 Table 14a Table 14c Table 14b

13 5.0 Maternity leave In the last year 166 staff returned from Maternity leave. No declared LGB staff took maternity leave last year. The majority of staff taking maternity leave are white 85.7 % and 13.86% BME. The number of BME staff taking maternity leave has increased in the last year. No staff aged under 20 took maternity leave in the last year, 27.11% of those taking maternity leave were aged 26-30, % were aged 31-35, and the remaining 31 % were those aged between 46 and 55. The trend shows that over the last three years the age profile of staff taking maternity leave is shifting toward less staff under the age of 30 taking maternity leave and more over 30 s.
14 6.0 Paternity leave In the last year 16 members of staff took Paternity Leave, this is a relatively small number in relation to the workforce (0.29%) there is a concern around the accuracy of recording of paternity leave by operational managers in ESR and this will be addressed this year. 6.1 Age Applicants for Paternity Leave ranged from age up to 51-55, there were no staff under 20 or over 50 that took paternity leave in the last year. 6.2 Ethnicity 62.5% of paternity leave applications were from White staff and 25 % from BME staff, This means slightly more BME staff are taking paternity leave than is expected in comparison to the BME workforce. 6.3 Religion or Belief Around 50% of staff taking paternity leave did not wish to disclose their religion or belief this makes the data difficult to make any meaningful analysis of. 6.4 Sexual Orientation The majority of staff declaring their sexual orientation that took Paternity leave were heterosexual (68.75 %) and the remaining staff did not disclose their sexual orientation. No individuals declaring themselves to be gay, lesbian or bisexual staff accessed paternity leave. This may mean that we need to do some continued awareness raising of the availability of paternity leave for same sex couples in the Trust. 6.5 Disability Status 0 staff that declared that they were disabled took paternity leave in the last year.


15 7.0 Career breaks In the last year 8 staff applied for Career Breaks. This is a small number in relation to the workforce and makes it difficult to make any meaningful interpretation of the data. The majority of staff that took career breaks were white; no BME staff took a career break in the last year. However the following is noted no applicants were under 20, 31-40, or over 60 the majority of applicants were over 46. Seventy-five percent of staff taking career breaks worked full-time and 30% part-time. The number of part-time staff taking career breaks has decreased slightly this year. No applicants for career breaks declared that they were LGBT. The majority of staff taking a career break last year were female and the number of males taking a career break has reduced. The majority of staff taking career breaks this year were married 37.5%, with a quarter single and a quarter divorced.


16 8.0 Promotions 466 staff were promoted in the last year, a promotion is defined as a member of staff moving up to a new pay band/pay scale. The majority of staff promoted were female % and 26% male. This is an increase in the number of men being promoted and reflects that proportionality that would be expected with a 25.58% male workforce The highest number of promotions again last year were staff employed in the age groups under 35 which accounted for over half of the promotions and 11.72% in age group This seems to indicate that staff in these age groups are more likely to be promoted in the trust than older staff or staff under 21. This could be due to ambition or a number of other reasons. In the last year the majority of promotions were from white staff %, the number of white staff promoted has reduced over the last three years and the number of BME staff promoted has increased. Previously BME staff were underrepresented in promotions in comparison to the BME workforce however the number of BME staff promoted has increased over the last three years to % in the last year and this is now more than representative of the BME workforce % of staff that were promoted were not disabled (almost consistent to last year) and 1.07 % disabled, this is less disabled staff being promoted last year and is slightly less than would be expected with a 1.6 % declared disabled workforce The majority (89.27 %) of staff that were promoted in the last year were fulltime and this has increased over the last three years. The number of part-time staff promoted has decreased again this year to % and as 27.42% of staff are part-time, PT staff are significantly underrepresented in promotions in respect of the workforce. All posts are advertised stating that flexible working options will be considered. As more females work part-time than males due to childcare and carer commitments it is important for promotion opportunities to be available for staff working on a part-time basis.


 in previous years the most grievances have been raised by age 51-55. 9.3 Religion and Belief In 16/17 41.")
17 9.0 Grievances 79 staff raised formal grievances in the last year this is an increase from 53 last year however it is still a relatively small number in comparison to the workforce and could be indicative of a positive employee relations climate where employee issues are resolved at an informal stage before the formal process is invoked. The small numbers make it difficult to draw conclusions but do allow some interpretation of the data. The HR team have introduced an employee relations tracker in the last year that may have resulted in an increase in reporting accuracy and data quality. 9.1 Age Again no grievances were lodged by staff aged under 21 and this is expected with the workforce profile. The highest number of grievances were raised by staff aged between 56 and 60 (20.25%) in previous years the most grievances have been raised by age Religion and Belief In 16/ % of staff raising grievances declared that they were Christian, other religions were represented in grievances in small numbers. 6.33% of grievances were raised by Islamic staff which is high compared to only a 1.43% islamic workforce % did not wish to disclose disability status and 16.48% were unknown. The lowest number of grievances are raised by staff under 30 and Disability In 16/17 63 % of grievances were lodged by staff that did not wish to disclose their disability status. 0 % of grievances were lodged by disabled staff therefore disabled staff are under-represented in raising grievances this year. 9.4 Sexual Orientation % of staff involved in grievances in the last year did not declare their sexual orientation and 16% their sexual orientation is unknown % were straight and 2.53% LGB, the number of LGB staff raising grievances last year is higher than last year and it is slightly higher than would be expected with a 1.81% LGB workforce. The percentage of disabled staff raising grievances has decreased significantly over the last three years from % in 2013/2014 to 0% this year.


18 9.5 Gender In 16/17 69% of grievances raised were from female staff and 30.38% from male staff, the number of males raising grievances has increased this year and males have become slightly overresented in raising grievances in comparison to the male workforce. 9.7 Contract Status In 16/17 the majority of grievances were raised by full-time staff 75.95% and 24% by parttime staff, the number of part-time staff raising grievances has significantly decreased this year to be more proportionate in relation to the workforce profile. 9.6 Ethnicity The majority of grievances were again raised by white staff, the number of BME staff raising grievances has increased over the last few years with 18.99% of grievances last year being raised by BME staff, BME staff are over-represented in grievances in comparison to the BME workforce.


19 10.0 Disciplinaries 34 staff were involved in disciplinaries in the last year; this is a reduction from 52 cases last year and appears to be indicative of a climate in which employee relations issues are resolved at an informal stage before the formal process is invoked. increase disclosure of religion and belief to be able to monitor more effectively. 2.78% of those disciplined were atheist and this is high considering a 0.78 % atheist workforce % were Christian and this is significantly under-representative of the Christian workforce Age The age group under 21 was not represented in disciplinary cases and this is reflective of the age breakdown of the workforce profile. The highest percentage of cases were aged (20.59%) with an over representation of staff in this age group compared to the workforce profile Disability In 16/17 no staff involved in disciplinaries declared that they are disabled and this is a significant reduction from last year and more proportionate to the disabled workforce. The disability status of 35% of staff involved was not disclosed Sexual Orientation % of staff involved in disciplinaries in 16/17 disclosed that they were LGBT and this is over representative of the LGB workforce, this is a similar number of LGB staff that were disciplined as last year. This disproportionality should be monitored closely and investigated further. There is a high level of undisclosed data and there needs to be an increase in the disclosure of sexual orientation for staff involved in disciplinaries to be able to make any meaningful analysis of the data Religion and Belief A high number of staff involved in disciplinaries chose not to disclose religion and this makes it difficult to interpret the data. We need to 10.5 Gender 47% of disciplinaries involved female staff in 16/17 and 52.94% involved male staff, males are significantly over-represented in disciplinaries and females under-represented, this statistic needs to be monitored and reviewed.

20 10.6 Ethnicity National research published in 2010 The involvement of black and minority ethnic staff in disciplinary proceedings Centre for inclusion and Diversity, University of Bradford found that BME staff were almost twice as likely to be disciplined as white staff, the picture in the trust over the last few years does not reflect the national findings. In 16/ % of disciplinaries included BME staff (any other stated ethnicity other than White British/White Irish) this is more than last year and slightly less than would be expected with a 16.7% BME workforce. The data quality for ethnicity has improved this year with 0% unknown ethnicity % of staff entering disciplinaries were white (under representative of the white workforce).
 and appears to be indicative or a climate in which employee relations issues are resolved at an informal stage before the formal process is invoked.")
 staff in this age group are significantly over-represented in bullying cases as only 13% of the workforce employed are")
21 11.0 Bullying and Harassment 10 staff lodged formal bullying and harassment cases in the last year; this is a relatively small number and makes it difficult to identify trends (Less than 1% of the overall workforce) and appears to be indicative or a climate in which employee relations issues are resolved at an informal stage before the formal process is invoked. The staff survey results show issues with bullying and harassment with BME and disabled staff anonymously reporting experiencing a higher rate of bullying and harassment in the workplace Age The highest number of bullying cases fell in the age range of (40 %) staff in this age group are significantly over-represented in bullying cases as only 13% of the workforce employed are in this age group and age (20%). No staff aged under 20, between raised bullying cases Religion and Belief The majority of staff raising bullying complaints were Christian. 5.56% were Islamic and 20% atheist atheist and islamic staff are overrepresented in bullying cases. This should be explored further and monitored over time. The policy should be promoted to all staff Disability In 16/17 no disabled staff raised a bullying complaint, 70% of the staff that were involved in bullying cases were non-disabled and 30% did not wish to disclose. There has been a clear reduction in the number of disabled staff raising bullying cases in the last year and this is positive as it is more representative of the disabled workforce Sexual Orientation In 16/17 10 % of staff raising bullying cases were LGB, this is slightly less than 11% last year however it is over representative of the LGB workforce (almost five times the level of declared LGB staff in the Trust). This should be explored further with the LGB staff focus groups and action taken to address this. 40% of the staff reporting bullying did not disclose their sexual orientation although disclosure levels have improved each year over the last three years.

22 11.6 Ethnicity The majority of bullying cases in the last year were lodged by White staff (80%) and 10.% BME staff, white staff are slightly over-represented in bullying cases this year and BME staff are underrepresented, the number of BME staff raising formal B & H complaints has reduced over the last three years. Awareness of the policy needs to continue to be raised with staff Gender In 16/17 80% of the B & H cases raised were from female staff and 20% from male staff, females are over-represented in bullying cases in the last year.
 and 21.88% aged 26-30 with only 12.")
23 12.0 Leavers Analysis During staff left the Trust, this equates to 12.47% of the workforce and is a reduction in turnover since Age % of leavers were aged although only 5.6% of the workforce are in this age group (more than three times the expected rate) and 21.88% aged with only 12.4 % (more than double the expected rate) this shows that younger staff are over-represented in leavers this appears to be indicative of a retention issue with younger workers in the Hospital that has increased over the last two years Religion and Belief We did not have the data relating to religion or belief for over 30% of leavers (unknown and did not wish to disclose) the data quality needs to continue to be improved. The highest number of leavers that declared their religion were Christian (45.7%) followed by % atheist and 3.67% Islamic (both much higher than would be expected with the workforce profile). This statistic needs to be explored further with younger staff and monitored over time Disability The majority of leavers in 16/17 were not disabled (75%) and 21.76% did not disclose disability status. 2.87% of leavers were disabled and this is more than would be expected with a 1.6% disabled workforce Sexual Orientation In 16/17 we did not have the sexual orientation for 26.89% of leavers (undisclosed and unknown) % of leavers declared that they were heterosexual and 2.93% LGB. LGB staff are over-represented in leavers in comparison to LGB staff in the workforce of 1.81% and the number of LGB staff that have left has increased over the last three years, LGB staff are under-represented over all in the workforce and if this continues may become more under-represented. This needs to be explored further with staff through the LGB staff focus group. The number of disabled leavers has increased in the last year.


24 12.5 Gender In 16/17 the majority of leavers were female 69.32% and 30.68% male, males were overrepresented in leavers and females underrepresented. Males are under-represented in the workforce and if this statistic continues may become more under-represented Length of service In 16/ % of leavers had 1-5 years service and 25.79% had less than 1 years service, the number of leavers with less than 5 years service has significantly increased in the last year and this could still be indicative of a retention issue for new staff and should be explored further in terms of improving the recruitment, onboarding process and career development opportunities for staff Ethnicity In 16/ % of leavers were BME, this is higher than expected with a 16.7 % BME workforce and the number of BME staff leaving has doubled in the last year. White staff were under-represented in leavers. BME staff are under-represented in the workforce, if this overrepresentation in leavers continues it may further reduce BME representation in the workforce Leaver Reason The highest number of leavers were due to voluntary resignation 56 % followed by 18.45% end of fixed term contract and 10.5% retirement.

25 13.0 Attendance at Training We do not currently have the ability to report on applicants for training as this is not managed centrally. We can report on access to formal training and development through training records. We have 24,252 records of staff attending training in the period Age 13.4 Sexual Orientation In 16/17 67/93% of staff attending training were heterosexual and this has increased over the last few years. 2.13% of staff attending training were LGB and this is slightly more than would be expected with the LGB workforce % of staff did not disclose their sexual orientation Disability 72.46% % of staff that accessed training in 16/17 were not disabled, 25.8 % did not declare their disability status and 1.74% of staff declared that they were disabled; this is what would be expected in line with the disabled workforce Gender For the 4th year running more than three quarters of staff attending training were female (80.96%) this has increased very slightly over the years and is higher than expected with the female workforce Religion and Belief Over 40% of the staff attending training courses did not wish to disclose their religion or belief and this makes it hard to make any meaningful interpretation of the data. Of staff that did disclose their religion over half 54% were Christian which is slightly more than would be expected with the workforce profile. Only 19% of staff accessing training were male and this is an under-representation of male staff in access to training (26% male workforce) and has decreased further over the last four years. This appears to demonstrate that males are not receiving proportionally as much access to training as females in the workforce and needs to be investigated further.

26 13.6 Ethnicity The majority of staff accessing training in 16/17 were White British (84.88%), 11.14% were BME, BME staff are under-represented in accessing training in the last year in comparison to the workforce and this has decreased slightly in the last year Contract status The majority of staff accessing training over the last four years have been full-time with 75.82% in 16/17, 24.18% were part-time and this is proportionate to the part-time workforce for 16/17.


27 14.0 Band Breakdown 14.1 Contract Status This graph demonstrates that the pay bands with the highest proportion of part-time workers are band 2, 3 and 4. There has been an increase in part-time working at higher levels this year, band 8c and non-agenda for change bands have the lowest proportion of part-timers with only 4.9% of staff in these roles working part-time Gender Males are under-represented in pay bands 3, 4,5,6,7 in relation to the % gender of breakdown of the workforce profile and females are under-represented from band 8a, the level of over-representation of males increases to over double the representation of the male workforce at band 8d and above and non-agenda for change Occupational group This graph demonstrates the band breakdown by occupation group Disability status This chart demonstrates the distribution of disabled staff by pay band, disabled staff are under-represented in comparison to the overall disabled workforce in band 4, band 8a and band 8b, band 9 and non- agenda for change, and over represented in band 8d and band 8c all other bands disabled staff are representative of the workforce profile. There is a high level of undisclosed data in non-agenda for change posts Sexual orientation There is a higher representation of LGB staff at band 2, 4, 5, 8a and above and non-agenda for change in comparison to the overall 1.81 % LGB workforce and an under-representation at band 3, 6 and 7 none at a higher level, disclosure of sexual orientation needs to be improved at all levels.
28 14.7 Marital Status Band breakdown by marital status Ethnicity BME staff are slightly under-represented at band 5 and 8d in comparison to a 14.7% and in medical roles (non-agenda for change) and representative of the workforce employed at band 6. BME staff are under-represented in all other bands Age This table depicts the age breakdown by age 15.0 Recommendations The annual equality monitoring report will be reported to the Equality and Diversity Sub- Committee and to the Workforce committee. The monitoring results will be reviewed and an action plan put in place to further investigate and redress any indications of potential disadvantage and to inform improvements to our workforce practice and employment monitoring processes. The report and statistics will be published on the Trust website.


29 The Royal Liverpool and Broadgreen University Hospitals NHS Trust Prescot Street Liverpool L7 8XP Tel: Please recycle this document