Topics in Labor Supply
|
|
|
- Buck Norris
- 5 years ago
- Views:
Transcription
1 Topics in Labor Supply
2 Derivation of Labor Supply Curve What happens to hours of work when the wage rate increases? In theory, we don t know Consider both substitution and income effects. As the wage rate increases, the price of leisure is getting higher reducing the amount of leisure time, so called substitution effect. In the case of leisure being a normal good, people tend to increase the amount of leisure time income effect.
![[Figure 1]](/docs-images/95/123541505/images/3-0.jpg "Income effect")

3 [Figure 1] Income effect dominates substitution effect
4 Given the available time of 110 hours per week, the worker is choosing 70 hours of leisure and 40 hours of work at the initial wage rate of $10 per hour equilibrium is the point P. Suppose the wage rate increases to $20 as a result, the budget line rotates and the new equilibrium point becomes the point R. The movement from the point P to point Q is called income effect (arising from a change in worker s income, holding wage rate constant) reduces hours of work.
5 The second-stage move from Q to R is called the substitution effect, showing the change of equilibrium as the wage increases, holding utility constant generates a substitution away from leisure time (now being more expensive) and toward more consumption of work. While substitution effect leads to an increase 10 hours of work, the worker tends to increase 15 hours of leisure time due to an income effect the stronger income effect leads to a negative relationship between hours of work and the wage rate.
![[Figure 2]](/docs-images/95/123541505/images/6-0.jpg "Substitution")

6 [Figure 2] Substitution effect dominates income effect
7 The substitution effect (the move from Q to R) increases hours of work by 15 hours. The income effect (the move from P to Q) decreases hours of work by 10 hours. There is a positive relationship between hours of work and the wage rate since the substitution effect dominates income effect. In summary, As increase in the wage rate increases hours of work if the substitution effect dominates the income effect and vice versa
8 Decision on whether to work or not to work? The role of reservation wage person expects the minimum wage level above which they will enter into the labor market. The person will not work at all if the offered market wage rate is less than the reservation wage. The decision to work is based on a comparison of the market wage and the reservation wage.
![[Figure 4] The](/docs-images/95/123541505/images/9-0.jpg "relationship")

9 [Figure 4] The relationship between reservation rage and work decision
10 A high reservation wage makes it less likely that a person will enter the labor market. What determines the level of reservation wage? Taste for work (determining the slope of indifference curve), non-labor income, the number of young children, spouse income, etc,. How to measure reservation wage? For workers in the labor market, we know that their reservation wages are at least higher than market wage.
11 For persons who are not in the labor force, we know that their reservation wages are higher than offered market wages. It is crucial to control for reservation wage in the modern analysis of labor force participation, particularly for married women. Holding the reservation wage constant, the theory implies that a person with a high market wage is more likely to work. There is a positive correlation between wage rates and labor force participation rates.
12 For the recent US labor market, the increases in the females wages tend to increase women s LFP but for Korean labor market? The increase in wage rates make the opportunity cost of leisure and make persons more likely enter the labor market only substitution effect exist.
13 Labor Supply Curve The labor supply curve is the predicted relationship between hours of work and the wage rate. In theory, the ambiguity in the sign of the relation between hours of work and the wages rates rises only among working persons depending on whether substitution or income effect dominates. For the initial low level of wages, substitution effects dominate but as wage rate is getting higher, income effects dominate backwardbending labor supply curve.
![[Figure 5] A](/docs-images/95/123541505/images/14-0.jpg)
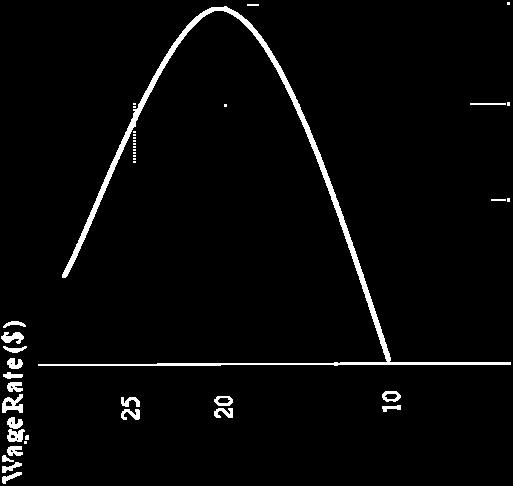
14 [Figure 5] A Backward-bending labor supply curve for a worker
15 Labor Supply Elasticity Measuring the responsiveness of hours of work to changes in the wage rate labor supply elasticity. δ = percent change in hours of work / percent change in wage rate For example, the worker s wage is initially $10 per hour and she works 1,900 hours per year the worker s wage is now increased into $20 per hour and she decides to work 2,090 hours per year The calculated worker s labor supply elasticity 10%/100% = 0.1
16 Estimates of the Labor Supply Elasticity We have to decide which groups should be included in the empirical analysis whole sample, male group or female group. Focus on the estimates of the labor supply elasticity for men since most prime-aged men participate in the labor force. Typical regression model of labor supply is given by H = b*w +c*v + d* other factors + e where h is the hours of work, w is the wage rate, V is the non-labor income
17 If we take logarithm both on the hours of work and wage rate, we can interpret estimated coefficient b is the elasticity of labor supply. The sign of coefficient b depends on whether income or substitution effect dominates. b is positive if substitution effects dominate and is negative if income effects dominate. The coefficient c should be negative since workers with high levels of non-labor income consume more leisure given the assumption that leisure is a normal good.
18 Issues for estimating labor supply elasticity (1) Hours of work the span of the time (i.e. per day, per week, or per year) measurement error associated with the hours of work in the survey data usually survey asks the respondents over the weekly hours of work during the last week
19 (2) Wage rate compensation contract annual salary or monthly salary define wage rate the ratio of annual earnings to annual hours of work problem associated with calculating hourly wage rate division bias over-reporting hours of work would be associated with low wage rates generate a spurious negative correlation between hours of work and average wage rates the wage rate is not observed for people who are not working self-selection bias
20 (3) Non-labor income Non-labor income should have nothing to do with how many hours the worker works The source of non-labor income might stem from having worked long hours in the past The correlation between non-labor income and hours of work can be positive simply because persons who have large levels of non-labor income are the persons who tend to work many hours matter of taste for work Some studies reporting the positive coefficient of c does not always say that leisure is an inferior good