The Power of Metrics in Research Administration
|
|
|
- Amy Franklin
- 5 years ago
- Views:
Transcription

1 The Power of Metrics in Research Administration Webinar October 30,
2 Jim Luther Assoc. VP Finance, Sponsor Liaison and Compliance Officer Duke University Kerry Peluso Assistant Vice President for Research Administration and Finance Florida State University 2
3 Session Description Over the past decade, many institutions have invested in institutional systems that can be leveraged to support metric analysis. Duke University is one of these universities and they have built a comprehensive structure for utilizing their data to support, build, and manage their operations. At Duke University, they have institutional systems for proposal submission, purchasing, travel, ledger, closeout, post-award processes, training, etc. The data from these systems is integrated to create monitoring metrics for cost-transfers, effort reporting, and other compliance requirements and is now available for data mining, analysis, and visualization to support the research mission and faculty more effectively. The integrated data supports improved compliance, business operations, workload management and more at the department, school, and institutional levels. 3
4 Objective Learning Objectives: Participants will be able to describe how a university can utilize data to support, build, and manage their operations. Participants will learn ways that integrated data can support improved compliance, business operations and workload management. Participants will understand some methods that other institutions are utilizing to gather, report, and share metrics. 4
5 Today s Discussion Brief review of key points of Metrics Diving in to learn about a comprehensive structure for research administration metrics Duke University 5
6 The Power of Metrics in Research Administration KEY POINTS: RESEARCH ADMINISTRATION METRICS 6

7 Research Administration Metrics What is a metric? What is a Key Performance Indicator (KPI)? 7

8 What Gets Measured Awareness demands attention and creates focus Allows clear goals to be set Drives performance 8

9 Transparency Share results Set expectations Acknowledge Recognize Drives Performance 9
10 Metrics for Research Administration Statistics: #/$ of awards, proposals, expenditures, reports, invoices; # of subawards processed, # of cost transfers; Time Measurements: Contract negotiation time; award setup time; response time; Ratios: Cash collection; workload; Feedback: Satisfaction Surveys; Other feedback methods; 10
11 A Well-Built for Metrics Communicates to staff where focus should be directed Provides staff with the opportunity to be recognized for accomplishments and achieve goals that will really matter Emphasizes priorities and progress to customers Communicates reality Supports the goals of the organization 11
12 Largest Mistakes Made With Metrics Not developing an organized structure for which metrics are captured and simply gathering/reporting what you can Believing that we can capture any metric we want Providing the metrics because we can get them easily get from our system Developing metrics for many areas and expecting success across the board Not carefully evaluating and communicating what a metric means 12
13 How are metrics captured and shared Via ERP Software Routing Systems Help Desk Software Survey Software Other sources including Access Databases, Excel Spreadsheets or even in manual logs Shared via reports, dashboards Often using software such as Tableau, Endeca, OBIEE or other business intelligence/analytics software 13
14 The Power of Metrics in Research Administration DUKE UNIVERSITY A MODEL FOR METRICS 14
15 Key Point Not everything that counts can be counted, and not everything that can be counted counts. Albert Einstein 15
16 Agenda PCI Portfolio Complexity & Infrastructure Training / Status 1/2/3 Closeout Data RCC Monitoring Metrics of Metric Data Integrated Research Financial & Management Indicators Workflow Roles Procure Method HR Master Data Closeout Metrics Proposal & Award Data 16 16
17 Integrated Research Financial & Management Indicators Fitting the Puzzle Pieces Together Procurement Data Master Data Risk Metrics Financial Human Resources 17 17
18 DUKE OVERVIEW & STRUCTURE 18
19 Background Research Admin at Duke Research Funding:$1B ($650 Federal) and 10,000 projects Decentralized Post-award (1 office) and Pre-award (3 offices) / Approximately 600+ GM s & Ghosts New and Evolving Systems with Workflow, Status Transparency, and Operational & Management Reporting Lots of data points from many, many systems Foundation Leadership support (RACI): very engaged Desire for accountability & transparency IT Infrastructure SAP & Tableau (data visualization) Progress has been a combination of Evolution and Revolution 19 19
20 Performance Metrics in Research Administration 2014 Training / Status 2010 PCI Portfolio Complexity Closeout Data RCC Mont g Metrics Integrated Research Financial Indicators Workflw Roles Procure Method Closeout Metrics Financial & Master Data HR Master Data
21 Performance Metrics in Research Administration Vision Integrate the expanding breadth of data to support management and operational reporting at the dept., school, and institution level Evolving model Compliance Reactive Diagnostic (Root Cause) Predictive (Algorithm Based) Objectives: (Short term / Long Term) Financial Management Workload Management Leadership Reporting Internal Control and Compliance Management HR Management (including training & performance management) 21 21
22 THE EVOLUTIONARY AND REVOLUTIONARY GROWTH OF THE USE OF METRICS EVOLVING MODEL COMPLIANCE REACTIVE DIAGNOSTIC (ROOT CAUSE) PREDICTIVE (ALGORITHM BASED) 22
")

23 Evolution / Revolutionary Phases Phase 1 Phase KIBCE Phase Cost Transfers CAS RCC Data Points (Institutional Compliance Focus / Top 10 Lists) PCI Evolving RCC Data (Root Cause) Data with Root Cause; Tableau for Visualization; Some Integrated Datasets Future Fully Integrated, Interpretive & Predictive 23 23
 24")
24 Evolution / Revolutionary Phases Phase Cost Transfers CAS RCC Data Points (Institutional Compliance Focus / Top 10 Lists) 24 24
")

25 Evolution / Revolutionary Phases Phase Cost Transfers CAS RCC Data Points (Institutional Compliance Focus / Top 10 Lists) Data with Root Cause; Tableau for Visualization; Some Integrated Datasets Future Fully Integrated, Interpretive & Predictive 25 25
 Data with Root Cause; Tableau for Visualization; Some Integrated")
26 Evolution / Revolutionary Phases Phase PCI Evolving RCC Data (Root Cause) Data with Root Cause; Tableau for Visualization; Some Integrated Datasets 26 26
27 Evolution / Revolutionary Phases Phase 3 KIBCE Future Fully Integrated, Interpretive & Predictive 27 27
28 Research Costing & Compliance (RCC) The Office of Research Costing Compliance (RCC) constantly monitors the state of financial research compliance at Duke University. Through analysis of financial data and with input from the Management Centers, RCC Monitoring provides both targeted input and assistance in remediation of risk issues. Approach to Compliance Management (MIR) Monitor: Assessment of Current Status through data collection and analysis Integrate: RCC strives to integrate monitoring with measures that mitigate risk to Duke University. RCC therefore coordinates basic data monitoring with: Education and Training Communication Policy and Procedure review Review/Enhancement of System/Internal Controls Remediate: Achieved through: Regularly scheduled meetings with Management Centers Enhanced reporting in response to Management Centers and RCC identified needs Collaborative work with University IT groups to achieve technology solutions Comprehensive training and updates for grant managers Direct intervention in departments (answering departments requests for training and clarifications) 28 28

 School / Management")
 Department")
29 Monitoring - Tiered Strategy Exec VP / Audit Committee (Institutional Risk) School / Management Center (Management Oversight) Department (Mitigation) 29 29
 Includes: comprehensive testing, mentors, lead trainers, class projects FasTracks Content specific classes Symposium 500+ staff members in")
30 Research Costing Compliance (RCC) Training Mandatory Compliance Education (PI, GM, BM) AAR Training (Allowability, Allocability, & Reasonableness) - to support technology rollouts and front-end controls Certification Programs (based on HR Classification) Includes: comprehensive testing, mentors, lead trainers, class projects FasTracks Content specific classes Symposium 500+ staff members in day-long breakout sessions
31 EXAMPLES OF METRICS 31
32 Evolution RCC Metrics (Cost Transfers) Institutional Level Data Supports Risk awareness and management to leadership / Board Dept l Level Data Departments: Top and Bottom 10 Reporting Red-Yellow-Green Reporting School Inclusion into Monthly Risk Mtg & SOM Report Card Detailed Reporting Actionable Reports by GM, BM, PI, Dept, etc
33 Evolution Closeout Process UG and Agency Enforcement 90/120 day enforcement of financial and programmatic reports Analysis of P.A.E.D. Identification of Postings After End date Root Cause Analysis Understanding the underlying process and/or technology that allows late postings Detailed Reporting Identification of a) Compliance Risk and b) Financial Risk 33 33

34 Evolution Portfolio Complexity (PCI) Tool to support >80% HR Initiative # and $ of grant funds = complexity Portfolio Complexity Calculation of individual grant complexity Addition of Workload Data # and Type of Transaction posted to project Addition of Variability Data Portfolio complexity is impacted by variability of sponsor and/or PIs 34 34
 Fictional Data 35")
35 Research Costing Compliance Monitoring Metrics (School Level ) Fictional Data 35 35
 Dept 1 Dept 2 Dept 3 Dept 4")
36 Research Costing Compliance Monitoring Metrics (Department Level ) Dept 1 Dept 2 Dept 3 Dept
37 Portfolio Complexity Index (PCI) Key Elements - Complexity of Portfolio (Pre and Post-award) - Sponsored Project Workload ($ and #) - Workload Variability (# of different sponsors and PIs) 37 37
38 Expectations of Grant Manager Responsible Financial Person in Support of PI for all financial aspects of Grant Oversight Allowability Management: allocability, reasonableness & allowability of all expenditures charged to the grant Effort Management: management of effort commitments, overcommitments, etc. Budget Management: management of budget In many cases, categories, the GM will be overspending, personally responsible projections, for these activities and etc. in other situations there may be multiple parties involved, but ultimately the GM is responsible to the PI for management of these three aspects of project oversight
39 Portfolio Complexity Index (PCI) Objective: Develop methodology to provide input to HR Team in support of Rollout and long-term management of job classifications Short-term: support consistent classification of personnel within and across depts./schools Long-term: alignment of complexity with job levels/classifications, training, and performance management Training and education: Confirm adequacy of training based on assigned complexity (RCC curriculum, training objectives alignment) Workload management tool for departments 39 39
40 PCI: Phase 2 Update PCI Phase 1: Measures portfolio complexity based on classification of individual project codes; rolled up by GM, PI, Dept, etc. Phase 2: Expanded to include Workload metric Number of Projects; Number of Transactions; Total Expenditures Variability Index (PI and Sponsor) Portfolio complexity is correlated to the number of PIs and the number of Sponsors 40 40

41 PCI Overview Example Postaward M$ s Managed Post-award Codes Managed Trans / Month PI s Supported Sponsors Supported Portfolio Complexity GM 1 $ GM 2 $ GM 3 $ Issue: when evaluating HR level, training requirements, compensation, how can an institution evaluate the true complexity of a portfolio? 41 41

42 PCI Overview Example Workload Variability PCI Postaward M$ s Managed Post-award Codes Managed Trans / Month PI s Supported Sponsors Supported Portfolio Complexity GM 1 $ GM 2 $ GM 3 $ Issue: when evaluating HR level, training requirements, compensation, how can an institution evaluate the true complexity of a portfolio? 42 42
43 PCI Overview Example Workload Variability PCI Postaward M$ s Managed Post-award Codes Managed Trans / Month PI s Supported Sponsors Supported Portfolio Complexity GM 1 $ GM 2 $ GM 3 $ Issue: when evaluating HR level, training requirements, compensation, how can an institution evaluate the true complexity of a portfolio? 43 43
44 PCI Overview Example Workload Variability PCI Postaward M$ s Managed Post-award Codes Managed Trans / Month PI s Supported Sponsors Supported Portfolio Complexity GM 1 $ GM 2 $ GM 3 $ Issue: when evaluating HR level, training requirements, compensation, how can an institution evaluate the true complexity of a portfolio? 44 44
45 PCI Overview Example Workload Variability PCI Postaward M$ s Managed Post-award Codes Managed Trans / Month PI s Supported Sponsors Supported Portfolio Complexity GM 1 $ GM 2 $ GM 3 $ Issue: when evaluating HR level, training requirements, compensation, how can an institution evaluate the true complexity of a portfolio? 45 45


46 RCC Certification & HR Classification - Outline Projects Transactions Projects with PCI >
47 Portfolio Complexity Index (PCI) Objective: Develop methodology to provide input to HR Team in support of Rollout and long-term management of job classifications Short-term: support consistent classification of personnel within and across depts./schools Long-term: alignment of complexity with job levels/classifications, training, and performance management Training and education: Confirm adequacy of training based on assigned complexity (RCC curriculum, training objectives alignment) Workload management tool for departments 47 47

48 Data Definitions 48 48


49 PCI Regression Factors PCI 49
 GM 1 GM 2")
50 Sample PCI Data (Phase 2) GM 1 GM
 # with only a post-award score: 140 (28%) # with both scores: 256")
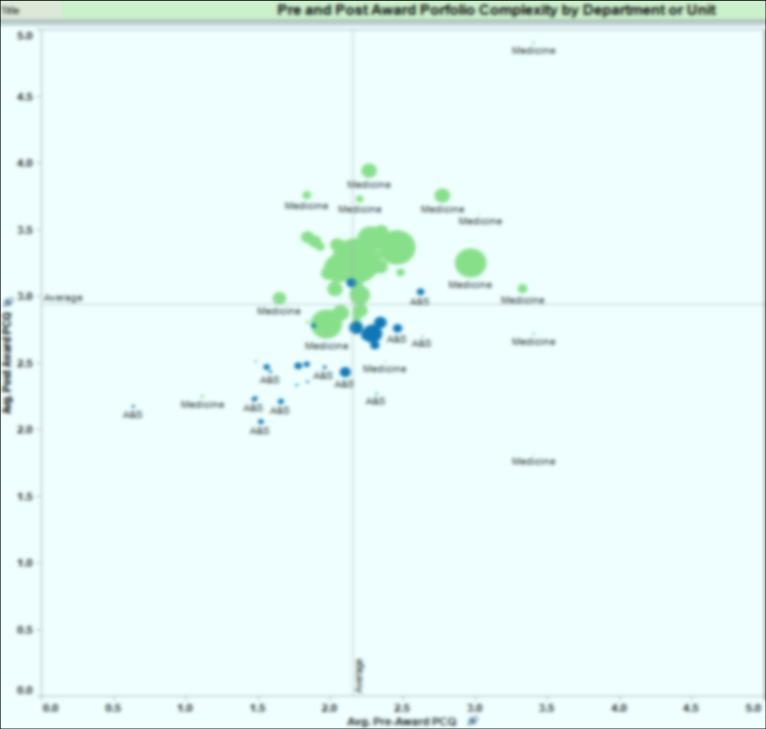
51 Metrics Complexity (PCI) Variability Workload PCI Overview Example Pre and Post Award Report Levels Project Grant Manager Faculty member Department, School Interpretation # with only a pre-award score: 108 (21%) # with only a post-award score: 140 (28%) # with both scores: 256 (51%) 51
52 PCI 1. Methodology is very complex; primary driver is the regression analysis which takes all of the subjective decision-making out of the process (e.g. should a DoD contract be weighted higher than a Gates Foundation grant with 10 foreign subcontracts). 1. The regression analysis determined which fields should be used and these were vetted with the PCI development team, central offices reps, and then dept l reps. 2. And most importantly, this is only one element, albeit quantitative, that should be taken into account when being used by HR and department
")
53 Portfolio Complexity Index (PCI) PCI Phase 1: Using Regression Analysis, measures portfolio complexity based on classification of individual project codes; rolled up by GM, PI, Dept, etc. Supported >80% Transition to classified positions Phase 2: Expanded to include Workload metric Number of Projects; Number of Transactions; Total Expenditures Variability Index (PI and Sponsor) Portfolio complexity is correlated to the number of PIs and the number of Sponsors Phase 3: Inclusion of Pre-Award PCI data through assignment of PAL Phase 4: with Training Data, etc. Phase 5: with Workflow Transactional Data Phase 6: Electronic Decision Matrix (EDM) 53 53
54 Data Performance Metrics Are the right people in the right roles? Who is in the submitter and approver roles for the various technologies? Are they trained/certified appropriately? Does their individual workload appear reasonable? Does management have a process to monitor and adjust for Workload & Complexity? Do the GM s have adequate time to meet with the PI s? Should their be a workload redistribution? Is the correlation between workload, complexity, training, and metrics reasonable? 54 54
55 Data Performance Metrics Are you utilizing the systems with the most efficient / effective controls? What are the transaction categories with the largest volumes ($ and #)? Do you have adequate controls? Have you over developed a control structure for low risk/count transactions? Have you under developed others? What is the absorption rate and utilization of new technologies? Can data be used to drive higher adoption of transactions with stronger internal controls? 55 55

56 Procurement Methods Fictional Data Dept 1 Dept 2 Dept 3 Dept

57 Dashboard View of Upcoming Closeouts
 and PAL (Preaward Liaison) fields maintenance is critical")
58 Internal Controls & PCI Supervision; Oversight P C I GM1 & PAL Assignments Training Audit risk mitigation appropriate assignments & training PCI driven process GM (Grant Manager) and PAL (Preaward Liaison) fields maintenance is critical 58


59 PCI Utilization GM PCI Scores - Set of aggregated measures providing a comprehensive overview of portfolio complexity, portfolio variability and workload Project PCI Score - Granular measure of project complexity. Should be a factor in training requirements identification for individuals managing a small set of complex projects, but with average overall scores Workload Variability Complexity Complexity HR Classification Workload Distribution Training Requirements Training Reqs. or Project(s) Re-allocation 59
60 Discussion and Outcomes Discussion points: Internal controls with respect to the total population performing grant management duties Appropriate assignment, training and oversight of GMs PCI as an Internal Control Tool in Support of Supervisor Oversight PCI, RCC Certification & HR Classification Not classified & not certified grant managers Future Discussion Automating calculation and frequency of PCI 60

61 Pre and Post-Award PCI Tool PCI is a composite report that combines both Pre-award and Post-award PCI analyses and provides a comprehensive overview of portfolio complexity, portfolio variability and workload Supports departmental decisions regarding workload assessment and assignments and to provide improved availability to PCI related information. Interpretation # with only a pre-award score: 108 (21%) # with only a post-award score: 140 (28%) # with both scores: 256 (51%) 61
")
62 Portfolio Complexity Index (PCI) PCI Phase 1: Using Regression Analysis, measures portfolio complexity based on classification of individual project codes; rolled up by GM, PI, Dept, etc. Supported >80% Transition to classified positions Phase 2: Expanded to include Workload metric Number of Projects; Number of Transactions; Total Expenditures Variability Index (PI and Sponsor) Portfolio complexity is correlated to the number of PIs and the number of Sponsors Phase 3: Inclusion of Pre-Award PCI data through assignment of PAL Phase 4: with Training Data, etc. Phase 5: with Workflow Transactional Data Phase 6: Electronic Decision Matrix (EDM) 62 62

63 KIBCE Key Indicators of the Business Control Environment 63 63
64 Key Indicators of the Business Control Environment (Risk Assessment Overview) Indicator Areas Personnel of Multiple Data Points PCI (Pre and Post-award Comparative Date - Distribution of Complexity) Training Status Workload & Variability RCC Metrics Cost Transfers, Effort Reporting, etc. Procurement Methods 64 64
65 Key Indicators of the Business Control Environment Objective Score (Scale 1-5 (high risk)) Control Document Development and Review Indicator Area - Biology Dept 1 Support the Department / Personnel School / Management Center s review PCI (Distribution of Complexity) Provides management tool for department to Manage distribution of grant workload (in conjunction with PCI) Ensure training requirements are being met in conjunction (with Training Tracker) Indicator Area - Immunology Dept 2 Track the absorption and Personnel utilization of new technologies (e.g. Buy@Duke, Travel) Represents a portion of the quantitative input into the process; not comprehensive and does not include subjective data. Provides "context" so that management has a frame of reference when determining risk. Workload 3 Moderate workload per FTE Pre-award 4 Moderate Complexity Post-award 3 Moderate Complexity Training Status 5 Minimal certification in key roles Procurement Methods 5 Minimal Apparent Front-end Controls RCC Metrics 4.5 Extremely high CT s / Moderate CAS Workload 2 Low workload per FTE PCI (Distribution of Complexity) Average = 4.08 Average = 2.14 Pre-award 2 Very Low Complexity Post-award 4 High Complexity Training Status 2 75% GM s certified Procurement Methods 2 45%: Minimal Front-end Controls RCC Metrics 1 Low #/% of CT s and CAS 65


66 Worksheet 66 66

67 Post-award PCI and Training 67 67


68 Dept 2 Dept 1 68

69 Department 1 No Certification Training Did not renew RAA in FY11 AGM Certificate RCC Certificate Business Manager No Certification Training RCC Certificate Did not renew RAA in FY11 Business Manager AGM Certificate 69
70 Key Success Factors PCI Derivation Issues Post-award Reliability of GM Field: GM field needs to be consistently populated and updated. PI s and GM s have a one-to-many and many-to-many relationship making derivation complex Pre-award Direct supporting relationship of GM to PI is not clear (not specifically identified in master data) Other Factors & Subjectivity Regardless of Complexity analysis, there will still be subjectivity applied to the process Years experience, Level of Autonomy, Portfolio variation, Quality of work, Certification/Education, Number of PI s supported, Specific PI requirements, Transaction Volume, Impact of supporting both Post & Pre activities Other Responsibilities 70 70
 with complex award portfolio, high variability in PI & sponsor, high workload and inadequate training Interpretation / Action: redistribute work and get staff trained 2) Dept.")
71 Interpretative & Predictive Algorithms to Drive Interpretation and Actionable Steps through Exception Reporting & Dashboards 1) Dept. Grant manager (GM) with complex award portfolio, high variability in PI & sponsor, high workload and inadequate training Interpretation / Action: redistribute work and get staff trained 2) Dept. approvers who aren t trained and high Cost Transfer levels = Problem Interpretation / Action: Train approvers in AAR, Review workload assignments, review internal controls, analyze transfer volume by project and GM 3) Late Closeout Documents, Revised FFR s, Significant postings after close = Potential financial loss and institutional compliance risk Interpretation / Action: Review Upcoming Closeout List with focus on SubAcct; Enlist School backlog. 4) GM s with complex Pre and Post portfolio, lots of proposal waivers and late closeout documents Interpretation / Action: separate pre-award from post-award responsibilities; review training 5) High P-card, High CT volume, Late Closeouts, UT CTs support for Use purchasing process with better controls, ensure transaction creator/approver have AAR training
72 DATA INTEGRATION AND METRICS IMPROVED COMPLIANCE BUSINESS OPERATIONS (thru clearer training needs and better transparency), & WORKLOAD MANAGEMENT at the department, school, and institutional levels 72
73 Not everything that counts can be counted, and not everything that can be counted counts. Albert Einstein Building infrastructure and business case will take time Proactive Evolutionary & Revolutionary 73 73
74 QUESTIONS? 74