PARLIAMENTARY PORTFOLIO COMMITTEE PRESENTATION ON PERFORMANCE OBJECTIVES: QUARTER 3 OF 2016/17
|
|
|
- Emily Merritt
- 5 years ago
- Views:
Transcription

1 PARLIAMENTARY PORTFOLIO COMMITTEE PRESENTATION ON PERFORMANCE OBJECTIVES: QUARTER 3 OF 2016/17 Making you WeatherSMART Ms. Mmapula Kgari: Interim Chief Executive Officer 15 March 2017
2 CONTENTS AG Q3 Dashboard Summary of Performance (Q2 & Q3) High Level Structure Strategic Goals and Objectives Performance Q3, 2016/17 Financial Performance Q3 2016/17 Conclusion 1
3 DASHBOARD REPORT Doc Ref no: SAWS Report 3rd Qtr. 30 January
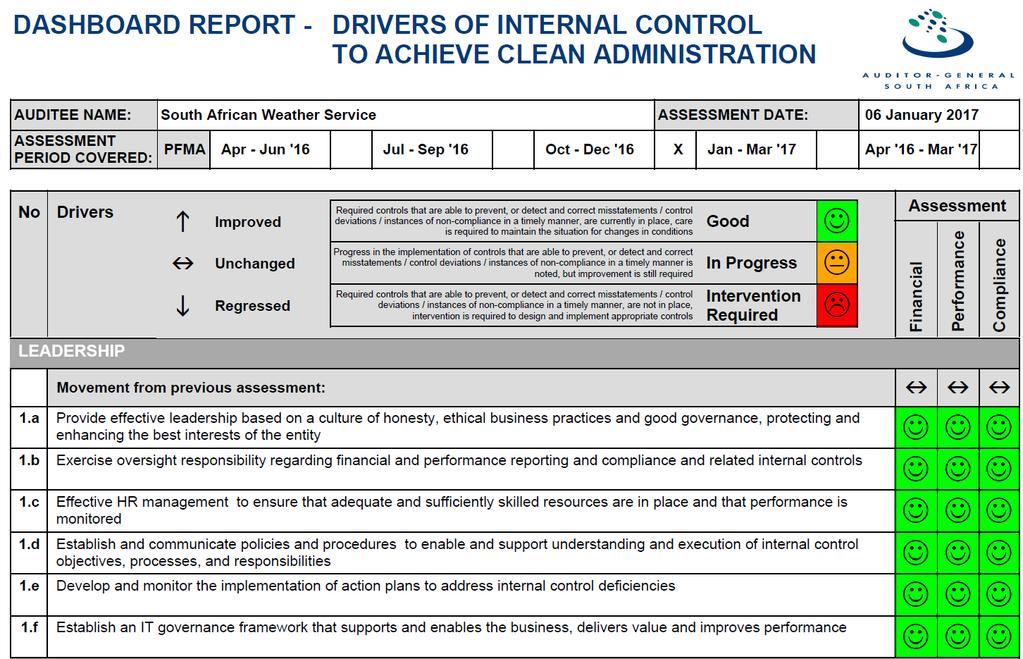
4 DASHBOARD
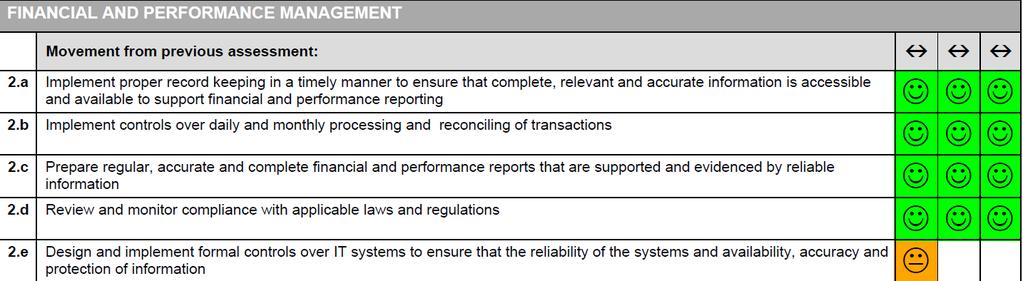
5 DASHBOARD
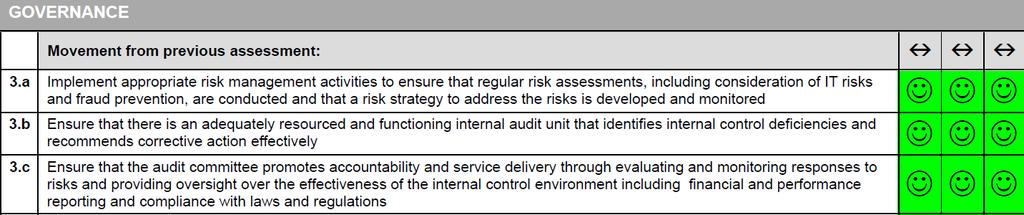
6 DASHBOARD
7 Summary of Performance: Q2 & Q3 2
8 INTERPRETATION KEY ACTUAL PERFORMANCE AGAINST TARGETED PERFORMANCE Met all requirements (On target) QUARTER 3 of 2016/17: ACTUAL PERFORMANCE AGAINST PRE-DETERMINED OBJECTIVES Partially Met requirements substantially there may be changes to requirements (Work in progress) Not Met none/ some requirements Requires urgent attention (Off target) No milestone No set milestone for that period Information not provided Information not evaluated at the time of reporting 6
9 OVERALL SUMMARY PERFORMANCE ON OBJECTIVES For Quarter 2 & 3 of 2016/17 FY Quarter % on % Work in Progress % Off % No milestone Q2 83% (24/29) 3% (1/29) 14%(4/29) 0.1% (2/31) Q3 70% (21/30) 10% (3/30) 20% (6/30) 0.03% (1/31) 20% (6/30) of the targets had delayed implementation in Q3. This is 6% more if compared to Q2; The delayed indicators are as follows: % completion of the As Is 'community weather smart needs analysis report across all targeted communities % availability of RADAR data % availability of employee capability for core and critical skills % increase in leadership competency index Stakeholder Satisfaction rating % of funds secured for conducting SEB Study 3
10 PERFOMANCE ON OBJECTIVES Quarter 2: 2016/17 Performance Quarter 3: 2016/17 Performance 14% 0% 20% 0% 3% 10% 83% 70% Partially Not No Action Required Not achieved Partially No Action Required. 7
11 HIGH LEVEL STRUCTURE 2

12 HIGH LEVEL ORGANOGRAM 3
13 STRATEGIC GOALS AND OBJECTIVES 2
14 STRATEGIC GOALS AND OBJECTIVES Strategic goals Strategic goals Strategic Objectives Goal Statement Short Title Long Title Strategic Goal 1: Meteorological Products 1.1 Develop and provide meteorological The impact of climate change is resulting in Provision of Products and Services and Services that meet the needs of a weather-smart nation are provided and related products and services for targeted communities nationally 1.2 Develop and market meteorological and related products and services for specific economic sectors an increasing number of extreme weather events, which impacts on food security, lives and property. This calls for the development and provision of innovative products and services for both commercial and public good purposes that enable a weather- 1.3 Establish strategic partnerships for smart nation. products & services Strategic Goal 2: Service Delivery 2.1 Upgrade, expand and optimise A shortage of skills in weather and climate Capability and Capacity Developed Infrastructure and Human Capital Capability and Capacity developed infrastructure 2.2 Position SAWS as employer of choice related sciences makes it difficult for SAWS to consistently deliver on its mandate and achieve its vision. This requires building a 2.3 Build a talent pool for atmospheric talent pool both in-house and on a national sciences as a national imperative basis whilst extending and upgrading our current infrastructure. 4
15 STRATEGIC GOALS AND OBJECTIVES Strategic goals Short Title Strategic goals Strategic Objectives Goal Statement Long Title Strategic Goal 3: Strategic relationships 3.1 Position SAWS as a SAWS functions in a complex scientific and service environment Engaged stakeholders leveraged and Stakeholders engaged relevant Meteorological Institution where it is essential to maintain and manage stakeholder relationships to the benefit of both parties. Through the 3.2 Manage and leverage strategic relationships activities supporting this goal SAWS is committed to effectively partner, collaborate, manage and leverage its key stakeholder relations to deliver on SAWS' mandate and objectives and to ensure its sustainability. Strategic Goal 4: Research, knowledge and Intelligence created in Research, knowledge support of a weather-smart and intelligence creation nation 4.1 Grow weather and climate knowledge base SAWS is mandated to innovate and provide products and services that are designed to solve real life weather related challenges. This requires ongoing research to maintain its technological edge in meteorology and related disciplines. Strategic Goal 5: Growth and sustainability Revenue growth and 5.1 Grow Revenue SAWS is an essential element of South African public life, organisational sustainability Streams achieved contributing to both the country's economic activities and safety of life. In order to grow while also ensuring that it remains sustainable, SAWS must establish sustained and high value sources of revenue to fund its operations. 5
16 STRATEGIC GOAL 1: PROVISION OF PRODUCTS & SERVICES 8
17 STRATEGIC GOAL 1: Provision of Products and Services SO 1.1: Develop and provide meteorological and related products and services for targeted communities nationally Key Performance Indicator % completion of the As is community weather- smart Needs Analysis Report across all targeted communities for the development of products and services to improve weather resilience Number of community segmented products and/or services provided Baseline Annual 2015/ /17 As is and community 100% completion of As is weather-smart Needs and community weather Analysis Report smart Needs Analysis (16/17) Report across all targeted communities for the development of products and services to improve the weather resilience Community 1 new (not previously segmented products provided) product or and/or services in the service for a community market segment Maintain the provision of 4 existing community segmented products and/or services 2016/17 3 rd Quarter Conduct community weather-smart needs survey Launch 1 new (not previously provided or developed) product or service for a community segment Maintain the provision of existing products Achievement/ Challenges / Corrective measures Not Study will be conducted in Q4 due to delays experienced in securing required resources Partially Provision of 4 existing products maintained. Three (3) new products developed: 1. Extended Range Forecast product. 2. Climate Change Reference Atlas developed nearing completion 3. Community Rainfall station - is scheduled to be Launched on the 23 rd March 2017 during the World Meteorology Day 9
18 STRATEGIC GOAL 1: Provision of Products and Services SO 1.2: Develop and market meteorological and related products and services for specific economic sectors Key Performance Indicator Number of sector specific products provided % Completion of 5- year marketing plans for sector specific products on weather and climate in targeted sectors % Implementation of annual milestones for Sector specific 5- year marketing plans Baseline 2015/16 Sector specific products - Product Release certificates Quarterly Reports 5-year marketing plans for sector specific products and services: 2016/17 Agriculture Sector specific 5-year marketing plans 2016/17 3 sector specific products provided into the market in 2016/17 100% completion of 5- year marketing plan for sector specific products on weather and climate for the agricultural sector % Implementation of annual milestones for Sector specific 5- year marketing plans: 80% agricultural sector 2016/17 3 rd Quarter Energy sector specific product 75% completion of 5- year marketing plan for sector specific products on weather and climate for the agricultural sector 60% completion of annual milestones for sector specific 5-year marketing plan for the agricultural sector Achievement/ Challenges / Corrective measures Solar product developed: 1. Solar Resource Assessment Report Partially achieved Agricultural sector Marketing Plan is in draft format and will be completed in Q4. The agricultural sector Forum inputs are still to be added to Marketing Plan 82% of annual milestones in value achieved, i.e an equivalent of R1.4 million from sales of Agro/Hydro Products was secured. Negotiations with Cotton SA and some Commercial farmers underway 10
19 STRATEGIC GOAL 1: Provision of Products and Services SO 1.2: Develop and market meteorological and related products and services for specific economic sectors Key Performance Indicator Number of joint ventures and strategic alliances established Baseline 2015/16 Agreements of joint ventures and strategic alliances 2016/17 1 Joint Venture & 1 Strategic Alliance established 2016/17 3 rd Quarter Engage with partners Achievement/ Challenges / Corrective measures Contracts with 2 partners to explore potential areas of collaboration is underway By end Q4 only a Strategic Alliance contract will be secured and the JV will require a lengthy process 11
20 STRATEGIC GOAL 2: CAPABILITY AND CAPACITY DEVELOPMENT 12
21 STRATEGIC GOAL 2: CAPABILITY AND CAPACITY DEVELOPMENT SO 2.1: Upgrade, expand and optimise infrastructure Key Performance Indicator Baseline 2015/ / /17 3rd Quarter Achievement/ Challenges / Corrective measures % Availability of data Radar Radar data availability Report Radar data availability = 80% Radar data availability = 80% Not Radar Availability = 76% Non-achievement due to power failures and communication problems in December 2016 Repairs of faulty parts are on schedule An aggressive maintenance programme is underway for the whole observation network % Availability of data LDN LDN data availability report LDN data availability = 95% LDN data availability = 95% LDN data availability = 97.5% Percentage availability of SAAQIS SAAQIS availability report SAAQIS availability = 90% SAAQIS availability = 90% Oct 99.13% Nov: 100% Dec: (statistics due at the end of January 2017) 13
22 STRATEGIC GOAL 2: CAPABILITY AND CAPACITY DEVELOPMENT SO 2.2: Position SAWS as an employer of choice Key Performance Indicator Baseline 2015/ / /17 3 rd Quarter Achievement/ Challenges / Corrective measures % implementation of annual milestones for the SAWS dual career pathing programme % (increase) in employee capability for core and critical skills % increase in leadership competency index Dual career pathing programme implementation report(s) Employee capability programme proposal/concept Leadership development programme proposal/concept Implement 80% of annual plan/ targets of the dual career pathing programme Establish baseline in employee capability 5% increase in leadership competency index 60% implementation of the dual career pathing programme Conduct analysis of current employee capability Conduct analysis of current employee leadership capability Not Analysis to be done in Q4 in line with organisational development recommendation % employee retention rate for core/critical skills Competency assessments report(s) Employee retention reports 92% employee retention rate for core/critical skills 92% employee retention rate for core/critical skills % achievement of Employment Equity (EE) targets as per the organisational EE plan EE Plan EE Reports 74% Africans 3% People With Disabilities 40% women in core 100% of EE targets achieved 42% women in management 14
23 STRATEGIC GOAL 2: CAPABILITY AND CAPACITY DEVELOPMENT Key Performance Indicator % completion of the phase of implementation of the National Educational Plan % Implementation of annual targets of the Regional Training Centre (RTC) strategy Number of bursaries Percentage of bursars absorbed by SAWS in critical strategic areas % completion of Doctoral programme plan % implementation of Doctoral Programme milestones SO 2.3: Build a talent pool for atmospheric and related science as a national imperative Baseline 2015/16 NEP implementation reports RTC Strategy Implementation plan RTC APP Report on bursaries awarded Appointment letters of absorbed bursars Contracts of employment of absorbed bursars Report on progress of implementation of the Doctoral programme 2016/17 100% completion of phase 1 of the NEP 80% of the RTC APP targets achieved 2016/17 3 rd Quarter Stakeholder engagement as per the stakeholder engagement plan for the NEP 70% of the RTC APP targets achieved Achievement/ Challenges / Corrective measures 62 bursaries awarded Advertise bursaries 60% of bursars absorbed N/A No action required for quarter 3 100% completion of Doctoral programme plan 10% of the doctoral programme annual milestones achieved 75% completion of Doctoral programme plan 15
24 STRATEGIC GOAL 3: ENGAGED STAKEHOLDERS 16
25 STRATEGIC GOAL 3: ENGAGED STAKEHOLDERS SO 3.1: Position SAWS as a relevant meteorological institution Key Performance Indicator % completion of annual targets as set out in the corporate communications strategy % (increase) in traffic volumes on media platforms (website/ facebook, twitter, YouTube) Rand value Advertising Value Equivalent (AVE) (cumulative) Baseline 2015/16 Corporate communications strategy. Progress reports on the implementation of the corporate communications strategy Reports on traffic volumes/ hits (website/ facebook, twitter, YouTube) Rand value Advertising Value Equivalent (AVE) (cumulative) 2016/17 Implementation of 80% of annual communications programmes for 2016/17 as per the communications strategy Establish a baseline in traffic volumes on media platforms (website/ facebook, twitter, YouTube) Advertising Value Equivalent (AVE) -R22m 2016/17 3 rd Quarter Implementation of 60% of communications programmes as per the communications strategy for 16/17 Monitor media platforms to engage stakeholders (website/facebook, twitter, YouTube) Advertising Value Equivalent (AVE) - R16m Achievement/ Challenges / Corrective measures Resource appointed to assist with strategy review; Media conference held; activities executed as per plan Twitter and Facebook monitored and grew exponentially. Initiated YouTube content consolidation. Cumulative AVE exceeded due to additional exposure caused by severe weather 17
26 STRATEGIC GOAL 3: ENGAGED STAKEHOLDERS Key Performance Indicator Number of engagement programmes for targeted stakeholder groups as per SES(2016/17) Baseline 2015/16 Stakeholder engagement plans SO 3.2: Manage and leverage strategic relations 2016/17 Engagement programmes for 8 targeted stakeholder groups(ses) 2016/17 3 rd Quarter Engagement programmes for 2 targeted key stakeholder groups Achievement/ Challenges / Corrective measures Partially Resources recruited to assist with the development of the engagement programme for 5 stakeholder groups Overall stakeholder satisfaction rating (expressed as a percentage) Overall stakeholder satisfaction rating as per stakeholder perception survey report Overall stakeholder satisfaction rating - 86% Conduct a stakeholder satisfaction survey Not achieved Delay due to poor response by service providers for survey in Q3 18
27 STRATEGIC GOAL 4: RESEARCH AND KNOWLEDGE / INTELLIGENCE CREATION 19
28 Key Performance Indicator % of funds secured for conducting SEB study Number of partnership agreements for applications and / or products development for various socioeconomic sectors in support of the NCCRP National Framework for Climate Services (NFCS) implementation per key sector STRATEGIC GOAL 4: RESEARCH AND KNOWLEDGE / INTELLIGENCE CREATION Baseline 2015/16 Funding proposals Funding commitments Partnership agreement for applications and / or product development NFCS Implementation report SO 4.1: Grow weather and climate knowledge base 2016/17 25% of funds secured for conducting SEB study 1 partnership that translates into applications or products for decision making in modelling Implementation of NFCS facilitated for 3 key climate sensitive sectors 2016/17 3 rd Quarter 15% of funds secured for conducting SEB study Negotiate with partners on identified application/ product Implementation of NFCS for energy Achievement/ Challenges / Corrective measures Not No funds allocated for the project in 2016/17FY Two draft agreements are in place (UKMO and EUMETSAT) and scheduled for signing in Q4 Climatological mean of surface incident shortwave flux for nine provinces of South Africa, determined Primary reporting not under NFCS but under Energy (R&D). However, as there is a synergized working platform, comment for this part of the NFCS (Energy) is achieved. 20
29 STRATEGIC GOAL 4: RESEARCH AND KNOWLEDGE / INTELLIGENCE CREATION Key Performance Indicator Number of peerreviewed articles published in accredited national or international scientific journals where SAWS scientists are the leading author or coauthor. (cumulative target) Baseline SO 4.1: Grow weather and climate knowledge base 2016/17 3 rd Quarter 2015/ /17 Peer- reviewed articles 14 publications 12 publications published in accredited national or international scientific journals where SAWS scientists are the leading author or coauthor Achievement/ Challenges / Corrective measures Five (5) peer reviewed articles published. Accumulative Total = 12 21
30 STRATEGIC GOAL 5: GROWTH AND SUSTAINABILITY 22
31 STRATEGIC GOAL 5: GROWTH AND SUSTAINABILITY SO 5.1: Grow revenue streams Key Performance Indicator Parliamentary grant funding excluding SAAQIS Baseline 2015/16 MTEF allocation letter Audited financial statements 2016/ /17 3 rd Quarter R189,28m R47,32m Achievement/ Challenges / Corrective measures Growth in year-on-year aviation revenue Audited financial statements R108,37m R30,76m Growth in commercial revenue as per set target (annual total revenue) Audited financial statements R18,00m R4,74m 23

32 SAWS EMPLOYMENT EQUITY STATISTICS 24
33 SAWS PROFILE AS AT 31/12/16 - EMPLOYMENT EQUITY Occupational Levels Male Female Foreigners Total A C I W A C I W Top management Senior management Professionally qualified and experienced specialists Skilled technical and academically qualified workers, supervisors Semi-skilled and discretionary decision making Unskilled and defined decision making Temporary Employees TOTAL PERMANENT
34 SAWS STATS VS THE DEMOGRAPHICS OF SA- EMPLOYMENT EQUITY Race National Demographics SAWS s SAWS Actual Statistics Variance SAWS versus Actual Africans 80.50% 74.00% Whites 8.30% 14.70% Coloured 8.80% 8.80% Indians 2.50% 2.50% 69.81% -4.82% 19.41% 4.71% 8.45% -0.35% 2.97% 0.47% Total % % % Foreigners 0.00% 0.00% 2.00% - Employees with Disabilities 2.00% 3% 1.36% % 26
35 FINANCIAL REPORT FOR THE PERIOD ENDING 30 June
36 FINANCIAL REPORT ACTUAL VERSUS BUDGET for the period ending 31 December 2016 Description 2015/16 FULL YEAR Actual R 2016/17 FULL YEAR Budget R 2016/17 FULL YEAR Forecast R 2016/17 YTD Budget R 2016/17 YTD Actual R 2016/17 YTD Budget Variance R 2016/17 YTD Budget Variance % Total Revenue 310,333, ,356, ,335, ,569, ,052,735 26,483, % Total Expenditure (299,106,873) (341,356,000) (328,617,076) (256,705,052) (246,486,822) 10,218, % Administrative Expenditure (9,919,429) (10,076,459) (7,277,798) (7,717,720) (5,459,274) 2,258, % Compensation of Employees (187,183,858) (222,763,000) (218,152,751) (167,263,000) (163,614,564) 3,648, % Other Operating Expenditure (102,003,586) (108,516,541) (103,186,527) (81,724,332) (77,412,984) 4,311, % Operating Surplus/(Deficit) 11,226,193-39,718,509 (2,135,552) 34,565,913 36,701, % (before depreciation and amortisation) Depreciation (26,967,798) (23,964,894) (22,879,437) (17,973,670) (23,543,408) (5,569,738) % Amortisation (3,233,246) (4,927,106) (4,386,800) (3,695,329) (3,335,276) 360, % Gains from Fair Value Adjustments 2,625, % (Deficit)/Surplus for the Period (16,349,112) (28,892,000) 12,452,272 (23,804,551) 7,687,229 31,491, % 28
37 FINANCIAL REPORT - REVENUE Actual versus Budget for the period ending 31 December 2016 Revenue: Total revenue above budget by R16,78 million (9.89%) Aviation revenue above budget by 20.39% % (R11,05 million) Non-Regulated Commercial revenue % above budget (R10,28 million) 29
38 FINANCIAL REPORT - EXPENDITURE Actual versus Budget for the period ending 31 December
39 FINANCIAL REPORT - EXPENDITURE Actual versus Budget for the period ending 31 December 2016 Cont d Expenditure Total Expenditure (excluding Depreciation and Amortisation) amounted to R246,49m which is 3.98% (R10.22m) below the year-to-date budget of R256.71m. Administrative Expenditure below the year-to-date budget of R7.71m by 29.26% (Actual:R5.46m) mainly due to: Bad debts actual is R1,24m,due to the reversal of the Provision for Doubtful Debts Training budget of R1,80m is 36% spent with actual amounting to R652k.As at 31 December 2016, an amount of R1m is related to training was committed; and Conference Costs- budget of R584k is 42% spent with actual amounting to R243k. (Savings R341k). Employee Costs below the year-to-date budget of R m by 2.18% (Actual: R163.61m) mainly due to: vacancies which are expected to be filled during the course of the year. Operating Expenditure Actual below the year-to-date budget of R81,72m (Actual: R77,41m). : Software Licenses below budget by R8.95 million (timing difference); and Consultancy Fees Actual expenditure of R150k from a budget of R2,15m (Savings: R2m) Only R500k will be utilized by end of this current financial year and the funds will be re-allocated based on business need. Foreign Travel expenditure incurred amounts to R2,09m and is 33% (R1,03m) below the year-to-date budget of R3,12m 31


40 Thank you! Discussion? 32