PERU ,000 76% 0.25% $ US$ 3,990
|
|
|
- Mabel Bates
- 5 years ago
- Views:
Transcription


1


2 PERU ,000 76% $ US$ 3, % 2
3 PERU 66% National sanitation access 33% Rural sanitation access 36.2% Poverty 12.6% Extremely poverty 3
4 Pilots 4 zones (urban and rural) 48 Thousand families 24 months of promotion Evaluation Baseline 2007 Exit Line 2010 Monitoring Reports of promotion and sales Pilot Projects Creating Sanitation Markets Learning Knowledge management 4
5 Is there a potential market for the poorest? It costs to live well; nobody gives it for free We have to set an example, if you do it, other people will too. 5

6 Welfare State Financial Institutions 6
7 Welfare State Financial Institutions 7


8 Welfare State? Beneficiaries Financial Institutions 8


9 Creating Sanitation Markets for the Poorest Creating Sanitation Markets Place, Date, for Year the Poorest Development State Promotor Financial Institutions 9


10 Main actors of sanitation market Manufacturers & distributors Hardware stores Local governments Artisans Financial Institutions Services Community promoters 10

11 Results Fact Sheet Baseline Exit Line Field work June 2007 March-April 2010 Sample Size 1,300 surveys 1,500 surveys Margin of error / Level of significance +/- 2.5% 95.5% +/- 2.5% 95.5% Representativeness and inference Qualitative study National, by zone, urban/rural Focus groups, in-depth interviews and in-situ observation National, by zone, urban/rural and clients/non-clients Focus groups, in-depth interviews 11 and in-situ observations

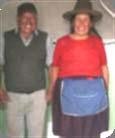
12 From beneficiaries to Consumers A A citizen With rights and responsibilities An enterprising person 12

13 Who is the sanitation consumer? Who is the sanitation consumer? Wide range of poor families who have different economic activities, income levels and are looking for progress in life. In addition, they demand social inclusion. 13


14 Farmer Services not qualified Merchants 14


15 15
![Segmentation [Discretionary Criteria] Income and ability to save Ownership of the house](/docs-images/95/125856282/images/16-1.jpg "Access to credit Education Urban Experience Preference for method of installation and")
16 Segmentation [Discretionary Criteria] Income and ability to save Ownership of the house Access to credit Education Urban Experience Preference for method of installation and purchase 16

17 Target segments Families who are able to purchase a full bathroom to their own taste. Families who are able to progressively purchase bathrooms with partial finishes. Families with the expectation of progressively purchasing simple bathrooms. Families without the possibility of purchasing bathrooms Associations that are engaged in the installation of bathrooms in a collective manner. Micro-entrepreneurs who want to improve the services they offer and increase their 17 income.


18 What is the expected product? A product that provides them with comfort, makes them feel worthy, and involves a long-term investment. 18


19 19


20 What was the product offered? What was the product offered? Technology Catalogue Installation Services Financing Services Information Services 32% Satisfied with the characteristics of the product 35% Satisfied with the installation services 94% Satisfied with the financial institution 25% Satisfied with the information / guidance 20


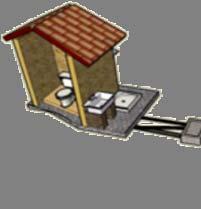


21 Sanitation Options Catalogue [Variety and freedom of choice] 21


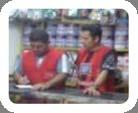
22 Points of sale [Access and exhibition] 22


23 Development of local capacities 23


24 Credit for Sanitation 24


25 Information, guidance and education 25

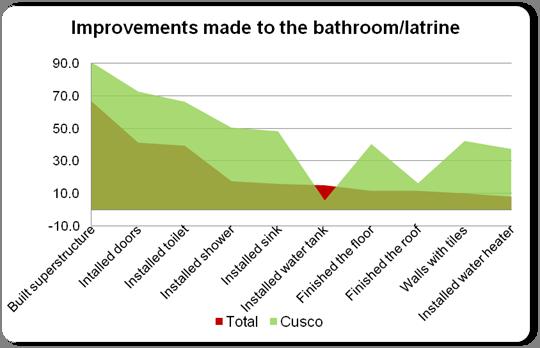
26 What are the results? A market that is getting stronger, families who are improving their quality of life, and local providers with new opportunities of employment t and 26 income.


27 A supply that meets demand 9,000 households Have installed a new bathroom or improved their current one 27


28 An effective promotional mix 32% Of those impacted by the promotion invested in the improvement or installation of a bathroom. 28

29 Priorization of sanitation 47% Have reommended investing in sanitation to their peers. 29


30 Use and maintenance of the sanitation facilities 81% of the installed bathrooms are working properly 30


31 Mobilizing families resources S/. 3.4 million was invested by the families, using only their own resources. 31

32 Mobilizing private sector s s resources S/. 1.6 millions Invested by the private sector in loans, training and promotion Loan portfolio value 1,501,905 Investment in fairs 28,500 Investment in promotion 28,550 Investment in training 50,303 Total in S/. 1,609,258 32


33 Increased access to sanitation 10% of households 10% Have gained access to quality sanitation 33

34 What we have learned and which are the main challenges to scale up? 34

35 It is an opportunity for all To complemenet the investment of the State in water and sanitation. To develop markets that generate local employment To expand the supply of financial services Sustainable and quality services for the families 35


36 There is a potential market for sanitation Potential market Values ranging from S/. 184 to 484 M Households 720,000 36
37 People s s choice depends on: A private family decision that takes into account community perceptions and in which children have a great influence on it. A complementary prior or parallel public investments in water & sewerage networks and / or on-site sanitation systems. Prioritization of sanitation investment as a result of its link with quality housing, through their peers influence. Access to affordable sanitation product that response to their needs and expectations. 37

38 Scaling up challenges to face: Self-construction and the service quality. The development of financial mechanisms for the poorest that does not put at risk the market development. Articulated information system. All partners should be able to provide right information or to refer people to the adequate provider. Sustainable guarantee and post- sale system. Educational component in use and maintenance and credit cultural is a critical issue. 38
 Interest of extractive and agro in CSR strategies Interest of extractive and")
39 Ongoing Processes Incorporation of the model in WS strategies of two regional governments Incorporation of learning in the rehabilitation WS networks project of Sedapal financed by the World Bank. Promotion of the model in the southern area of Lima through and articulated investment of the private sector (6 companies) Interest of extractive and agro in CSR strategies Interest of extractive and agro-export companies in the incorporation of the model 39


40 Thanks for your attention