Lecture Notes for Graduate Labor Economics, Daron Acemoglu
|
|
|
- Veronica McBride
- 6 years ago
- Views:
Transcription
1 Lecture Notes for Graduate Labor Economics, Daron Acemoglu
2 Contents Part 1. The Theory of Human Capital Investments 3 Chapter 1. The Basic Theory of Human Capital 5 1. General Issues 5 2. Uses of Human Capital 7 3. Sources of Human Capital Differences 9 4. A Simple Two-Period Model of Schooling Investments and Some Evidence Evidence on Human Capital Investments and Credit Constraints The Ben-Porath Model Selection and Wages The One-Factor Model Selection and Wages A Simple Version of the Roy Model 26 Chapter 2. The Theory of Training Investments General Vs. Specific Training The Becker Model of Training Market Failures Due to Contractual Problems Training in Imperfect Labor Markets The Basic Ideas Training in Imperfect Labor Markets General Equilibrium 44 Chapter 3. Tenure, Firm-Specific Skills and Incentives in Organizations The Evidence On Firm-Specific Rents and Interpretation Investment in Firm-Specific Skills 63 Chapter 4. Signaling and Externalities The Signaling Approach to Human Capital Human Capital Externalities Peer Group Effects 92 Part 2. Changes in the Wage Structure 105 Chapter 5. The Basic Trends and Interpretation Changes in the U.S. Wage Structure Interpretation 116 iii
3 iv CONTENTS Chapter 6. The Basic Theory of Skill Premia The Constant Elasticity of Substitution Framework Why Technical Change Must Have Been Skill Biased? 131 Chapter 7. Non-Technological Explanations For the Changes in the Wage Structure The Steady-Demand Hypothesis Evidence On Steady-Demand Vs. Acceleration Trade and Inequality Labor Market Institutions and Inequality 147 Chapter 8. Acceleration in Skill Bias Exogenous Acceleration Skill Bias Endogenous Acceleration Skill Bias A Puzzle: The Decline in the Wages of Low-Skill Workers Organizational Change Technical Change and Institutional Change 179 Chapter 9. Changes in Residual Inequality A single index model of residual inequality Sorting and residual inequality Churning and residual inequality A two-index model of residual inequality 190 Chapter 10. Cross-Country Inequality Trends Traditional Explanations Differential Changes in the Relative Demand for Skills 206 Part 3. Theories of Unemployment (Notes) 213 Chapter 11. Some Basic Facts About Unemployment 217 Chapter 12. Efficiency Wage Theories and Evidence The Shapiro-Stiglitz Model Evidence on Efficiency Wages Efficiency Wages, Monitoring and Corporate Structure 227 Chapter 13. Search The Basic Search Model 239
4 CONTENTS 1 These notes accompany the lectures I will give for the graduate labor course. They cover 3 related topics: (1) The theory of human capital. (2) The determination of the returns to human capital and skills, with special emphasis on the recent changes in the U.S. wage structure. (3) Determinants of unemployment, with special emphasis on the rise in European unemployment.
5 Part 1 The Theory of Human Capital Investments
6 CHAPTER 1 The Basic Theory of Human Capital 1. General Issues One of the most important ideas in labor economics is to think of the set of marketable skills of workers as a form of capital in which workers make a variety of investments. This perspective is important in understanding both investment incentives, and the structure of wages and earnings. Loosely speaking, human capital corresponds to any stock of knowledge or characteristics the worker has (either inmate or acquired) that contributes to his or her productivity. This definition is broad, and this has both advantages and disadvantages. The advantages are clear: it enables us to think of not only the years of schooling, but also of a variety of other characteristics as part of human capital investments. These include school quality, training, attitudes towards work, etc. Using this type of reasoning, we can make some progress towards understanding some of the differences in earnings across workers that are not accounted by schooling differences alone. The disadvantages are also related. At some level, we can push this notion of human capital too far, and think of every difference in remuneration that we observe in the labor market as due to human capital. For example, if I am paid less than another Ph.D., that must 5
7 6 1. THE BASIC THEORY OF HUMAN CAPITAL be because I have lower skills in some other dimension that s not being measured by my years of schooling this is the famous (or infamous) unobserved heterogeneity issue. The presumption that all pay differences are related to skills (even if these skills are unobserved to the economists in the standard data sets) is not a bad place to start when we want to impose a conceptual structure on empirical wage distributions, but there are many notable exceptions, some of which will be discussed later in the class. Here it is useful to mention three: (1) Compensating differentials: a worker may be paid less in money, because he is receiving part of his compensation in terms of other (hard-to-observe) characteristics of the job, which may include lower effort requirements, more pleasant working conditions, better amenities etc. (2) Labor market imperfections: two workers with the same human capital may be paid different wages because jobs differ in terms of their productivity and pay, and one of them ended up matching with the high productivity job, while the other hasmatchedwiththelowproductivityone. (3) Taste-based discrimination: employers may pay a lower wage to a worker because of the worker s gender or race due to their prejudices. In interpreting wage differences, and therefore in thinking of human capital investments and the incentives for investment, it is important to strike the right balance between assigning earning differences to unobserved heterogeneity, compensating wage differentials and labor market imperfections.
8 2. USES OF HUMAN CAPITAL 7 2. Uses of Human Capital The standard approach in labor economics views human capital as a set of skills/characteristics that increase a worker s productivity. This is a useful starting place, and for most practical purposes quite sufficient. Nevertheless, it may be useful to distinguish between some complementary/alternative ways of thinking of human capital. Here is a possible classification: (1) The Becker view: human capital is directly useful in the production process. More explicitly, human capital increases a worker s productivity in all tasks, though possibly differentially in different tasks, organizations, and situations. In this view, although the role of human capital in the production process may be quite complex, there is a sense in which we can think of it as represented (representable) by a unidimensional object, such as the stock of knowledge or skills, h, and this stock is directly part of the production function. (2) The Gardener view: according to this view, we should not think of human capital as unidimensional, since there are many many dimensions or types of skills. A simple version of this approach would emphasize mental vs. physical abilities as different skills. I dub this the Gardener view after the work by the social psychologist Howard Gardener, who contributed to the development of multiple-intelligences theory, in particular emphasizing how many geniuses/famous personalities were very unskilled in some other dimensions.
9 8 1. THE BASIC THEORY OF HUMAN CAPITAL (3) The Schultz/Nelson-Phelps view: human capital is viewed mostly as the capacity to adapt. Accordingtothisapproach, human capital is especially useful in dealing with disequilibrium situations, or more generally, with situations in which there is a changing environment, and workers have to adapt to this. (4) The Bowles-Gintis view: human capital is the capacity to work in organizations, obey orders, in short, adapt to life in a hierarchical/capitalist society. According to this view, the main role of schools is to instill the correct ideology and approach towards life to individuals. (5) The Spence view: observable measures of human capital are more a signal of ability than characteristics independently useful in the production process. Despite their differences, the first three views are quite similar, in that human capital will be valued in the market because it increases firms profits. This is straightforward in the Becker and Schultz views, but also similar in the Gardener view. In fact, in many applications, labor economists view of human capital would be a mixture of these three approaches. Even the Bowles-Gintis view has very similar implications. Here, firms would pay higher wages to educated workers because these workers will be more useful to the firm as they will obey orders better and will be more reliable members of the firm s hierarchy. TheSpenceviewisdifferent from the others, however, in that observable measures of human capital may be rewarded because they
10 3. SOURCES OF HUMAN CAPITAL DIFFERENCES 9 are signals about some other characteristics of workers. We will discuss different implications of these views below. 3. Sources of Human Capital Differences It is useful to think of the possible sources of human capital differences before discussing the incentives to invest in human capital: (1) Innate ability: workers can have different amounts of skills/human capital because of innate differences. Research in biology/social biology has documented that there is some component of IQ which is genetic in origin (there is a heated debate about the exact importance of this component, and some economists have also taken part in this). The relevance of this observation for labor economics is twofold: (i) there is likely to be heterogeneity in human capital even when individuals have access to the same investment opportunities and the same economic constraints; (ii) in empirical applications, we have to find a way of dealing with this source of differences in human capital, especially when it s likely to be correlated with other variables of interest. (2) Schooling: this has been the focus of much research, since it is the most easily observable component of human capital investments. It has to be borne in mind, however, that the R 2 of earnings regressions that control for schooling is relatively small, suggesting that schooling differences account for a relatively small fraction of the differences in earnings. Therefore,
11 10 1. THE BASIC THEORY OF HUMAN CAPITAL there is much more to human capital than schooling. Nevertheless, the analysis of schooling is likely to be very informative if we presume that the same forces that affect schooling investments are also likely to affect non-schooling investments. So we can infer from the patterns of schooling investments what may be happening to non-schooling investments, which are more difficult to observe. (3) School quality and non-schooling investments: a pair of identical twins who grew up in the same environment until the age of 6, and then completed the same years of schooling may nevertheless have different amounts of human capital. This could be because they attended different schools with varying qualities, but it could also be the case even if they went to the same school. In this latter case, for one reason or another, they may have chosen to make different investments in other components of their human capital (one may have worked harder, or studied especially for some subjects, or because of a variety of choices/circumstances, one may have become more assertive, better at communicating, etc.). Many economists believe that these unobserved skills are very important in understanding the structure of wages (and the changes in the structure of wages). The problem is that we do not have good data on these components of human capital. Nevertheless, we will see different ways of inferring what s happening to these dimensions of human capital below.
12 3. SOURCES OF HUMAN CAPITAL DIFFERENCES 11 (4) Training: this is the component of human capital that workers acquire after schooling, often associated with some set of skills useful for a particular industry, or useful with a particular set of technologies. At some level, training is very similar to schooling in that the worker, at least to some degree, controls how much to invest. But it is also much more complex, since it is difficult for a worker to make training investments by himself. The firm also needs to invest in the training of the workers, and often ends up bearing a large fraction of the costs of these training investments. The role of the firm is even greater, once we take into account that training has a more of a matching component in the sense that it is most useful for the worker to invest in a set of specific technologiesthatthe firm will be using in the future. So training is often a joint investment by firms and workers, complicating the analysis. (5) Pre-labor market influences: there is increasing recognition among economists that peer group effects to which individuals are exposed before they join the labor market may also affect their human capital significantly. At some level, the analysis of these pre-labor market influences may be sociological. But it also has an element of investment. For example, an altruistic parent deciding where to live is also deciding whether her offspring will be exposed to good or less good pre-labor market influences. Therefore, some of the same issues that arise in thinking about the theory of schooling and training will apply in this context too.
13 12 1. THE BASIC THEORY OF HUMAN CAPITAL 4. A Simple Two-Period Model of Schooling Investments and Some Evidence I start with the working assumption that human capital, in particular schooling, is directly productive as in the Becker view of human capital (or more generally as in the Gardener or Schultz views), and discuss some of the main theoretical and empirical issues that arise in thinking about human capital investments in this context. I will return later to discuss how high the returns education are in practice, and whether we should think of human capital as directly productive or simply as a signal. Also, for now I will think of wages as reflecting worker productivity, so I will, interchangeably, refer to schooling increasing the human capital, productivity or wages of the worker. The economy lasts two periods. In period 1 an individual (parent) works, consumes c, savess, decides whether to send their offspring to school, e =0or 1, and then dies at the end of the period. Utility of household i is given as: (4.1) ln c i +lnĉ i where ĉ is the consumption of the offspring. There is heterogeneity among children, so the cost of education, θ i varies with i. In the second period skilled individuals (those with education) receive a wage w s and an unskilled worker receives w u. First, consider the case in which there are no credit market problems,soparentscanborrowonbehalfoftheirchildren,andwhenthey do so, they pay the same interest rate, r, as the rate they would obtain
14 4. A SIMPLE TWO-PERIOD MODEL OF SCHOOLING INVESTMENTS AND SOME EVIDENCE 13 by saving. Then, the decision problem of the parent with income y i is to maximize (4.1) with respect to e i, c i and ĉ i, subject to the budget constraint: c i + ĉi 1+r w u 1+r + e i ws w u + y i e i θ i 1+r Theimportantpointtonoteisthate i does not appear in the objective function, so the education decision will be made simply to maximize the budget set of the consumer. This is the essence of the separation theorem, which says that in the presence of perfect credit markets, pure investment decisions will be independent of preferences. In particular, here parents will choose to educate their offspring if (4.2) θ i w s w u 1+r One important feature of this decision rule is that a greater skill premium as captured by w s w u will encourage schooling, while the higher interest rate, r, will discourage schooling, which is a form of investment with upfront costs and delayed benefits. In practice, this solution may be difficult to achieve for a variety of reasons. First, there is the usual list of informational/contractual problems, creating credit constraints or transaction costs that introduce a wedge between borrowing and lending rates (or even make borrowing impossible for some groups). Second, in many cases, it is the parents who make part of the investment decisions for their children, so the above solution involves parents borrowing to finance both the education expenses and also part of their own current consumption. These loans are then supposed to be paid back by their children. With the above
15 14 1. THE BASIC THEORY OF HUMAN CAPITAL setup, this arrangement works since parents are altruistic. However, if there are non-altruistic parents, this will create obvious problems. Therefore, in many situations credit problems might be important. Now imagine the same setup, but also assume that parents cannot have negative savings, which is a simple and severe form of credit market problems. This modifies the constraint set as follows c i y i e i θ i s i s i 0 ĉ i w u + e i (w s w u )+(1+r) s First note that for a parent with y i e i θ i > 0, the constraint of nonnegative savings is not binding, so the same solution as before will apply. Therefore, credit constraints will only affect parents who needed to borrow to finance their children s education. To characterize the solution to this problem, look at the utilities from investinging and not investing in education of a parent. Also to simplify the discussion let us focus on parents who would not choose positive savings, that is, those parents with y i w u. The utilities from investing and not investing in education are given, respectively, by U(e =1 y i, θ i )=ln(y i θ i )+lnw s,andu(e =0 y i, θ i )=lny i +ln w u. Comparison of these two expressions implies that parents with θ i y i ws w u w s will invest in education. It is then straightforward to verify that: (1) This condition is more restrictive than (4.2) above, since y i w u <w s.
16 5. EVIDENCE ON HUMAN CAPITAL INVESTMENTS AND CREDIT CONSTRAINTS 15 (2) As income increases, there will be more investment in education, which contrasts with the non-credit-constrained case. One interesting implication of the setup with credit constraints is that the skill premium, w s w u,stillhasapositiveeffect on human capital investments. However, in more general models with credit constraints, the conclusions may be more nuanced. For example, if w s w u increases because the unskilled wage, w u, falls, this may reduce the income level of many of the households that are marginal for the education decision, thus discourage investment in education. 5. Evidence on Human Capital Investments and Credit Constraints This finding, that income only matters for education investments in the presence of credit constraints, motivates investigations of whether there are significant differences in the educational attainment of children from different parental backgrounds as a test of the importance of credit constraints on education decisions. Of course, the empirical relationship between family income and education is interesting in its own right. A typical regression would be along the lines of schooling=controls + α log parental income which leads to positive estimates of α, consistent with credit constraints. The problem is that there are at least two alternative explanations for why we may be estimating a positive α:
17 16 1. THE BASIC THEORY OF HUMAN CAPITAL (1) Children s education may also be a consumption good, so rich parents will consume more of this good as well as other goods. If this is the case, the positive relationship between family income and education is not evidence in favor of credit constraints, since the separation theorem does not apply when the decision is not a pure investment (enters directly in the utility function). Nevertheless, the implications for labor economics are quite similar: richer parents will invest more in their children s education. (2) The second issue is more problematic. The distribution of costs and benefits of education differ across families, and are likely to be correlated with income. That is, the parameter θ i in terms of the model above will be correlated with y i,soa regression of schooling on income will capture the direct effect of different costs and benefits of education. One line of attack to deal with this problem has been to include other characteristics that could proxy for the costs and benefits of education, or attitudes toward education. The interesting finding here is that when parents education is also included in the regression, the role of income is substantially reduced. Does this mean that credit market problems are not important for education? More strongly, does it mean that parents income does not have a direct affect on education? Not necessarily. Again, there are two considerations: (1) First, parents income may affect more the quality of education, especially through the choice of the neighborhood in
18 5. EVIDENCE ON HUMAN CAPITAL INVESTMENTS AND CREDIT CONSTRAINTS 17 which the family lives. Therefore, high income parents will buy more human capital for their children, not by sending them to school for longer, but by providing them with better schooling. (2) Parental income is often measured with error, and has a significant transitory component, so parental education may be a much better proxy for permanent income than income observations in these data sets. Therefore, even when income matters for education, all its effect my load on the parental education variable. Neither problem is easy to deal with, but there are possible avenues. First, we could look at the income of children rather than their schooling as the outcome variable. To the extent that income reflects skills (broadly defined), it will incorporate unobserved dimensions of human capital, including school quality. This takes us to the literature on intergenerational mobility. The typical regression here is (5.1) log child income=controls + α log parental income Regressions of this sort were first investigated by Becker and Tomes. They found relatively small coefficients, typically in the neighborhood of 0.3 and 0.4. This means that if your parents are twice as rich as my parents, you will typically be about 30 to 40 percent as rich as I. With this degree of intergenerational dependence, differences in initial conditions will soon disappear. In fact, your children will be typically about 10 percent (α 2 percent) richer than my children. So this finding implies that we are living in a relatively egalitarian society.
19 18 1. THE BASIC THEORY OF HUMAN CAPITAL To see this more clearly, consider the following simple model: ln y t = µ + α ln y t 1 + ε t where y t istheincomeoft-th generation, and ε t is serially independent disturbance term with variance σ 2 ε. Then the long-term variance of log income is: (5.2) σ 2 y = σ2 ε 1 α 2 Using the estimate of 0.3 for α, equation (5.2) implies that the longterm variance of log income will be approximately 10 percent higher than σ 2 ε, so the long-run income distribution will basically reflect transitory shocks to dynasties incomes and skills, and not inherited differences. Returning to the interpretation of α in equation (5.1), also note that a degree of persistence in the neighborhood of 0.3 and 0.4 is not very different from what we might expect to result simply from the inheritance of IQ between parents and children, or from the children s adoption of cultural values favoring education from their parents. As a result, these estimates suggest that there is a relatively small affect of parents income on children s human capital. This work has been criticized, however, because there are certain simple biases, stacking the cards against finding large estimates of the coefficient α. First, measurement error will bias the coefficient α towards zero. Second, in typical panel data sets, we observe children at an early stage of their life cycles, where differences in earnings may be less than at later stages, again biasing α downward. Third, income mobility may be very nonlinear, with a lot of mobility among middle income
20 5. EVIDENCE ON HUMAN CAPITAL INVESTMENTS AND CREDIT CONSTRAINTS 19 families, but very little at the tails. Work by Solon and Zimmerman has dealt with the first two problems. They find that controlling for these issues increases the degree of persistence substantially to about 0.45 or even Cooper, Durlauf and Johnson, in turn, find that there is much more persistence at the top and the bottom of income distribution than at the middle. That the difference between 0.3 and 0.55 is in fact substantial can be seen by looking at the implications of using α =0.55 in (5.2). Now the long-run income distribution will be substantially more disperse than the transitory shocks. More specifically, we will have σ 2 y 1.45 σ 2 ε. To deal with the second empirical issue, one needs a source of exogenous variation in incomes to implement an IV strategy. There aren t any perfect candidates, but some imperfect ones exist. One possibility, pursued in Acemoglu and Pischke (2000), is to exploit changes in the income distribution that have taken place over the past 30 years to get a source of exogenous variation. The basic idea is that the rank of a family in income distribution is a good proxy for parental human capital, and conditional on that rank, the income gap has widened over the past 20 years. Moreover, this has happened differentially across states. One can exploit this source of variation by estimating regression of the form (5.3) s iqjt = δ q + δ j + δ t + β q ln y iqjt + ε iqjt, where q denotes income quartile, j denotes region, and t denotes time. s iqjt is education of individual i in income quartile q region j time t. With no effectofincomeoneducation,β q s should be zero. With
21 20 1. THE BASIC THEORY OF HUMAN CAPITAL credit constraints, we might expect lower quartiles to have positive β s. Acemoglu and Pischke report versions of this equation using data aggregated to income quartile, region and time cells. The estimates of β are typically positive and significant. However, the evidence does not indicate that the β s are higher for lower income quartiles, which suggests that there may be more to the relationship between income and education than simple credit constraints. 6. The Ben-Porath Model The above model was two-period, consisting of an investment and a consumption period. There are a number of interesting issues that arise when we consider longer time horizons. Some of these are highlighted by the Ben-Porath model, which I discuss briefly here. Consider an individual who lives for T periods, starts with a unidimensional measure of human capital, H 0, and can borrow and lend at the interest rate r. As noted above, the separation theorem implies that this individual will act to maximize the net present discounted value of his income using the discount rate r. Denote the stock of human capital at time t by H t. Of this, a fraction s t (a fraction s t of the individual s time) is spent for further human capital accumulation, and the rest is sold in the labor market at the price w. Sowehave (6.1) Ḣ t = I t δh t where δ is a depreciation rate of human capital (for example, because of the introduction of new technologies that make part of the existing human capital obsolete), and I t is new investment in human capital.
22
23
24 6. THE BEN-PORATH MODEL 21 The production function for new investment is (6.2) I t = B (sh t ) α D β t where D t is purchased inputs used for human capital investments (schooling, vocational courses, books, etc.), and the price of this input is assumed to be constant over time at P. The net present discounted value of (net) income is therefore Z T 0 exp ( rt)(w (1 s t ) H t PD t ) dt subject to (6.1) and (6.2). Notice that, because of the separation theorem, I did not have to specify the utility function of the individual. The solution to this problem is somewhat messy to characterize, but conceptually quite simple. There will generally be three phases of human capital accumulation: (1) s t =1, full-time schooling and no earnings. Early on it makes sense for individuals to invest all (or most) of their time in schooling since the opportunity costs of doing so (the forgone market earnings) are small. Moreover, there is a relatively long horizon left for the individual to recoup the costs. (2) s t (0, 1), there is positive earnings (no full-time schooling) but also investment in human capital. So we will see earnings grow over time in this regime. As time progresses in this phase, s t declines, since both the opportunity cost of investment increases and the time horizon shortens. This suggests that the rate of earnings growth should slow down as the individual ages.
25 22 1. THE BASIC THEORY OF HUMAN CAPITAL (3) s t =0, investment has stopped and earnings are falling due to depreciation. Once there is a short enough horizon left, it makes sense for the individual to stop investing in human capital. This is the same reasoning which suggests that it will be the younger workers that adopt new technologies, since they have a longer time horizon. This model provides a useful way of thinking of the lifecycle of the individual, which starts with full-time schooling, and then there is a period of full-time working, but still accompanied by investment in human capital and thus increasing earnings. The increase in earnings takes place at a slower rate as the individual ages, and then there is also some evidence that earnings may start falling at the very end of workers careers. The available evidence is consistent with these predictions. Nevertheless, this evidence comes from cross-sectional age-experience profiles, so it has to be interpreted with some caution. For example, the decline at the very end could be due to selection, as the higher-ability workers retire earlier. Perhaps more worrisome for this interpretation is the fact that the increase in earnings may reflectnottheaccumulation ofhumancapital due to investment, but either: (1) simple age effects; individuals become more productive as they get older. Or (2) simple experience effects: individuals become more productive as they get more experienced this is independent of whether they choose to invest or not.
26 7. SELECTION AND WAGES THE ONE-FACTOR MODEL 23 It is difficult to distinguish between the Ben-Porath model and the second explanation. But there is some evidence that could be useful to distinguish between age effects vs. experience effects (automatic or due to investment). Josh Angrist s paper on Vietnam veterans basically shows that workers who served in the Vietnam War lost the experience premium associated with the years they served in the war. Presuming that serving in the war has no productivity effects, this evidence suggests that much of the age-earnings profiles areduetoexperiencenotsimplydue to age. Nevertheless, this evidence is consistent both with direct experience effectsonworkerproductivity,and alsoabenporathtype explanation where workers are purposefully investing in their human capital while working, and experience is proxying for these investments. 7. Selection and Wages The One-Factor Model We often mention the possibility of selection bias in discussing, among other things, education, migration, labor supply, and sectoral choice decisions. The basic idea can be seen by considering a situation whicheachworkerhasj>1choices. The unobserved characteristics of those making different choices will differ, and this difference will have an effect on the outcomes of interest, such as wages, over and above the direct effect of the choices themselves. It is useful to distinguish between selection based on a single factor, which is often referred to as the one-factor model, and multidimensional selection, often referred to as the Roy model.
27 24 1. THE BASIC THEORY OF HUMAN CAPITAL Suppose that individuals are distinguished by an unobserved type, z, which is assumed to be distributed uniformly between 0 and 1. Individuals decide whether to obtain education, which costs c. The wage of an individual of type z when he has no education is w 0 (z) =z and when he obtains education, it is (7.1) w 1 (z) =α 0 + α 1 z, where α 0 > 0 and α 1 > 1. α 0 is the main effect of education on earnings, which applies irrespective of ability, whereas α 1 interacts with ability. The assumption that α 1 > 1 implies that education is complementary to ability, and will ensure that high-ability individuals are positively selected into education. Individuals make their schooling choices to maximize income. It is straightforward to see that all individuals of type z z will obtain education, where z c α 0 α 1 1, which, to make the analysis interesting, I assume lies between 0 and 1. The diagram gives the wage distribution in this economy. Now let us look at mean wages by education group. By standard arguments, these are It is clear that w 1 w 0 w 0 = c α 0 2(α 1 1) w 1 = α 0 + α 1 α 1 1+c α 0 2(α 1 1) > α 0, so the wage gap between educated and uneducated groups is greater than the main effect of education in
28
29 7. SELECTION AND WAGES THE ONE-FACTOR MODEL 25 equation (7.1) since α 1 1 > 0. Thisreflects two components. First, the return to education is not α 0, but it is α 0 + α 1 z for individual z. Therefore, for a group of mean ability z, the return to education is w 1 ( z) w 0 ( z) =α 0 +(α 1 1) z, which we can simply think of as the return to education evaluated at themeanabilityofthegroup. But there is one more component in w 1 w 0, which results from the fact that the average ability of the two groups is not the same, and the earning differences resulting from this ability gap are being counted as part of the returns to education. In fact, since α 1 1 > 0, high-ability individuals are selected into education increasing the wage differential. To see this, rewrite the observed wage differential as follows c α0 w 1 w 0 = α 0 +(α 1 1) + α 1 2(α 1 1) 2 Here, the first two terms give the return to education evaluated at the mean ability of the uneducated group. This would be the answer to the counter-factual question of how much the earnings of the uneducated group would increase if they were to obtain education. The third term is the additional effect that results from the fact that the two groups do not have the same ability level. It is therefore the selection effect. Alternatively, we could have written α1 1+c α 0 w 1 w 0 = α 0 +(α 1 1) + 1 2(α 1 1) 2, where now the first two terms give the return to education evaluated at the mean ability of the educated group, which is greater than the return
30 26 1. THE BASIC THEORY OF HUMAN CAPITAL to education evaluated at the mean ability level of the uneducated group. So the selection effect is somewhat smaller, but still positive. This example illustrates how looking at observed averages, without taking selection into account, may give misleading results, and also provides a simple example of how to think of decisions in the presence of this type of heterogeneity. It is also interesting to note that if α 1 < 1, we would have negative selection into education, and observed returns to education would be less than the true returns. The case of α 1 < 1 appears less plausible, but may arise if high ability individuals do not need to obtain education to perform certain tasks.
31 CHAPTER 2 The Theory of Training Investments 1. General Vs. Specific Training In the Ben-Porath model, an individual continues to invest in his human capital after he starts employment. We normally think of such investments as training, provided either by the firm itself on-the-job, or acquired by the worker (and the firm) through vocational training programs. This approach views training just as schooling, which is perhaps too blackbox for most purposes. More specifically, two complications that arise in thinking about training are: (1) Most of the skills that the worker acquires via training will not be as widely applicable as schooling. As an example, consider a worker who learns how to use a printing machine. This will only be useful in the printing industry, and perhaps in some other specialized firms; in this case, the worker will be able to use his skills only if he stays within the same industry. Next, consider the example of a worker who learns how to use a variety of machines, and the current employer is the only firm that uses this exact variety; in this case, if the worker changes employer, some of his skills will become redundant. Or more extreme, consider a worker who learns how to get along with 29
32 30 2. THE THEORY OF TRAINING INVESTMENTS his/her colleagues or with the customers of its employer. These skills are even more specific, and will become practically useless if he changes employer. (2) A large part of the costs of training consist of forgone production and other costs borne directly by the employer. So at the very least, training investments have to be thought as joint investments by the firm and the worker, and in many instances, they may correspond to the firm s decisions more than to that of the worker. The first consideration motivates a particular distinction between two types of human capital in the context of training: (1) Firm-specific training: this provides a worker with firm-specific skills, that is, skills that will increase his or her productivity only with the current employer. (2) General training: this type of training will contribute to the worker s general human capital, increasing his productivity with a range of employers. Naturally, in practice actual training programs could (and often do) provide a combination of firm-specific and general skills. The second consideration above motivates models in which firms have an important say in whether there will be training or not. In the extreme case where the costs are borne naturally by the firm (for example, because the process of training reduces production), we can think of the situation in which the firm decides whether there will be training or not.
33 2. THE BECKER MODEL OF TRAINING The Becker Model of Training Let us start with investments in general skills. Consider the following stylized model: At time t =0, there is an initial production of y 0, and also the firm decides the level of training τ, incurring the cost c (τ). Let us assume that c (0) = 0, c 0 (0) = 0, c 0 ( ) 0 and c 00 ( ) > 0. The second assumption here ensures that it s always socially beneficial to have some amount of positive training. At time t =1/2, thefirm makes a wage offer w to the worker, and other firms also compete for the worker s labor. The worker decides whether to quit and work for another firm. Let us assume that there are many identical firms who can use the generalskillsoftheworker,andtheworkerdoesnotincurany cost in the process of changing jobs. This assumption makes the labor market essentially competitive. At time t =1, there is the second and final period of production, where output is equal to y 1 + α (τ), withα (0) = 0, α 0 ( ) > 0 and α 00 ( ) < 0. For simplicity, let us ignore discounting. Before Becker analyzed this problem, the general conclusion, for example conjectured by Pigou, was that there would be underinvestment in training. The reasoning went along the following lines. Suppose the firm invests some amount τ > 0. For this to be profitable for the firm, at time t =1,itneedstopaytheworkeratmostawageof w 1 <y 1 + α (τ) c (τ) to recoup its costs. But suppose that the firm
34 32 2. THE THEORY OF TRAINING INVESTMENTS was offering such a wage. Could this be an equilibrium? No, because there are other firms who have access to exactly the same technology, they would be willing to bid a wage of w 1 + ε for this worker s labor services. Since there are no costs of changing employer, for ε small enough such that w 1 + ε <y 1 + α (τ), afirm offering w 1 + ε would both attract the worker by offering this higher wage and also make positive profits. This reasoning implies that in any competitive labor market, we must have w 1 = y 1 + α (τ). But then, the firm cannot recoup any of its costs and would like to choose τ =0. Despite the fact that a social planner would choose a positive level of training τ such that c 0 (τ )=α 0 (τ ), the pre-becker view was that this economy would fail to invest in training (that τ is strictly positive immediately follows from the fact that c 0 (0) = 0 and α 0 (0) > 0). The mistake in this reasoning was that it did not take into account the worker s incentives to invest in his own training. In effect, the firm does not get any of the returns from training because the worker is receiving all of them. In other words, the worker is the full residual claimant of the increase in his own productivity, and in the competitive equilibrium of this economy without any credit market or contractual frictions, he would have the right incentives to invest in his training. Let us analyze this equilibrium now. As is the case in all games of this sort, we are interested in the subgame perfect equilibria. So we have to solve the game by backward induction. First note that at t =1, the worker will be paid w 1 = y 1 +α (τ). Nextrecallthatτ is the efficient level of training given by c 0 (τ )=α 0 (τ ). Then in the unique subgame perfect equilibrium, in the first period the firm will offer the
35 2. THE BECKER MODEL OF TRAINING 33 following package: training of τ and a wage of w 0 = y 0 c (τ ). Then, in the second period the worker will receive the wage of w 1 = y 1 +α (τ ) either from the current firm or from another firm. To see why no other allocation could be an equilibrium, suppose that the firm offered (τ,w 0 ), such that τ 6= τ. For the firm to break even we need that w 0 y 0 c (τ), butbythedefinition of τ,wehave y 0 c (τ )+y 1 + α (τ ) >y 0 c (τ)+y 1 + α (τ) w 0 + y 1 + α (τ) So the deviation of offering (τ,y 0 c (τ ) ε) for ε sufficiently small would attract the worker and make positive profits. Thus, the unique equilibrium is the one in which the firm offers training τ. Therefore, in this economy the efficient level of training will be achieved with firms bearing none of the cost of training, and workers financing training by taking a wage cut in the first period of employment (i.e, a wage w 0 <y 0 ). There are a range of examples for which this model appears to provide a good description. These include some of the historical apprenticeship programs where young individuals worked for very low wages and then graduated to become master craftsmen; pilots who work for the Navy or the Air Force for low wages, and then obtain much higher wages working for private sector airlines; securities brokers, often highly qualified individuals with MBA degrees, working at a pay level close to the minimum wage until they receive their professional certification; or even academics taking an assistant professor job at Harvard despite the higher salaries in other departments.
36 34 2. THE THEORY OF TRAINING INVESTMENTS 3. Market Failures Due to Contractual Problems The above result was achieved because firms could commit to a wage-training contract. In other words, the firm could make a credible commitment to providing training in the amount of τ. Such commitments are in general difficult, since outsiders cannot observe the exact nature of the training activities taking place inside the firm. For example, the firm could hire workers at a low wage pretending to offer them training, and then employ them as cheap labor. To capture these issues let us make the timing of events regarding the provision of training somewhat more explicit. At time t = 1/2, thefirm makes a training-wage contract offer (τ 0,w 0 ). Workers accept offers from firms. At time t =0, there is an initial production of y 0,thefirm pays w 0, and also unilaterally decides the level of training τ, which could be different from the promised level of training τ 0. At time t =1/2, wageoffers are made, and the worker decides whether to quit and work for another firm. At time t =1, there is the second and final period of production, where output is equal to y 1 + α (τ). Now the subgame perfect equilibrium can be characterized as follows: at time t =1,aworkeroftrainingτ will receive w 1 = y 1 + α (τ). Realizing this, at time t =0,thefirm would offer training τ =0, irrespective of its contract promise. Anticipating this wage offer, the worker will only accept a contract offer of the form (τ 0,w 0 ), such that w 0 y 0,andτ doesnotmatter,sincetheworkerknowsthatthefirm is
37 4. TRAINING IN IMPERFECT LABOR MARKETS THE BASIC IDEAS 35 not committed to this promise. As a result, we are back to the outcome conjectured by Pigou, with no training investment by the firm. A similar conclusion would also be reached if the firm could write a binding contract about training, but the worker were subject to credit constraints and c (τ ) >y 0, so the worker cannot take enough of a wage cut to finance his training. In the extreme case where y 0 =0,weare again back to the Pigou outcome, where there is no training investment, despite the fact that it is socially optimal to invest in skills. 4. Training in Imperfect Labor Markets The Basic Ideas 4.1. Motivation. The general conclusion of both the Becker model with perfect (credit and labor) markets and the model with incomplete contracts (or severe credit constraints) is that there will be no firmsponsored investment in general training. This conclusion follows from the common assumption of these two models, that the labor market is competitive, so the firm will never be able to recoup its training expenditures in general skills later during the employment relationship. Is this a reasonable prediction? The answer appears to be no. There are many instances in which firms bear a significant fraction (sometimes all) of the costs of general training investments. The first piece of evidence comes from the German apprenticeship system. Apprenticeship training in Germany is largely general. Firms training apprentices have to follow a prescribed curriculum, and apprenticestakearigorousoutsideexamintheirtradeattheendofthe apprenticeship. The industry or crafts chambers certify whether firms fulfill the requirements to train apprentices adequately, while works
38 36 2. THE THEORY OF TRAINING INVESTMENTS councils in the firms monitor the training and resolve grievances. At least in certain technical and business occupations, the training curricula limit the firms choices over the training content fairly severely. Estimates of the net cost of apprenticeship programs to employers in Germany indicate that firms bear a significant financial burden associated with these training investments. The net costs of apprenticeship trainingmaybeashighasdm6,000perworker. Another interesting example comes from the recent growth sector of the US, the temporary help industry. The temporary help firms provide workers to various employers on short-term contracts, and receive a fraction of the workers wages as commission. Although blue-collar and professional temporary workers are becoming increasingly common, the majority of temporary workers are in clerical and secretarial jobs. These occupations require some basic computer, typing and other clerical skills, which temporary help firms often provide before the worker is assigned to an employer. Workers are under no contractual obligation to the temporary help firm after this training program. Most large temporary help firms offer such training to all willing individuals. As training prepares the workers for a range of assignments, it is almost completely general. Although workers taking part in the training programs do not get paid, all the monetary costs of training are borne by the temporary help firms, giving us a clear example of firm-sponsored general training. This was first noted by Krueger and is discussed in more detail by David Autor. Other evidence is not as clear-cut, but suggests that firm-sponsored investments in general skills are widespread. A number of studies have
39 4. TRAINING IN IMPERFECT LABOR MARKETS THE BASIC IDEAS 37 investigated whether workers who take part in general training programs pay for the costs by taking lower wages. The majority of these studies do not find lower wages for workers in training programs, and even when wages are lower, the amounts typically appear too small to compensate firms for the costs. Although this pattern can be explained within the paradigm of Becker s theory by arguing that workers selected for training were more skilled in unobserved dimensions, it is broadly supportive of widespread firm-sponsored-training. There are also many examples of firms that send their employees to college, MBA or literacy programs, and problem solving courses, and pay for the expenses while the wages of workers who take up these benefits are not reduced. In addition, many large companies, such as consulting firms, offer training programs to college graduates involving general skills. These employers typically pay substantial salaries and bear the full monetary costs of training, even during periods of full-time classroom training. How do we make sense of these firm-sponsored investments in general training? I will now illustrate how in frictional labor markets, firms may also be willing to make investments in the general skills of their employees A Basic Framework. Consider the following two-period model. In period 1, the worker and/or the employer choose how much to invest in the worker s general human capital, τ. There is no production in the first period. In period 2, the worker either stays with the firm and
40 38 2. THE THEORY OF TRAINING INVESTMENTS produces output y = f(τ), wheref(τ) is a strictly increasing and concave function. The worker is also paid a wage rate, w(τ) as a function of his skill level (training) τ, or he quits and obtains an outside wage. Thecostofacquiringτ units of skill is again c(τ), which is strictly increasing and convex, and c 0 (0) = 0. There is no discounting, and all agents are risk-neutral. Assume that all training is technologically general in the sense that f(τ) is the same in all firms. If a worker leaves his original firm he will earn v(τ) in the outside labor market. Suppose v(τ) <f(τ). Thatis,despitethatfactthatτ is general human capital, when the worker separates from the firm, he willgetalowerwagethanhismarginalproductinthecurrentfirm. The fact that v(τ) <f(τ) implies that there is a surplus that the firm and the worker can share when they are together. Let us suppose that this surplus will be divided by Nash bargaining, which gives the wage of the worker as: (4.1) w(τ) =v(τ)+β [f(τ) v(τ)], where β [0, 1] is the bargaining power of the worker. An important point to note is that the equilibrium wage rate w(τ) is independent of c(τ): the level of training is chosen first, and then the worker and the firm bargain over the wage rate. At this point the training costs are already sunk, do not feature in the bargaining calculations (bygones are bygones)
41 4. TRAINING IN IMPERFECT LABOR MARKETS THE BASIC IDEAS 39 Assume that τ is determined by the investments of the firm and the worker, who independently choose their contribution, c w and c f,andτ is given by c(τ) =c w + c f. Assume that $1 investment by the worker costs $p where p 1. When p =1, the worker has access to perfect credit markets and when p, the worker is severely constrained and cannot invest at all. More explicitly, the timing of events are: The worker and the firm simultaneously decide their contributions to training expenses, c w and c f. The worker receives an amount of training τ such that c(τ) =c w + c f. The firm and the worker bargain over the wage for the second period, w (τ), where the threat point of the worker is the outside wage, v (τ), and the threat point of the firm is not to produce. Production takes place. Given this setup, the contributions to training expenses c w and c f will be determined noncooperatively. More specifically, the firm chooses c f to maximize profits: π(τ) =f(τ) w(τ) c f =(1 β)[f(τ) v(τ)] c f. subject to c(τ) =c w + c f. The worker chooses c w to maximize utility: u(τ) =w(τ) pc w = βf(τ)+(1 β)v(τ) pc f subject to the same constraint. The first order conditions are:
42 40 2. THE THEORY OF TRAINING INVESTMENTS (4.2) (1 β)[f 0 (τ) v 0 (τ)] c 0 (τ) =0 if c f > 0 (4.3) v 0 (τ)+β[f 0 (τ) v 0 (τ)] pc 0 (τ) =0 if c w > 0 Inspection of these equations implies that generically, one of them will hold as a strict inequality, therefore, one of the parties will bear the full cost of training. The result of no firm-sponsored investment in general training by the firm obtains when f(τ) =v(τ), which is the case of perfectly competitive labor markets. (4.2) then implies that c f =0,sowhenworkers receive their full marginal product in the outside labor market, the firm will never pay for training. Moreover, as p, so that the worker is severely credit constrained, there will be no investment in training. In contrast, suppose there are labor market imperfections, so that the outside wage is less than the productivity of the worker, that is v (τ) <f(τ). It is enough to ensure firm-sponsored investments in training? The answer is no. To see this, first consider the case with no wage compression, that is the case in which a marginal increase in skills is valued appropriately in the outside market. Mathematically this corresponds to v 0 (τ) =f 0 (τ) for all τ. Substituting for this in the first-order condition of the firm,(4.2),weimmediatelyfind that if c f > 0, thenc 0 (τ) =0. So in other words, there will be no firm contribution to training expenditures. Next consider the case in which there is wage compression, i.e., v 0 (τ) <f 0 (τ). Now it is clear that the firm may be willing to invest
43 4. TRAINING IN IMPERFECT LABOR MARKETS THE BASIC IDEAS 41 in the general training of the worker. The simplest way to see this isagaintotakethecaseofseverecreditconstraintsontheworker, that is, p, so that the worker cannot invest in training. Then, v 0 (0) <f 0 (0) is sufficient to induce the firm to invest in training. This shows the importance of wage compression for firm-sponsored training. The intuition is simple: wage compression in the outside market translates into wage compression inside the firm, i.e., it implies w 0 (τ) <f 0 (τ). Asaresult,thefirm makes greater profits from a more skilled (trained) worker, and has an incentive to increase the skills of the worker. To clarify this point further, the figure draws the productivity, f(τ), and wage, w(τ), of the worker. The gap between these two curves is the profit ofthefirm. When f 0 (τ) =w 0 (τ), thisprofit is independent of the skill level of the worker, and the firm has no interest in increasing the worker s skill. A competitive labor market, f(τ) =v(τ), implies this case. In contrast, if f 0 (τ) >w 0 (τ), which is implied by f 0 (τ) >v 0 (τ), then the firmmakesmoreprofits from more skilled workers, and is willing to invest in the general skills of its employees. Let τ w be the level of training that satisfies (4.3) as equality, and τ f be the solution to (4.2). Then, it is clear that if τ w > τ f,theworker will bear all the cost of training. And if τ f > τ w,thenthefirm will bear all the cost of training (despite the fact that the worker may have access to perfect capital markets, i.e. p =1).
44 42 2. THE THEORY OF TRAINING INVESTMENTS f(τ) Figure 1 f(τ) w (τ) = f(τ) w(τ) = f(τ) (τ) Firm-sponsored training No firm-sponsored training τ To derive the implications of changes in the skill premium on training, let v(τ) =af(τ) b. Adecreaseina is equivalent to a decrease in the price of skill in the outside market, and would also tilt the wage function inside the firm, w(τ), decreasing the relative wages of more skilled workers because of bargaining between the firmandinthe worker, with the outside wage v (τ) as the threat point of the worker. Starting from a =1and p<, apointatwhichtheworkermakesall investments, a decrease in a leads to less investment in training from (4.3). This is simply an application of the Becker reasoning; without any wage compression, the worker is the one receiving all the benefits and bearing all the costs, and a decline in the returns to training will reduce his investments. As a declines further, we will eventually reach the point where τ w = τ f. Now the firm starts paying for training, and a further decrease
45 4. TRAINING IN IMPERFECT LABOR MARKETS THE BASIC IDEAS 43 in a increases investment in general training (from (4.2)). Therefore, there is a U-shaped relation between the skill premium and training, so starting from a compressed wage structure, a further decrease in the skill premium may increase training. Holding f(τ) constant a tilting up of the wage schedule, w(τ), reduces the profits from more skilled workers, and the firm has less interest in investing in skills. f(τ) Figure 2 f(τ) v(τ) = f(τ) Minimum wage τ τ Changes in labor market institutions, such as minimum wages and unionization, will therefore affect the amount of training in this economy. To see the impact of a minimum wage, consider the next figure, and start with a situation where v(τ) =f(τ) and p so that the worker cannot invest in training, and there will be no training. Now impose a minimum wage as drawn in the figure. This distorts the wage structure and encourages the firm to invest in skills up to τ,aslong
46 44 2. THE THEORY OF TRAINING INVESTMENTS as c(τ ) is not too high. This is because the firm makes higher profits from workers with skills τ than workers with skills τ =0. This is an interesting comparative static result, since the standard Becker model with competitive labor markets implies that minimum wages should always reduce training. The reason for this is straightforward. Workers take wage cuts to finance their general skills training, and minimum wages will prevent these wage cuts, thus reducing training. Therefore, an empirical investigation of the relationship between minimum wage changes and worker training is a way of finding out whether the Becker channel or the wage-compression channel is more important. Empirical evidence suggests that higher minimum wages are typically associated with more training for low-skill workers (though this relationship is not always statistically significant). 5. Training in Imperfect Labor Markets General Equilibrium The above analysis showed how in imperfect labor market firms will find it profitable to invest in the general skills of their employees as long as the equilibrium wage structure is compressed. The equilibrium wage structure will be compressed, in turn, when the outside wage structure, v (τ), is compressed that is, when v 0 (τ) < f 0 (τ). The analysis was partial equilibrium in that this outside wage structure was taken as given. There are many reasons why in frictional labor markets we may expect this outside wage structure to be compressed. These include adverse selection, bargaining, and efficiency wages, as
47
48 5. TRAINING IN IMPERFECT LABOR MARKETS GENERAL EQUILIBRIUM45 well as complementarity between general and specific skills. Here I will discuss how adverse selection leads to wage compression The Basic Model of Adverse Selection and Training. This is a simplifiedversionofthemodelinacemogluandpischke (1998). Suppose that fraction p of workers are high ability, and have productivity α (τ) in the second period if they receive training τ in the first period. The remaining 1 p are low ability and produce nothing (in terms of the above model, I am setting y =0). No one knows the worker s ability in the firstperiod,butinthe second period, the current employer learns this ability. Firms never observe the ability of the workers they have not employed, so outsiders will have to form beliefs about the worker s ability. The exact timing of events is as follows: Firmsmakewageoffers to workers. At this point, worker ability is unknown. Firms make training decisions, τ. Worker ability is revealed to current employer and to the worker. Employers make second period wage offers to workers. Workers decide whether to quit. Outside firms compete for workers in the secondhand labor market. At this point, these firms observe neither worker ability nor whether the worker has quit or was laid off. Production takes place. Since outside firms do not know worker ability when they make their bids, this is a (dynamic) game of incomplete information. So
49 46 2. THE THEORY OF TRAINING INVESTMENTS we will look for a Perfect Bayesian Equilibrium of this game, which again involves backward induction, but also makes use of Bayes rule to determine beliefs. First, note that all workers will leave their current employer if outside wages are higher. In addition, a fraction λ of workers, irrespective of ability, realize that they form a bad match with the current employer, and leave whatever the wage is. The important assumption is that firms in the outside market observe neither worker ability nor whether a worker has quit or has been laid off. However, worker training is publicly observed. These assumptions ensure that in the second period each worker obtains expected productivity conditional on his training. That is, his wage will be independent of his own productivity, but will depend on the average productivity of the workers who are in the secondhand labor market. τ, is By Bayes s rule, the expected productivity of a worker of training (5.1) v (τ) = λpα (τ) λp +(1 p) To see why this expression applies, note that all low ability workers will leave their initial employer, who will at most pay a wage of 0 (since this is the productivity of a low ability worker), and as we will see, outside wages are positive, low ability workers will quit (therefore, the offer of a wage of 0 is equivalent to a layoff). Those workers make up afraction1 p of the total workforce. In addition, of the high ability workers who make up a fraction p of the total workforce, a fraction λ of
50 5. TRAINING IN IMPERFECT LABOR MARKETS GENERAL EQUILIBRIUM47 them will also leave. Therefore, the total size of the secondhand labor market is λp +(1 p), which is the denominator of (5.1). Of those, the low ability ones produce nothing, whereas the λp high ability ones produce α (τ), which explains this expression. Anticipating this outside wage, the initial employer has to pay each high ability worker v (τ) to keep him. This observation, combined with (5.1), immediately implies that there is wage compression in this world, in the sense that v 0 (τ) = λpα0 (τ) λp +(1 p) < α0 (τ), so the adverse selection problem introduces wage compression, and via this channel, will lead to firm-sponsored training. To analyze this issue more carefully, consider the previous stage of the game. Now firm profits as a function of the training choice can be written as π (τ) =(1 λ) p [α (τ) v (τ)] c (τ). The first-order condition for the firm is (5.2) π 0 (τ) = (1 λ) p [α 0 (τ) v 0 (τ)] c 0 (τ) =0 = (1 λ) p (1 p) α0 (τ) c 0 (τ) =0 λp +(1 p) There are a number of noteworthy features: (1) c 0 (0) = 0 is sufficienttoensurethatthereisfirm-sponsored training (that is, the solution to (5.2) is interior). (2) There is underinvestment in training relative to the first-best which would have involved pα 0 (τ) =c 0 (τ) (notice that the first-best already takes into account that only a fraction p of
51 48 2. THE THEORY OF TRAINING INVESTMENTS the workers will benefit fromtraining). Thisisbecauseoftwo reasons: first, a fraction λ of the high ability workers quit, and the firm does not get any profits from them. Second, even for the workers who stay, the firm is forced to pay them a higher wage, because they have an outside option that improves with their training, i.e., v 0 (τ) > 0. This reduces profits from training, since the firm has to pay higher wages to keep the trained workers. (3) The firm has monopsony power over the workers, enabling it to recover the costs of training. In particular, high ability workers who produce α (τ) are paid v (τ) < α (τ). (4) Monopsony power is not enough by itself. Wage compression is also essential for this result. To see this, suppose that we impose there is no wage compression, i.e., v 0 (τ) =α 0 (τ), then inspection of the first line of (5.2) immediately implies that there will be zero training, τ =0. (5) But wage compression is also not automatic; it is a consequence of some of the assumptions in the model. Let us modify the model so that high ability workers produce η + α (τ) in the second period, while low ability workers produce α (τ). This modification implies that training and ability are no longer complements. Both types of workers get exactly the same marginal increase in productivity (this contrasts with the previous specification where only high ability workers benefited from training, hence training and ability were highly complementary). Then, it is straightforward to check that we will
52 5. TRAINING IN IMPERFECT LABOR MARKETS GENERAL EQUILIBRIUM49 have λpη v (τ) = λp +(1 p) + α (τ), and hence v 0 (τ) =α 0 (τ). Thus no wage compression, and firm-sponsored training. Intuitively, the complementarity between ability and training induces wage compression, because the training of high ability workers who are contemplating whether to leave the firm or not is judged by the market as the training of a relatively low ability worker (since low ability workers are overrepresented in the secondhand labor market). Therefore, the marginal increase in a (high ability) worker s productivity due to training is valued less in the outside market, which views this worker, on average, as low ability. Hence the firm does not have to pay as much for the marginal increase in the productivity of a high ability worker, and makes greater profits from more trained high-ability workers. (6) What happens if π (τ) =(1 λ) p [α (τ) v (τ)] c (τ) > 0, that is, if firms are making positive profits at the level of training that they choose in equilibrium? If there is free entry at time t =0,this implies that firms will compete for workers, since hiring a worker now guarantees positive profits in later periods. As a result, firms will have to pay a positive wage at time t =0, precisely equal to W = π (τ) as a result of this competition. This is because once a worker accepts a job with a firm, the firm has enough monopsony power at time t =1 to make positive profits. Competition then implies that these profits have to be transferred to the worker at time t =0.The
53 50 2. THE THEORY OF TRAINING INVESTMENTS interesting result is that not only do firms pay for training, but they may also pay workers extra in order to attract them Evidence. How can this model be tested? One way is to look for evidence of this type of whether selection among highly trained workers. The fact that employers know more about their current employees may be a particularly good assumption for young workers, so a good area of application would be for apprentices in Germany. According to the model, workers who quit or are laid off should get lower wages than those who stay in their jobs, which is a prediction that follows simply from adverse selection (and Gibbons and Katz tested in the U.S. labor market for all workers by comparing laid-off workers to those who lost their jobs as a result of plant closings). The more interesting implication here is that if the worker is separated from his firm for an exogenous reason that is clearly observable to the market, he should not be punished by the secondhand labor market. In fact, he s freed from the monopsony power of the firm, and he may get even higher wages than stayers (who are on average higher ability, though subject to the monopsony power of their employer). To see this, note that a worker who is exogenously separated from his firmwillgettowageofpα (τ) whereas stayers, who are still subject of the monopsony power of their employer, obtain the wage of v (τ) as given by (5.1), which could be less than pα (τ). In the German context, workers who leave their apprenticeship firm to serve in the military provide a potential group of such exogenous separators. Interestingly, the evidence suggests that although these military quitters
54 5. TRAINING IN IMPERFECT LABOR MARKETS GENERAL EQUILIBRIUM51 are on average lower ability than those who stay in the apprenticeship firm, the military quitters receive higher wages Adverse selection and training in the temporary help industry. An alternative place to look for evidence is the temporary help industry in the U.S. Autor (2001) develops an extended version of this model, which also incorporates self-selection by workers, for the temporary help industry. Autor modifies the above model in four respects to apply it to the U.S. temporary help industry. These are: (1) The model now lasts for three periods, and in the last period, all workers receive their full marginal products. This is meant to proxy the fact that at some point temporary-help workers may be hired into permanent jobs where their renumeration may better reflect their productivity. (2) Workers have different beliefs about the probability that they are high ability. Some workers receive a signal which makes them believe that they are high ability with probability p, while others believe that they are high ability with probability p 0 <p. This assumption will allow self-selection among workers between training and no-training firms. (3) Worker ability is only learned via training. Firms that do not offer training will not have superior information relative to the market. (4) The degree of competitiveness in the market is modeled by assuming that firms need to make certain level of profits π, and a higher π corresponds to a less competitive market. In
55
56 52 2. THE THEORY OF TRAINING INVESTMENTS contrast to the baseline version of the above model, it is also assumed that firms can offer different training levels and commit to them, so firmscanusetraininglevelsasamethodof attracting workers. Autor looks for a separating /self-selection equilibrium in which p 0 workers select into no-training firms, whereas p workers go to training firms. In this context, self-selection equilibrium is one in which workers with different abilities (different beliefs) choose to accept jobs in different firms, because ability is rewarded differentially in different firms. This makes sense since training and ability are complements as before. Since firms that do not train their employees do not learn about employability, there is no adverse selection for workers who quit from no-training firms. Therefore, the second-period wage of workers who quit from no-training firms will be simply v (0) = p 0 α (0) In contrast, the secondhand labor market wage of workers from training firms will be given by v (τ) from (5.1) above. In the third period, all workers will receive their full marginal product, hence in expectation this is p 0 α (0) for workers who got the nontraining firms, and pα (τ) forworkerswhogototrainingfirms. In the second-period, all workers receive their outside option in the secondhand market, so v (0) for workers in no-training firms, and v (τ) for workers in training firms. The condition for a self-selection equilibrium is p (α (τ) α (0)) >v(0) v (τ) >p 0 (α (τ) α (0)),
57 5. TRAINING IN IMPERFECT LABOR MARKETS GENERAL EQUILIBRIUM53 that is, expected gain of third-period wages for high-belief workers should outweigh the loss (if any) in terms of second period wages (since there are no costs in the first-period by the assumption that there are no wages in the first-period). Otherwise, there could not be a separating equilibrium. This immediately implies that if v (0) v (τ) < 0, that is, if workers with training receive higher wages in the second period, then there cannot be a self-selection equilibrium all workers, irrespective of their beliefs, would like to take a job with training firms. Therefore, the adverse selection problem needs to be strong enough to ensure that v (0) v (τ) > 0. Thisisthefirst implication that Autor investigates empirically using data about the wages of temporary help workers in firms that offer free training compared to the wages of workers in firms that do not offer training. He findsthatthisisgenerallythecase. The second implication concerns the impact of greater competition on training. To see this more formally, simply return to the basic model, and look at the profits of a typical training firm. These are π (τ) = (1 λ) p (1 p) α (τ) λp +(1 p) c (τ) so if π (τ) =π and π increases exogenously, and note that in equilibrium we could never have π 0 (τ) > 0, since then the firm can increase both its profits and attract more workers by simply increasing training. But if π 0 (τ) 0, then a decline in π, that is, increasing competitiveness, will lead to higher training.
58
59
60
61 54 2. THE THEORY OF TRAINING INVESTMENTS Autor investigates this empirically using differences in temporary help firms concentration across MSAs, and finds that in areas where there is greater concentration, training is lower Mobility, training and wages. The interaction between training and adverse selection in the labor market also provides a different perspective in thinking about mobility patterns. change the above model so that λ =0, but workers now quit if w (τ) v (τ) < θ To see this, where θ is a worker-specific draw from a uniform distribution over [0, 1]. θ, which can be interpreted as the disutility of work in the current job, is the worker s private information. This implies that the fraction of high ability workers who quit their initial employer will be so the outside wage is now (5.3) v (τ) = 1 w (τ)+v (τ), p [1 w (τ)+v (τ)] α (τ) p [1 w (τ)+v (τ)] + (1 p) Note that if v (τ) is high, many workers leave their employer because outside wages in the secondhand market are high. But also the right hand side of (5.3) is increasing in the fraction of quitters, [1 w (τ)+v (τ)], so v (τ) will increase further. This reflects the fact that with a higher quit rate, the secondhand market is not as adversely selected (it has a better composition). This implies that there can be multiple equilibria in this economy. One equilibrium with a high quit rate, high wages for workers changing jobs, i.e. high v (τ), but low training. Another equilibrium with low
62 5. TRAINING IN IMPERFECT LABOR MARKETS GENERAL EQUILIBRIUM55 mobility, low wages for job changers, and high training. This seems to give a stylistic description of the differences between the U.S. and German labor markets. In Germany, the turnover rate is much lower than in the U.S., and also there is much more training. Also, in Germany workers who change jobs are much more severely penalized (on average, in Germany such workers experience a substantial wage loss, while they experience a wage gain in the U.S.). Which equilibrium is better? There is no unambiguous answer to this question. While the low-turnover equilibrium achieves higher training, it does worse in terms of matching workers to jobs, in that workers often get stuck in jobs that they do not like. In terms of the above model, we can see this by looking at the average disutility of work that workers receive (i.e., the average θ s).
63 CHAPTER 3 Tenure, Firm-Specific Skills and Incentives in Organizations The analysis so far has focused on general skills, acquired in school or by investments in general training. Most labor economists also believe that there are important firm-specific skills, acquired either thanks to firm-specific experience, or by investment in firm-specific skills, or via matching. If such firm-specific skills are important we should observe worker productivity and wages to increase with tenure that is, a worker who has stayed longer in a given job should earn more than a comparable worker (with the same schooling and experience) who has less tenure. 1. TheEvidenceOnFirm-Specific Rents and Interpretation 1.1. Some Evidence. There are two conceptual issues that arise in thinking about the relationship between wages and tenure, as well as a host of econometric issues. The conceptual issues are as follows: (1) We can imagine a world in which firm-specific skills are important, but there may be no relationship between tenure and wages. This is because, as we will see in more detail below, productivity increases due to firm-specific skills do not necessarily translate into wage increases. The usual reasoning for why high worker productivity translates into higher 57
64 583. TENURE, FIRM-SPECIFIC SKILLS AND INCENTIVES IN ORGANIZATIONS wages is that otherwise, competitors would bid for the worker and steal him. This argument does not apply when skills are firm-specific since such skills do not contribute to the worker s productivity in other firms. More generally, the relationship between productivity and wages is more complex when firmspecific skills are a significant component of productivity. For example, we might have two different jobs, one with faster accumulation of firm-specific skills, but wages may grow faster in the other jobs because the outside option of the worker is improving faster. (2) An empirical relationship between tenure and wages does not establish that there are imported from-specific effects. It might simply be that there are some jobs with high rents, and workers who get these jobs never quit, creating a positive relationship between tenure and wages. Alternatively, a positive relationship between tenure and wages may reflect the fact that high ability workers stay in their jobs longer (selection). The existing evidence may therefore either overstate or understate the importance of tenure, and there are no straightforward ways of dealing with these problems. In addition, there are important econometric problems, for example, the fact that in most data sets most tenure spells are uncompleted (most workers are in the middle of their job tenure), complicating the analysis. A number of researchers have used the usual strategies, as well as some creative strategies, to deal with the selection and omitted variable biases, pointed out in the second problem. But is still requires us to ignore the first problem (i.e.,
65 1. THE EVIDENCE ON FIRM-SPECIFIC RENTS AND INTERPRETATION 59 be cautious in inferring the tenure-productivity relationship from the observed tenure-wage relationship). In any case, the empirical relationship between tenure and wages is of interest in its own right, even if we cannot immediately deduce from this the relationship between tenure and firm-specific productivity. With all of these complications, the evidence nevertheless suggests that there is a positive relationship between tenure and wages, consistent with the importance of firm-specific skills. Here I will discuss two different types of evidence. The firsttypeofevidenceisfromregressionanalysesoftherelationship between wages and tenure exploiting within job wage growth. Here the idea is that by looking at how wages grow within a job (as long as the worker does not change jobs), and comparing this to the experience premium, we will get an estimate of the tenure premium. In other words, we can think of wages as given by the following model (1.1) ln w it = β 1 X it + β 2 T it + ε it where X it this total labor market experience of individual i, andt it is his tenure in the current job. Then, we have that his wage growth on this job is: ln w it = β 1 + β 2 + ε it If we knew the experience premium, β 2, we could then immediately compute the tenure premium β 1. The problem is that we do not know the experience premium. Topel suggests that we can get an upper bound for the experience premium by looking at the relationship between entry-level wages and labor market experience (that is, wages in
66 603. TENURE, FIRM-SPECIFIC SKILLS AND INCENTIVES IN ORGANIZATIONS jobs with tenure equal to zero). This is an upper bound to the extent that workers do not randomly change jobs, but only accept new jobs if these offer a relatively high wage. Therefore, whenever T it =0, the disturbance term ε it in (1.1) is likely to be positively selected. According to this reasoning, we can obtain a lower bound estimate of β 2,usinga two-step procedure first estimate the rate of within-job wage growth, and then subtract from this the estimate of the experience premium obtained from entry-level jobs. Using this procedure Topel estimates relatively high rates of return to tenure. For example, his main estimates imply that ten years of tenureincreasewagesbyabout25percent,overandabovetheexperience premium. It is possible, however, that this procedure might generate tenure premium estimates that are upward biased. For example, this would be the case if the return to tenure or experience is higher among high-ability workers, and those are underrepresented among the jobchangers. On the other hand, the advantage of this evidence is that it is unlikely to reflect simply the presence of some jobs that offer highrents to workers, unless these jobs that provide high rents also have (for somereason)higherwagegrowth(onepossibilitymightbethat,union jobs pay higher wages, and have higher wage growth, and of course, workers do not leave union jobs, but this seems unlikely). The second type of evidence comes from the wage changes of workers resulting from job displacement. A number of papers, most notably Jacobson, LaLonde and Sullivan, find that displaced workers experience substantial drop in earnings. Part of this is due to non-employment
67 1. THE EVIDENCE ON FIRM-SPECIFIC RENTS AND INTERPRETATION 61 following displacement, but even after three years a typical displaced worker is earning about $1500 (1987 dollars). Econometrically, this evidence is simpler to interpret than the tenure-premium estimates. Economically, the interpretation is somewhat more difficult than the tenure estimates, since it may simply reflect the loss of high-rent (e.g. union) jobs. In any case, these two pieces of evidence together are consistent withtheviewthatthereareimportantfirm-specific skills/expertises that are accumulated on the job What Are Firm-Specific Skills?If we are going to interpret the above evidence as reflecting the importance of firm-specific skills, then we have to be more specific about what constitutes firmspecific skills. Here are four different views: (1) Firm-specific skills can be thought to result mostly from firmspecific training investments made by workers and firms. Here it is important to distinguish between firms and workers investments, since they will have different incentives. (2) Firm-specific skills simply reflect what the worker learns onthe-job without making any investments. In other words, they are simply unintentional byproducts of working on the job. The reason why I distinguish this particular view from the firm-specific investments view is that according to this view, we do not need to worry about the incentives to acquire firmspecific skills. However, most likely, even for simple skills that
68 623. TENURE, FIRM-SPECIFIC SKILLS AND INCENTIVES IN ORGANIZATIONS workers can acquire on-the-job, they need to exert some effort, so this view may have relatively little applicability. (3) Firm-specific skills may reflect matching as in Jovanovic s approach. Here, there is no firm-specific skill, but some workers are better matches to some firms. Ex ante, neither the firm nor the worker knows this, and the information is revealed only slowly. Only workers who are revealed to be good matches to a particular job will stay on that job, and as a result, they will be more productive in this job than a randomly chosen worker. We can think of this process of learning about the quality of the match as the accumulation of firm-specific skills. (4) There may be no technologically firm-specific skills. Instead, you may think of all skills as technologically general, in the sense that if the worker is more productive in a given firm, another firm that adopts exactly the same technologies and organizational structure, and hires the same set of co-workers will also be able to benefit from this hire productivity. These technologically general skills are transformed into de facto firmspecific skills because of market imperfections. For example, if worker mobility is costly, or if it is difficult or unprofitable for firms to copy some other firms technology choices, these skills will be de facto specific tothefirm that has first made the technology/organizational choices. The reason why it is important to distinguish this view from the second one above
69
70
71
72
73
74
75
76
77
78 2. INVESTMENT IN FIRM-SPECIFIC SKILLS 63 is that it emphasizes how changes in technology/market organization will affect what skills are specific, and how specific certain skills are. 2. Investment in Firm-Specific Skills 2.1. The basic problem. The problem with general training investments was that part of the costs had to be borne by the firm, but, at least in competitive labor markets, the worker was the residual claimants. The worker, in turn, was the residual claimant because the skills were general, and other firms could compete for this worker s labor services. In contrast, with specific skills, the current employer is the only (or at least the main) consumer, so there is no competition from other firms to push up the worker s wages. As a result, firmspecific skills will make the firm the ex post monopsonist. This creates the converse problem. Now the worker also bears some (perhaps most) ofthecostsofinvestment,maynothavetherightincentivestoinvest, since the firmwillgetmostofthebenefits. To capture these problems, consider the following very simple model: At time t =0, the worker decides how much to invest in firmspecific skills, denoted by s, at the cost γ (s). γ (s) is strictly increasing and convex, with γ 0 (0) = 0. At time t =1,thefirm makes a wage offer to the worker. The worker decides whether to accept this wage offer and work for this firm, or take another job. Production takes place and wages are paid.
79 643. TENURE, FIRM-SPECIFIC SKILLS AND INCENTIVES IN ORGANIZATIONS Let the productivity of the worker be y 1 + f (s) where y 1 is also what he would produce with another firm. Since s is specific skills, it does not affect the worker s productivity in other firms. Let us solve this game by backward induction again, starting in the last period. The worker will accept any wage offer w 1 y 1,since this is what he can get in an outside firm. Knowing this, the firm simply offers w 1 = y 1. In the previous period, realizing that his wage is independent of his specific skills, the worker makes no investment in specific skills, even though the socially optimal amount of specific investment is strictly positive, given by γ 0 (s )=f 0 (s ).(Againthefact that s is strictly positive follows from the assumption that γ 0 (0) = 0). What is the problem here? By investing in his firm-specific skills, theworkerisincreasingthefirm s profits. Therefore, the firm would like to encourage the worker to invest. However, given the timing of the game, wages are determined by a take-it-leave-it offer by the firm after the investment. Therefore, it will always be in the interest of the firm to offer a low wage to the worker after the investment, in other words, the firm will hold the worker up. The worker anticipates this holdup problem and does not invest in his firm-specific skills. Why isn t there a contractual solution to this underinvestment problem? For example, the firm could write a contract ex ante promising a certain payment to the worker. Leaving aside the problems of enforcing such contracts (the firm could always try to fire the worker, or threaten to firehim),ifthiscontractdoesnotmakethewageof the worker conditional on his firm-specific skills, it will not encourage
80 2. INVESTMENT IN FIRM-SPECIFIC SKILLS 65 investment. So the only contracts that could help with the underinvestment problem are those that make the worker s wages contingent on his firm-specific skills. However, such skills are very difficult to observe or verify by outside parties. This motivates the assumption in this literature, as well as in the incomplete contracts literature, that such contingent contracts cannot be written (they cannot be enforced, and hence are useless). Therefore, contractual solutions to the underinvestment problem are difficult to devise As a result, there is a severe underinvestment problem here, driven by exactly the converse of the underinvestment problem in general training. The worker will not undertake the required investments, because he s afraid of being held up by the firm Worker power and investment. How can we improve the worker s investment incentives? At a very general level, the answer is simple. The worker s earnings have to be conditioned on his specific skills. Thereareanumberof ways of achieving this. Perhaps the simplest is to give the worker some power in the employment relationship. This power may come simply because the worker can bargain with his employer effectively (either individually or via unions though the latter raises the issue of whether union bargaining would link wages to productivity). The workermaybeabletobargainwiththefirm, in turn, for a variety of reasons. Here are some: (1) Because of regulations, such as employment protection legislation, or precisely because of his specific skills, the firm needs
81 663. TENURE, FIRM-SPECIFIC SKILLS AND INCENTIVES IN ORGANIZATIONS the worker, hence we are in the bilateral monopoly situation, and the rents will be shared (rather than the firm making a take-it-leave-it offer). (2) The firm may purposefully give access to some important assets of the firm to the worker, so that the worker may feel secure that he will not be held up. This is basically the insight that follows from the incomplete contracting approach to property rights. The literature pioneered by Williamson, and then by Grossman-Hart-Moore basically views the allocation of property rights, which determine who can use assets, as a way of manipulating ex post bargaining, and via this channel ex ante investment incentives. (3) The firm may change its organizational form in order to make a credible commitment not to hold up the worker. Here I will give a simple example of investment incentives with bargaining power, and show why firms may preferred to give more bargaining power to their employees in order to ensure high levels of firm-specific investments. In the next section, I discuss alternative organizational solutions to this problem. Modify the above game simply by assuming that in the final period, rather than the firm making a take-it-leave-it offer, the worker and the firm bargain over the firm-specific surplus, so the worker s wage is w 1 (s) =y 1 + βf (s) Now at time t =0, the worker maximizes y 1 + βf (s) γ (s),
82 which gives his investment as 2. INVESTMENT IN FIRM-SPECIFIC SKILLS 67 (2.1) βf 0 (ŝ) =γ 0 (ŝ) Here ŝ is strictly positive, so giving the worker bargaining power has improved investment incentives. However, ŝ is strictly less than the first-best investment level s. To investigate the relationship between firm-specific skills, firm profits and the allocation of power within firms, now consider an extended game, where at time t = 1, thefirm chooses whether to give the worker access to a key asset. If it does, ex post the worker has bargaining power β, and if it doesn t, the worker has no bargaining power and wages are determined by a take-it-leave-it offer of the firm. Essentially, the firm is choosing between the game in this section and the previous one. Let us look at the profits of the firm from choosing the two actions. When it gives no access, the worker chooses zero investment, and since w 1 = y 1,thefirm profits are π 0 =0. In contrast, with the change in organizational form giving access to the worker, the worker undertakes investment ŝ, and profits are π β =(1 β) f (ŝ). Therefore, the firm prefers to give the worker some bargaining power in order to encourage investment in specific skills. Notice the contrast in the role of worker bargaining power between the standard framework and the one here. In the standard framework, worker bargaining power always reduces profits andalwayscausesin- efficiency. Here, it may do the opposite. This suggests that in some situations reducing worker bargaining power may actually be counterproductive for efficiency.
83 683. TENURE, FIRM-SPECIFIC SKILLS AND INCENTIVES IN ORGANIZATIONS Note another interesting implication of the framework here. If the firm could choose the bargaining power of the worker without any constraints, it would set β such that π β β =0= f ŝ β + 1 β f 0 ŝ β dŝ β dβ, where ŝ (β) and dŝ dβ (2.1). are given by the first-order condition of the worker, One observation is immediate. The firm would certainly choose β < 1, since with β = 1, we could never have π β = 0 (or more β straightforwardly, profits would be zero). In contrast, a social planner who did not care about the distribution of income between profits and wages would necessarily choose β =1.The reason why the firm would not choose the structure organization that achieves the best investment outcomes is that it cares about its own profits. Iftherewereanexantemarketinwhichtheworkerandthefirm could transact, the worker could make side payments to the firm to encourage it to choose β =1, then the efficient outcome would be achieved. This is basically the solution that follows from the analysis of Grossman-Hart-Moore, but they are thinking of issues of vertical integration, or trying to answer the question of who among many entrepreneurs/managers should own the firm or its assets. In the context of worker-firm relationships, such a solution is not possible, given credit constraints facing workers. Perhaps more important, such an arrangement would effectively amount to the worker buying the firm, which is not possible for two important reasons:
84 2. INVESTMENT IN FIRM-SPECIFIC SKILLS 69 the entrepreneur/owner of the firm most likely has some essential knowledge for the production process, or in practice there are many workers, so it is impossible to improves their investment incentives by making each worker the residual claimant of the firm s profits Promotions. An alternative arrangement to encourage workers to invest in firm-specific skills is to design a promotion scheme. Consider the following setup. Suppose that there are two investment levels, s =0,ands =1which costs c. Suppose also that time t =1, there are two tasks in the firm difficult and easy, D and E. Assume outputs in these two tasks as a function of the skill level are y D (0) <y E (0) <y E (1) <y D (1) Therefore, skills are more useful in the difficult task, and without skills the difficult task is not very productive. Moreover, suppose that y D (1) y E (1) >c meaning that the productivity gain of assigning a skilled worker to the difficult task is greater than the cost of the worker obtaining skills. In this situation, the firm can induce firm-specific investments in skills if it can commit to a wage structure attached to promotions. In particular, suppose that the firmcommitstoawageofw D for the difficult task and w E for the easy task. Notice that the wages do not depend on whether the worker has undertaken the investment, so we
85 703. TENURE, FIRM-SPECIFIC SKILLS AND INCENTIVES IN ORGANIZATIONS are assuming some degree of commitment on the side of the firm, but not modifying the crucial incompleteness of contracts assumption. Now imagine the firmchoosesthewagestructuressuchthat (2.2) y D (1) y E (1) >w D w E >c, and then ex post decides whether the worker will be promoted. Again by backward induction, we have to look at the decisions in the final period of the game. When it comes to the promotion decision, and the worker is unskilled, the firm will naturally choose to allocate him to the easy task (his productivity is higher in the easy task and his wage is lower). If the worker is skilled, and the firm allocates him to the easy task, his profits are y E (1) w E. If it allocates him to the difficult task, his profits are y D (1) w D. The wage structure in (2.2) ensures that profits from allocating him to the difficult task are higher. Therefore, with this wage structure the firm has made a credible commitment to pay the worker a higher wage if he becomes skilled, because it will find it profitable to promote the worker. Next, going to the investment stage, the worker realizes that when he does not invest he will receive w E, and when he invests, he will get the higher wage w D. Since, again by (2.2), w D w E >c,theworker will find it profitable to undertake the investment Investments and layoffs The Hashimoto model. Consider the following model which is useful in a variety of circumstances. The worker can invest in s =1at time t =0again at the cost c. The investment increases the worker s productivity by an amount m + η where η is a mean-zero random variable officerofonlybythefirm at
86 2. INVESTMENT IN FIRM-SPECIFIC SKILLS 71 t =1. The total productivity of the worker is x + m + η (if he does not invest, his productivity is simply x). The firm unilaterally decides whether to fire the worker, so the worker will be fired if η < η w x m, where w is his wage. This wage is assumed to be fixed, and cannot be renegotiated as a function of η, since the worker does not observe η. (There can be other more complicated ways of revealing information about η, using stochastic contracts, but we ignore them here). If the worker is fired or quits, he receives an outside wage v. Ifhe stays, he receives the wage paid by the firm, w, and also disutility, θ, only observed by him. The worker unilaterally decides whether to quit or not, so he will quit if θ > θ w v Denoting the distribution function of θ by Q and that of η by F,the expected profit ofthefirm is Q (θ )[1 F (η )] [x + m w + E (η η η )] The expected utility of the worker is v + Q (θ )[1 F (η )] [w v E (θ θ θ )] In contrast, if the worker does not invest in skills, he will obtain v if w > x v + Q (θ )[w v E (θ θ θ )] if w x So we can see that a high wage promise by the firm may have either a beneficial or an adverse effect on investment incentives. If w = x + ε >
87 723. TENURE, FIRM-SPECIFIC SKILLS AND INCENTIVES IN ORGANIZATIONS v, the worker realizes that he can only keep his job by investing. But on the other hand, a high wage makes it more likely that η < η,soitmay increase the probability that given the realization of the productivity shock, profits will be negative, and the worker will be fired. This will reduce the worker s investment incentives. In addition, a lower wage would make it more likely that the worker will quit, and through this channel increase inefficiency and discourage investment. According to Hashimoto, the wage structure has to be determined to balance these effects, and moreover, the ex post wage structure chosen to minimize inefficient separations may dictate a particular division of the costs of firm-specific investments. An interesting twist on this comes from Carmichael, who suggests that commitment to a promotion latter might improve incentives to invest without encouraging further layoffs bythefirm. Suppose the firm commits to promote N h workers at time t =1(how such a commitment is made is an interesting and difficult question). Promotion comes with an additional wage of B. So the expected wage of the worker, if he keeps hisjob,isnow w + N h N B, where N is employment at time t =1, and this expression assumes that a random selection of the workers will be promoted. A greater N h or B, holding the layoff rate of the firm constant, increases the incentive of the worker to stay around, and encourages investment.
88 2. INVESTMENT IN FIRM-SPECIFIC SKILLS 73 Next think about layoff rate of the firm. The total wage bill of the firm at time t =1is then W = Nw + N h B. The significance of this expression is that if the firm fires a worker, this will only save the firm w, since it is still committed to promote N h workers. Therefore, this commitment to (an absolute number of) promotions, reduces the firm s incentive to fire, while simultaneously increasing the reward to staying in the firm for the worker. This is an interesting idea, but we can push the reasoning further, perhaps suggesting that it s not as compelling as it first appears. If the firm can commit to promote N h workers, why can t it commit to employing N 0 workers, and by manipulating this number effectively make a commitment not to fire workers? So if this type of commitment to employment level is allowed, promotions are not necessary, and if such a commitment is not allowed, it is not plausible that the firm can commit to promoting N h workers.
89 CHAPTER 4 Signaling and Externalities 1. The Signaling Approach to Human Capital 1.1. The basic story. The models we ve discussed so far are broadly in the tradition of Becker s approach to human capital. Human capital is viewed as an input in the production process. The leading alternative is to view education purely as a signal. Consider the following simple model to illustrate the issues. There are two types of workers, high ability and low ability. The fraction of high ability workers in the population is λ. Workersknow their own ability, but employers do not observe this directly. High ability workers always produce y h, while low ability workers produce y l. In addition, workers can obtain education. The cost of obtaining education is c h for high ability workers and c l for low ability workers. The crucial assumptions is that c l >c h, that is, education is more costly for low ability workers. This is often referred to as the singlecrossing assumption, since it makes sure that in the space of education and wages, the indifference curves of high and low types intersect only once. For future reference, I denote the decision to obtain education by e =1. 75
90 76 4. SIGNALING AND EXTERNALITIES For simplicity, I assume that education does not increase the productivity of either type of worker. Once workers obtain their education, there is competition among a large number of risk-neutral firms, so workers will be paid their expected productivity. This is again a dynamicgameofincompleteinformation,sowewilllookfortheperfect Bayesian Equilibria of this game. However, differently from the previous incomplete information game that we analyzed, here the party that has private information moves first. This implies that the concept of Perfect Bayesian Equilibrium is not strong enough to rule out some types of equilibria, and we may want to strengthen this notion of equilibrium (see below). In general, there can be two types of equilibria in this game. (1) Separating, where high and low ability workers choose different levels of schooling, and as a result, in equilibrium, employers can infer worker ability from education. (2) Pooling, where high and low ability workers choose the same level of education. In addition, there can be semi-separating equilibria, where some education levels are chosen by more than one type. Let me start by characterizing a possible separating equilibrium, which illustrates how education can be valued, even though it has no directly productive role. Suppose that we have (1.1) y h c h > y l >y h c l
91 1. THE SIGNALING APPROACH TO HUMAN CAPITAL 77 This is clearly possible since c h <c l. Then the following is an equilibrium: all high ability workers obtain education, and all low ability workers choose no education. Wages (conditional education) are: w (e =1)=y h and w (e =0)=y l Notice that these wages are conditioned on education, and not directly on ability, since ability is not observed by employers. Let us now check that all parties are playing best responses. First consider firms. Given the strategies of workers (obtain education for high ability and do not obtain education for low ability), a worker with education has productivity y h while a worker with no education has productivity y l.sono firm can change its behavior and increase its profits. What about workers? If a high ability worker deviates to no education, he will obtain w (e =0)=y l, whereas he s currently getting w (e =1) c h = y h c h >y l. If a low ability worker deviates to obtaining education, the market will perceive him as a high ability worker, and pay him the higher wage w (e =1)=y h. But from (1.1), we have that y h c l <y l, so this deviation is not profitable for a low ability worker, proving that the separating allocation is indeed an equilibrium. In this equilibrium, education is valued simply because it is a signal about ability. Education can be a signal about ability because of the single-crossing property. This can be easily verified by considering the case in which c l c h. Then we could never have condition (1.1) hold, so it would not be possible to convince high ability workers to obtain education, while deterring low ability workers from doing so.
92 78 4. SIGNALING AND EXTERNALITIES Notice also that if the game was one of perfect information, that is, the worker type were publicly observed, there could never be education investments here. This is of course an extreme result, due to the assumption that education has no productivity benefits. illustrates the forces at work. But it 1.2. Pooling equilibria in signaling games. However, the separating equilibrium is not the only one. Consider the following allocation: both low and high ability workers do not of education, and the wage structure is w (e =1)=(1 λ) y l + λy h and w (e =0)=(1 λ) y l + λy h What is happening here is that the market does not view education as a good signal, so a worker who deviates and obtains education is viewed as an average-ability worker, not as a high-ability worker. To simplify the discussion, let us strengthen the condition (1.1) to (1.2) y h c h > (1 λ) y l + λy h and y l >y h c l It is straightforward to check that no worker has any incentive to obtain education (given that education is costly, and there are no rewards to obtaining it). Since all workers choose no education, the expected productivity of a worker with no education is (1 λ) y l + λy h,sofirms are playing best responses. (what they do in response to a deviation by a worker who obtains education is not important, since this does not happen along the equilibrium path). What I have just described is a Perfect Bayesian Equilibrium. But is it reasonable? The answer is no. This equilibrium is being supported by the belief that the worker who gets education is no better than
93 1. THE SIGNALING APPROACH TO HUMAN CAPITAL 79 a worker who doesn t. But education is much more costly for low ability workers, so they should be less likely to deviate to obtaining education. There are many refinements in game theory which basically try to restrict beliefs in information sets that are not reached along the equilibrium path, ensuring that unreasonable beliefs, such as those that think a deviation to obtaining education is more likely from a low ability worker, are ruled out. Perhaps the simplest is The Intuitive Criterion by Cho and Kreps. The underlying idea is as follows. If there exists a type who will never benefit from taking a particular deviation, then the uninformed parties (here the firms) should deduce that this deviation is very unlikely to come from this type. This falls within the category of forward induction where rather than solving the game simply backwards, we think about what type of inferences will others derive from a deviation. In any case, take the pooling equilibrium above. Consider a deviation to e =1. There is no circumstance under which the low type would benefit from this deviation, since by assumption (1.1) we have y l >y h c l, and the most a worker could ever get is y h,andthelow ability worker is now getting (1 λ) y l + λy h. Therefore, firms can deduce that the deviation to e =1is coming from the high type, and offer him a wage of y h. Then (1.1) ensures that this deviation is profitable for the high types, breaking the pooling equilibrium. The reason why this refinement is called The Intuitive Criterion is that it can be supported by a relatively intuitive speech by the deviator along the following lines: you have to deduce that I must be the high type deviating to e =1, since low types would never ever
94 80 4. SIGNALING AND EXTERNALITIES consider such a deviation, whereas I would find it profitable if I could convince you that I am indeed the high type). Of course, this is only very loose, since such speeches are not part of the game, but it gives the basic idea. The overall conclusion is that as long as the separating condition is satisfied, we expect the equilibrium of this economy can involve a separating allocation, where education is valued as a signal Generalizations. It is straightforward to generalize this equilibrium concept to a situation in which education has a productive role as well as a signaling role. Then the story would be one where education is valued for more than its productive effect, because it is also associated with higher ability. Letmegivethebasicideahere. Imaginethateducationiscontinuous e [0, ). And the cost functions for the high and low types are c h (e) and c l (e), which are both strictly increasing and convex, with c h (0) = c l (0) = 0. The single crossing property is that c 0 h (e) <c0 l (e) for all e, thatis,themarginalcostofinvestinginagivenunitofeducation is always higher for the low type. Moreover,supposethattheoutputofthetwotypesasafunction of their educations are y h (e) and y l (e), withy h (e) >y l (e) for all e. Again there are many equilibria, some separating, some pooling and some semi-separating. But applying a stronger form of the Intuitive Criterion reasoning, we will take the Riley equilibrium of this game, which is a particular separating equilibrium. It is characterized as follows. We first find the most preferred education level for the low
95 1. THE SIGNALING APPROACH TO HUMAN CAPITAL 81 type in the perfect information case, which will be given by yl 0 (e l )=c 0 l (e l ), then we write the incentive compatibility constraint for the low type, such that when the market expects low types to obtain education e l,the low type does not try to mimic the high type and choose the education level the market expects the high type to obtain, e. compatibility constraint is This incentive (1.3) y l (e l ) c l (e l ) y h (e) c l (e) Let e h be such that this constraint holds as an equality: y l (e l ) c l (e l )=y h (e h ) c l (e h ). Then the Riley equilibrium is such that low types choose e l andobtainthewagew (e l )=y l (e l ), and high types choose e h and obtain the wage w (e h )=y h (e h ). That high types are happy to do this follows immediately from the single-crossing property, since y h (e h ) c h (e h ) >y h (e h ) c l (e h )=y h (e h ) c l (e h ) Notice that in this equilibrium, high ability workers are typically investing more than they would have done in the perfect information case, in the sense that e h characterized here is greater than the education level that high ability individuals chosen with perfect information, given by yh 0 (e h )=c0 h (e h ) Evidence on labor market signaling. Is the signaling role of education important? There are a number of different ways of approaching this question. Unfortunately, direct evidence is difficult to
96 82 4. SIGNALING AND EXTERNALITIES find. Here I will discuss a number of different attempts that investigate the importance of labor market signaling. In the next section, I will discuss empirical work that may give a sense of how important signaling considerations are in the aggregate. Before this discussion, note the parallel between the selection stories discussed above and the signaling story. In both cases, the observed earnings differences between high and low education workers will include a component due to the fact that the abilities of the high and low education groups differ. There is one important difference, however, in that in the selection stories, the market observed ability, it was only us the economists who were unable to do so. In the signaling story, the market is also unable to observed ability, and is inferring it from education. For this reason, proper evidence in favor of the signaling story should go beyond documenting the importance of some type of selection There are 4 different approaches to determining whether signaling is important. The first line of work looks at whether degrees matter, in particular, whether a high school degree or the fourth year of college that gets an individual a university degree matter more than other years of schooling (e.g., Kane and Rouse). This approach suffers from two serious problems. First, the final year of college (or high school) may in fact be more useful than the third-year, especially because it shows that the individual is being able to learn all the required information that makes up a college degree. Second, and more serious, there is no way of distinguishing selection and signaling as possible explanations for these patterns. It may be that those who drop out of
97 1. THE SIGNALING APPROACH TO HUMAN CAPITAL 83 high school are observationally different to employers, and hence receive different wages, but these differences are not observed by us in the standard data sets. This is a common problem that will come back again: the implications of unobserved heterogeneity and signaling are often similar, and many misleading claims exist in the literature. Second, a creative paper by Lang and Kropp tests for signaling by looking at whether compulsory schooling laws affect schooling above the regulated age. The reasoning is that if the 11th year of schooling is a signal, and the government legislates that everybody has to have 11 years of schooling, now high ability individuals have to get 12 years of schooling to distinguish themselves. They find evidence for this, which they interpret as supportive of the signaling model. The problem is that there are other reasons for why compulsory schooling laws may have such effects. For example, an individual who does not drop out of 11th grade may then decide to complete high school. Alternatively, there can be peer group effects in that as fewer people drop out of school, it may become less socially acceptable the drop out even at later grades. The third approach is the best. It is pursued in a very creative paper by Tyler, Murnane and Willett. They observe that passing grades inthegraduateequivalentdegree(ged)differ by state. So an individual with the same grade in the GED exam will get a GED in one state, but not in another. If the score in the exam is an unbiased measure of human capital, and there is no signaling, these two individuals should get the same wages. In contrast, if the GED is a signal, and
98 84 4. SIGNALING AND EXTERNALITIES employers do not know where the individual took the GED exam, these two individuals should get different wages. Using this methodology, the authors estimate that there is a percent return to a GED signal. The attached table shows the results. An interesting result that Tyler, Murnane and Willett find is that there are no GED returns to minorities. This is also consistent with the signaling view, since it turns out that many minorities prepare for and take the GED exam in prison. Therefore, GED would be not only a positive signal, but also likely a signal that the individual was at some point incarcerated. Hence not a good signal at all. The fourth approach is discussed in the next section. 2. Human Capital Externalities Many economists believe that human capital not only creates private returns, increasing the earnings of the individual will acquires it, but it also creates externalities, i.e., it increases the productivity of other agents in the economy (e.g., Jacobs, Lucas). If so, existing research on the private returns to education is only part of the picture the social return, i.e., the private return plus the external return, may far exceed the private return. Conversely, if signaling is important, the private return overestimates the social return to schooling. Estimating the external and the social returns to schooling is a first-order question Theory. To show how and why external returns to education may arise, I will briefly discussed two models. The first is a theory of non-pecuniary external returns, meaning that external returns arise
99 2. HUMAN CAPITAL EXTERNALITIES 85 from technological linkages across agents or firms. The second is pecuniary model of external returns, thus externalities will arise from market interactions and changes in market prices resulting from the average education level of the workers. Suppose that the output (or marginal product) of a worker, i, is y i = A h ν i, where h i is the human capital (schooling) of the worker, and A is aggregate productivity. Assume that labor markets are competitive. So individual earnings are W i = Ah ν i. The key idea of externalities is that the exchange of ideas among workers raises productivity. This can be model by allowing A to depend on aggregate human capital. In particular, suppose that (2.1) A = BH δ E [h i ] δ, where H is a measure of aggregate human capital, E is the expectation operator, B is a constant Individual earnings can then be written as W i = Ah ν i = BH δ h v i. Therefore, taking logs, we have: (2.2) ln W i =lnb + δ ln H + ν ln h i. If external effects are stronger within a geographical area, as seems likely in a world where human interaction and the exchange of ideas are the main forces behind the externalities, then equation (2.2) should be estimated using measures of H at the local level. This is a theory of non-pecuniary externalities, since the external returns arise from the technological nature of equation (2.1).
100 86 4. SIGNALING AND EXTERNALITIES The alternative is pecuniary externalities, as first conjectured by Marshall (1961) who argued that increasing the geographic concentration of specialized inputs increases productivity since the matching between factor inputs and industries is improved. A similar story is developedinacemoglu(1997),wherefirms find it profitable to invest in new technologies only when there is a sufficient supply of trained workers to replace employees who quit. I refer to this sort of effect as a pecuniary externality since greater human capital encourages more investment by firms and raises other workers wages via this channel. Here, I will briefly explain a simplified version of the model in Acemoglu (1996). Consider an economy lasting two periods, with production only in the second period, and a continuum of workers normalized to 1. Take human capital, h i, as given. There is also a continuum of risk-neutral firms. In period 1, firms make an irreversible investment decision, k, at cost Rk. Workers and firms come together in the second period. The labor market is not competitive; instead, firmsandworkersare matched randomly, and each firm meets a worker. The only decision workers and firms make after matching is whether to produce together or not to produce at all (since there are no further periods). If firm f and worker i produce together, their output is (2.3) k α f h ν i, where α < 1, ν 1 α. Since it is costly for the worker-firm pair to separate and find new partners in this economy, employment relationships generate quasi-rents. Wages will therefore be determined
101 2. HUMAN CAPITAL EXTERNALITIES 87 by rent-sharing. Here, simply assume that the worker receives a share β of this output as a result of bargaining, while the firm receives the remaining 1 β share. An equilibrium in this economy is a set of schooling choices for workers and a set of physical capital investments for firms. Firm f maximizes the following expected profit function: (2.4) (1 β) k α f E[h ν i ] R k f, with respect to k f. Since firms do not know which worker they will be matched with, their expected profit is an average of profits from different skill levels. The function (2.4) is strictly concave, so all firms choose the same level of capital investment, k f = k, givenby µ 1/(1 α) (1 β) α H (2.5) k =, R where H E[h ν i ] is the measure of aggregate human capital. Substituting (2.5) into (2.3), and using the fact that wages are equal to a fraction β of output, α/(1 α) thewageincomeofindividuali is given by W i = β (hi )) ν. Taking logs, this is: (2.6) ln W i = c + α 1 α ln H + ν ln h i, where c is a constant and α 1 α ³ (1 β)αh R and ν are positive coefficients. Human capital externalities arise here because firms choose their physical capital in anticipation of the average human capital of the workers they will employ in the future. Since physical and human
102 88 4. SIGNALING AND EXTERNALITIES capital are complements in this setup, a more educated labor force encourages greater investment in physical capital and to higher wages. In the absence of the need for search and matching, firms would immediately hire workers with skills appropriate to their investments, and there would be no human capital externalities. Nonpecuniary and pecuniary theories of human capital externalities lead to similar empirical relationships since equation (2.6) is identical to equation (2.2), with c =lnb and δ = α. Again presuming that these 1 α interactions exist in local labor markets, we can estimate a version of (2.2) using differences in schooling across labor markets (cities, states, or even countries) Signaling and externalities. The above models focused on positive externalities to education. However, in a world where education plays a signaling role, we might also expect significant negative externalities. To see this, consider the most extreme world in which education is only a signal it does not have any productive role. Contrast two situations: in the first, all individuals have 12 years of schooling and in the second all individuals have 16 years of schooling. Since education has no productive role, and all individuals have the same level of schooling, in both allocations they will earn exactly the same wage (equal to average productivity). Therefore, here the increase in aggregate schooling does not translate into aggregate increases in wages. But in the same world, if one individual obtains more education than the rest, there will be a private return to him, because he would signal that he s of higher ability. Therefore, in a world where signaling
103 2. HUMAN CAPITAL EXTERNALITIES 89 is important, we might also want to estimate an equation of the form (2.2), but we would expect δ to be negative Evidence. OLS estimation of equations like (2.2) yield very significant and positive estimates of δ, indicating very large positive human capital externalities. The leading example is the paper by Jim Rauch. There are at least two problems with this type OLS estimates. First, it may be precisely high-wage states that either attract a large number of high education workers or give strong support to education. Rauch s estimates were using a cross-section of cities. Including city or state fixed affects ameliorates this problem, but does not solve it, since states attitudes towards education and the demand for labor may comove. The ideal approach would be to find a source of quasi-exogenous variation in average schooling across labor markets (variation unlikely to be correlated with other sources of variation in the demand for labor in the state). Acemoglu and Angrist try to accomplish this using differences in compulsory schooling laws. The advantage is that these laws not only affect individual schooling but average schooling in a given area. There is an additional econometric problem in estimating externalities, which remains even if we have an instrument for average schooling in the aggregate. This is that if individual schooling is measured with error (or for some other reason OLS returns to individual schooling are not the causal effect), some of this discrepancy between the OLS returns and the causal return may load on average schooling, even when
104
105 90 4. SIGNALING AND EXTERNALITIES average schooling is instrumented. This suggests that we may need to instrument for individual schooling as well (so as to get to the correct return to individual schooling). More explicitly, let Y ijt be the log weekly wage, than the estimating equation is (2.7) Y ijt = Xiµ 0 + δ j + δ t + γ 1 S jt + γ 2i s i + u jt + ε i, To illustrate the main issues, ignore time dependence, and consider the populationregressionofy i on s i : (2.8) Y ij = µ 0 + ρ 0 s i + ε 0i ; where E[ε 0i s i ] 0. Next consider the IV population regression using a full set of state dummies. This is equivalent to (2.9) Y ij = µ 1 + ρ 1 S j + ε 1i ; where E[ε 1i S j ] 0, since the projection of individual schooling on a set of state dummies is simply average schooling in each state. Now consider the estimation of the empirical analogue of equation (2.2): (2.10) Y ij = µ + π 0 s i + π 1 S j + ξ i ; where E[ξ i s i ]=E[ξ i S j ] 0. Then, we have (2.11) π 0 = ρ 1 + φ(ρ 0 ρ 1 ) π 1 = φ(ρ 1 ρ 0 ) where φ = 1 > 1, and R 2 is the first-stage R-squared for the 2SLS 1 R 2 estimates in (2.9). Therefore, we may find positive external returns
106 2. HUMAN CAPITAL EXTERNALITIES 91 even when there are none, if it happens to be the case that ρ 1 > ρ 0,for example because there is measurement error in individual schooling. If we could instrument for both individual and average schooling, we would solve this problem. But what type of instrument? Consider the relationship of interest: (2.12) Y ij = µ + γ 1 S j + γ 2i s i + u j + ε i, which could be estimated by OLS or instrumental variables, to obtain an estimate of γ 1 as well as an average estimate of γ 2i,sayγ 2. An alternative way of expressing this relationship is to adjust for the effect of individual schooling by directly rewriting (2.12): (2.13) Y ij γ 2s i ey ij = µ + γ 1 S j +[u j + ε i +(γ 2i γ 2)s i ]. In this case, instrumental variables estimate of external returns is equivalent to the Wald formula γ IV 1 = E[e Y ij z i =1] E[ Y e ij z i =0] E[S j z i =1] E[S j z i =0] E[γ2i s i z i =1] E[γ = γ 1 + 2i s i z i =0] E[s i z i =1] E[s i z i =0] This shows that we should set γ 2 E[si z i =1] E[s i z i =0]. E[S j z i =1] E[S j z i =0] (2.14) γ = E[γ 2is i z i =1] E[γ 2i s i z i =0] E[s i z i =1] E[s i z i =0] = E[(Y ij γ 1 S j ) z i =1] E[(Y ij γ 1 S j ) z i =0] E[s i z i =1] E[s i z i =0] This is typically not the OLS estimator of the private return, and we should be using some instrument. The ideal instrument would be affecting exactly in the same people as the compulsory schooling laws.
107 92 4. SIGNALING AND EXTERNALITIES Quarter of birth instruments might come close to this. Since quarter of birth instruments are likely to affectthesamepeopleascompulsory schooling laws, adjusting with the quarter of birth estimate, or using quarter of birth dummies as instrument for individual schooling, is the right strategy. So the strategy is to estimate an equation similar to (2.2) or (2.10) using compulsory schooling laws for average schooling and quarter of birth dummies for individual schooling. The results suggest that there are no significant external returns. The estimates are typically around 1 or 2 percent, and statistically not different from zero. They also suggest that in the aggregate signaling considerations are unlikely to be very important (at the very least, they do not dominate positive externalities). 3. Peer Group Effects The above discussion focused on external returns to education. Another important type of externality that arises in the context of education is peer group effects, or generally social effects in the process of education. The fact that children growing up in different areas may choose different role models will lead to this type of externalities/peer group effects. Moresimply,to theextentthatschoolingandlearning are group activities, there could be this type of peer group effects. There are a number of theoretical issues that need to be clarified, as well as important work that needs to be done in understanding where peer group effects are coming from. Moreover, empirical investigation of peer group effects is at its infancy, and there are very difficult issues
108
109
110
111
112 3. PEER GROUP EFFECTS 93 involved in estimation and interpretation. Since there is little research in understanding the nature of peer group effects, here I will simply take peer group effects as given, and briefly discuss some of its efficiency implications, especially for community structure and school quality, andthenverybriefly mention some work on estimating peer group affects Implications of peer group effects for mixing and segregation. An important question is whether the presence of peer group effects has any particular implications for the organizational schools, and in particular, whether children who provide positive externalities on other children should be put together in a separate school or classroom. The basic issue here is equivalent to an assignment problem. The general principle in assignment problems, such as Becker s famous model of marriage, is that if inputs from the two parties are complementary, there should be assortative matching, that is the highest quality individuals should be matched together. In the context of schooling, this implies that children with better characteristics, who are likely to create more positive externalities and be better role models, should be segregated in their own schools, and children with worse characteristics, who will tend to create negative externalitieswill, should go to separate schools. This practically means segregation along income lines, since often children with better characteristics are those from better parental backgrounds, while children with worse characteristics are often from lower socioeconomic backgrounds
113 94 4. SIGNALING AND EXTERNALITIES So much is well-known and well understood. The problem is that there is an important confusion in the literature, which involves deducing complementarity from the fact that in equilibrium we do observe segregation (e.g., rich parents sending their children to private schools withotherchildrenfromrichparents, or living in suburbs and sending their children to suburban schools, while poor parents live in ghettos and children from disadvantage backgrounds go to school with other disadvantaged children in inner cities). This reasoning is often used in discussions of Tiebout competition, together with the argument that allowing parents with different characteristics/tastes to sort into different neighborhoods will often be efficient. The underlying idea can be given by the following simple model. Suppose that schools consist of two kids, and denote the parental background (e.g., home education or parental expenditure on non-school inputs) of kids by e, and the resulting human capitals by h. Suppose that we have (3.1) h 1 = e α 1 e 1 α 2 h 2 = e 1 α 1 e α 2 where α > 1/2. This implies that parental backgrounds are complementary, and each kid s human capital will depend mostly on his own parent s background, but also on that of the other kid in the school. For example, it may be easier to learn or be motivated when other children in the class are also motivated. This explains why we have h 1 e 2, h 2 e 1 > 0. But another important feature of (3.1) is that 2 h 1 e 2 e 1, 2 h 2 e 1 e 2 > 0, that is, the backgrounds of the two kids are complementary. This implies
114 3. PEER GROUP EFFECTS 95 that a classmate with a good background is especially useful to another kid with a good background. We can think of this as the bad apple theory of classroom: one bad kids in the classroom brings down everybody. As a digression, notice an important feature of the way I wrote (3.1) linking the outcome variables, h 1 and h 2, two predetermined characteristics of children e 1 and e 2, which creates a direct analogy with the human capital externalities discussed above. However, this may simply be the reduced form of that somewhat different model, for example, (3.2) h 1 = H 1 (e 1,h 2 ) h 2 = H 2 (e 2,h 1 ) whereby each individual s human capital depends on his own background and the human capital choice of the other individual. Although in reduced form (3.1) and (3.2) are very similar, they provide different interpretations of peer group effects, and econometrically they pose different challenges. The complementarity has two implications: (1) It is socially efficient, in the sense of maximizing the sum of human capitals, to have parents with good backgrounds to send their children to school with other parents with good backgrounds. This follow simply from the definition of complementarity, positive cross-partial derivative, which is clearly verified by the production functions in (3.1). (2) It will also be an equilibrium outcome that parents will do so. To see this, suppose that we have a situation in which there are
115 96 4. SIGNALING AND EXTERNALITIES two sets of parents with background e l and e h >e l. Suppose that there is mixing. Now the marginal willingness to pay of a parent with the high background to be in the same school with the other parent is e α he α h =1, while the marginal willingness to pay of a low background parent to stay in the school with the high background parents is e α he α l < 1 since e h >e l. Therefore, the high-background parent can always outbid the low-background parent for the privilege of sending his children to school with other high-background parents. Thus with profit maximizing schools, segregation will arise as the outcome. Next consider a production function with substitutability (negative cross-partial derivative). For example, (3.3) h 1 = φe 1 + e 2 λe 1/2 1 e 1/2 2 h 2 = e 1 + φe 2 λe 1/2 1 e 1/2 2 where φ > 1 and λ is small, so that human capital is increasing in parental background. With this production function, we again have h 1 e 2, h 2 e 1 > 0, but now in contrast to (3.1), we also have 2 h 1 e 2 e 1, 2 h 2 e 1 e 2 > 0. This can be thought to correspond to the good apple theory of the classroom, where the kids with the best characteristics and attitudes bring the rest of the class up.
116 3. PEER GROUP EFFECTS 97 Now because the cross-partial derivative is negative, the marginal willingness to pay of low-background parents to paid to put their kid together with high-background parents is higher than that of highbackground parents. With perfect markets, we will observe mixing, and in equilibrium schools will consist of a mixture of children from high- and low-background parents. Now combining the outcomes of these two models, many people jump to the conclusion that since we do observe segregation of schooling in practice, parental backgrounds must be complementary, so segregation is in fact efficient. Again the conclusion is that allowing Tiebout competition and parental sorting will most likely achieve efficient outcomes. However, this conclusion is not correct, since even if the correct production function was (3.3), segregation would arise in the presence of credit market problems. In particular, the way that mixing is supposed to occur with (3.3) is that low-background parents make a payment to high-background parents so that the latter send their children to a mixed school. To see why such payments are necessary, recall that even with (3.3) we have that the first derivatives are positive, that is h 1 e 2, h 2 e 1 > 0. This means that everything else being equal all children benefit from being in the same class with other children with good backgrounds. With (3.3), however, children from better backgrounds benefit less than children from good backgrounds. That s why there has to be payments from parents of less good backgrounds to high-background parents.
117 98 4. SIGNALING AND EXTERNALITIES Such payments are both difficult to implement in practice, and practically impossible taking into account the credit market problems facing parents from poor socioeconomic status. Therefore, if the true production function is (3.3) but there are credit market problems, we will observe segregation in equilibrium, and the segregation will be inefficient. Therefore we cannot simply appeal to Tiebout competition, or deduce efficiency from the equilibrium patterns of sorting The Benabou model. A similar point is developed by Benabou even in the absence of credit market problems, but relying on other missing markets. His model has competitive labor markets, and local externalities (externalities in schooling in the local area). All agents are assumed to be ex ante homogeneous, and will ultimately end up either low skill or high skill. Utility of agent i is assumed to be U i = w i c i r i where w is the wage, c is the cost of education, which is necessary to become both low skill or high skill, and r is rent. The cost of education is assumed to depend on the fraction of the agents in the neighborhood, denoted by x, who become high skill. In particular, we have c H (x) and c L (x) as the costs of becoming high skill and low skill. Both costs are decreasing in x, meaning that when there are more individuals acquiring high skill, becoming high skill is cheaper (positive peer group effects). In addition, we have c H (x) >c L (x)
118
119 3. PEER GROUP EFFECTS 99 so that becoming high skill is always more expensive, and c 0 H (x) >c 0 L (x), so that the effect of increase in the fraction of high skill individuals in the neighborhood is bigger on the cost of becoming high skill. Since all agents are ex ante identical, in equilibrium we must have U (L) =U (H) that is, the utility of becoming high skill and low skill must be the same. Assume that the labor market in the economy is global, and takes the constant returns to scale form F (H, L). The important implication here is that irrespective of where the worker obtains his education, he will receive the same wage is a function of his skill level. Also assume that there are two neighborhoods of fixed size, and individuals will compete in the housing market to locate in one neighborhood or the other. There can be two types of equilibria: (1) Integrated city equilibrium, where in both neighborhoods there is a fraction ˆx of individual obtaining high education. (2) Segregated city equilibrium, where one of the neighborhoods is homogeneous. For example, we could have a situation where one neighborhood has x =1and the other has x <1, orone neighborhood has x =0and the other has x >0. The important observation here is that only segregated city equilibria are stable. To see this consider an integrated city equilibrium, and imagine relocating a fraction ε of the high-skill individuals (that is
120
121 SIGNALING AND EXTERNALITIES individuals getting high skills) from neighborhood 1 to neighborhood 2. This will reduce the cost of education in neighborhood 2, both for high and low skill individuals. But by assumption, it reduces it more for high skill individuals, so all high skill individuals now will pay higher rents to be in that city, and they will outbid low-skill individuals, taking the economy toward the segregated city equilibrium. In contrast, the segregated city equilibrium is always stable. So we again have a situation in which segregation arises as the equilibrium outcomes, and again because of a reasoning relying on the notion of complementarity. As in the previous section, high-skill individuals can outbid the low-skill individuals because they benefit morefromthe peer group effects of high skill individuals. But again there are some missing markets, in particular, rather than paying high skill individuals for the positive externalities that they create, as would be the case in complete markets, agents transact simply through the housing market. In the housing market, there is only one rent level, which both high and low skill individuals pay. In contrast, with complete markets, we can think of the pricing scheme for housing to be such that high skill individuals pay a lower rent. Therefore, there are missing markets, and efficiency is not guaranteed. Is the allocation with segregation efficient? It turns out that it may or may not. To see this considered a problem of a social planner. She will maximize F (H, L) H 1 c H (x 1 ) H 2 c H (x 2 ) L 1 c L (x 1 ) L 2 c L (x 2 )
122 3. PEER GROUP EFFECTS 101 where x 1 = H 1 L 1 + H 1 and x 2 = H 2 L 2 + H 2 This problem can be broken into two parts: first to choose the aggregate amount of skilled individuals, and then to choose how to actually allocate them between the two neighborhoods. The second part is simply one of cost minimization, and the solution depends on whether Φ (x) =xc H (x)+(1 x) c L (x) is concave or convex. This function is simply the cost of giving high skills to a fraction x of the population. When it is convex, it means that it s best to choose the same level of x in both neighborhoods, and when it s concave, the social planner minimizes costs by choosing two extreme values of x in the two neighborhoods. It turns out that this function can be convex, i.e. Φ 00 (x) > 0. More specifically, we have: Φ 00 (x) =2(c 0 H (x) c 0 L (x)) + x (c 00 H (x) c 00 L (x)) + c 00 L (x) We can have Φ 00 (x) > 0 when the second and third terms are large. Intuitively, this can happen because although a high skill individual benefits more from being together with other high skill individuals, he is also creating a positive externality on low skill individuals when he mixes with them. This externality is not internalized, potentially leading to inefficiency. This model gives another example of why equilibrium segregation does not imply efficient segregation.
123 SIGNALING AND EXTERNALITIES 3.3. Empirical issues and evidence. Peer group effects are generally very difficult to identify. In addition, we can think of two alternative formulations where one is practically impossible to identify satisfactorily. To discuss these issues, let us go back to the previous discussion, and recall that the two structural formulations, (3.1) and (3.2), have very similar reduced forms, but the peer group effects work quite differently, and have different interpretations. In (3.1), it is the (predetermined) characteristics of my peers that determine my outcomes, whereas in (3.2), it is the outcomes of my peers that matter. Above we saw how to identify externalities in human capital, which is in essence similar to the structural form in (3.1). More explicitly, the equation of interest is (3.4) y ij = θx ij + α X j + ε ij where X is average characteristic (e.g., average schooling) and y ij is the outcome of the ith individual in group j. Here, foridentification all we need is exogenous variation in X. The alternative is (3.5) y ij = θx ij + αȳ j + ε ij where Ȳ is the average of the outcomes. Some reflection will reveal why the parameter α is now practically impossible to identify. Since Ȳj does not vary by individual, this regression amounts to one of Ȳj on itself at the group level. This is a serious econometric problem. One imperfect way to solve this problem is to replace Ȳj on the right hand side by Ȳ i j which is the average excluding individual i. Another approach is
124 3. PEER GROUP EFFECTS 103 to impose some timing structure. For example: y ijt = θx ijt + αȳj,t 1 + ε ijt There are still some serious problems irrespective of the approach taken. First, the timing structure is arbitrary, and second, there is no way of distinguishing peer group effects from common shocks. As an example consider the paper by Sacerdote, which uses random assignment of roommates in Dartmouth. He finds that the GPAs of randomly assigned roommates are correlated, and interprets this as evidence for peer group effects. Despite the very nice nature of the experiment, the conclusion is problematic, because he s trying to identify (3.5) rather than (3.4). For example, to the extent that there are common shocks to both roommates (e.g., they are in a noisier dorm), this may not reflect peer group effects. Instead, the problem would not have arisen if the right-hand side regressor was some predetermined characteristic of the roommate (i.e., then we would be estimating something similar to (3.4) rather than (3.5)).
125
126 Part 2 Changes in the Wage Structure
127 In this part I discuss the changes that have taken place in the U.S. wage structure, and also briefly discuss cross-country trends. As is well known, wage and income inequality have increased considerably in the U.S. over the past 25 years. Thismakesananalysisofchanges in the wage structure interesting in its own right. Moreover, changes in the wage structure also imply changing labor market prices of different types of skills. Therefore, studying changes in the wage structure will be informative about the changes in the demand for different types of skills and technological developments. Finally, changes in the wage structure will also lead to different incentives for human capital investments, which we might want to understand.
128 CHAPTER 5 The Basic Trends and Interpretation 1. Changes in the U.S. Wage Structure 1.1. Some basic facts. Briefly,thefollowingaresomeofthemajor changes in the U.S. wagestructure. (1) Returns to education fell during the 1970s, when there was a very sharp increase in the supply of educated workers. Returns to education then began a steep rise during the 1980s. This conclusion is independent of how returns to education are measured. For example, the simple linear return to schooling in a typical Mincer increased sharply. It was approximately 7.5 percent in 1980, and in 1990 it stood closer to 10 percent. But in fact, the increase is more significant between high school graduates in college graduates. Between 1979 and 1987, the average weekly wages of college graduates with one to five years of experience increased by 30 percent relative to the average weekly earnings of comparable high school graduates. The increase in inequality is even more pronounced between high school graduates and those with more than college. (2) Overall wage inequality, for example as measured by the ratio of the different percentiles of the overall wage distribution (e.g ), rose sharply beginning in the 1970s. 107
129 THE BASIC TRENDS AND INTERPRETATION (3) The single biggest contributor to the increase in overall wage inequality is the increase in within group (residual) inequality i.e., increases in inequality among observationally equivalent workers. The standard way to compute residual wage inequalityiseithertolookatinequalitywithinverynarrowlydefined cells (workers with the same education level, the same experience level and of the same sex and race), or to run a standard Mincer wage regression of the form (1.1) ln w it = X 0 itβ t + v it, where w it is weekly earnings for individual i observed in year t, andx it is a set of controls. The fact that β t is indexed by t indicates that returns to these observed characteristics are allowed to vary from year-to-year. Measures of residual inequality are calculated as the difference between the 90th and the 10th (or 50th and 10th, etc.) percentile values of the residual distribution from this regression, v it. (4) Average and median wages have stagnated and wages of lowskill workers have fallen in real terms since For example, white men aged earned $409 a week in 1999 dollars in 1949, and $793 in 1969, which corresponds approximately to a 3.4 percent a year increase in real wages between 1949 and In contrast, the same age group earned $909 in 1989, or experienced only a 0.6 percent a year increase between 1969 and In the meantime, the real wages of high school
130 1. CHANGES IN THE U.S. WAGE STRUCTURE 109 graduates with 1 to 5 years of experience fell by 20 percent from 1979 to (5) These changes have been more pronounced for relatively less experienced workers, and the experience premium the earning difference between high and low experienced workers has also changed. In particular, among college graduates, young college graduates now earn relatively more as compared to older college graduates than before. In contrast, among high school graduates, the earnings gap between more and less experienced workers has widened substantially. (6) The wage differential between men and women has narrowed substantially. (7) The wage differential between black and white workers, which had been narrowing until the mid-70s, started to expand. (8) Inequality of compensation, taking into account non-wage and fringe benefits, has expanded more than earnings inequality (Pierce, 2000). (9) Income inequality has also increased substantially over this time period, mostly reflectingtheincreaseinwageinequality, but also the explosion in CEO pay and the high rates of return on capital and other assets which are held very unequally in the population. (10) There has been very large increase in the incomes of those at the very top of the earnings distribution (the top 1 percent or even 0.1 percent of income distribution), in part because
131 THE BASIC TRENDS AND INTERPRETATION of stock options and the very strong performance of the stock market. index 10th pctile wages index 90th pctile wages index 50th pctile wages year Indexed Wages For White Males Changes in the indexed value of the 90th, 50th and 10th percentiles of the wage distribution for white males (1963 values normalized to 100).
132
133 1. CHANGES IN THE U.S. WAGE STRUCTURE residual differences residual differences 0.5 times residual diffs year Residual inequality measures for white males , and differentials from log weekly wage regressions for white males aged Most of these facts are not controversial. But there is some debate about two of those facts. (1) There is disagreement regarding when the increase in overall and residual inequality started. The March CPS and census dataunambiguouslyindicatethatitstartedinthe1970s. But May CPS data gives more ambiguous results. DiNardo, Fortin and Lemieux find that wage inequality appears to increase starting in the 1980s in the May CPS data, but the reanalysis of these data by Katz and Autor (2000) shows consistent increases in wage inequality during the 1970s from March and
134
135
136
137 THE BASIC TRENDS AND INTERPRETATION May CPS data, and from census data. So I take the starting date of the increase in overall and residual inequality to be the early 1970s. (2) Some economists claim that average and median wages haven t really fallen, but this reflects mismeasurement of the CPI, which is understating wage growth. This argument is not very convincing, however. Even in the presence of such measurement problems, unless there is an acceleration in this bias exactly around the 1970s, there is a large gap between the rate of increase of real wages before and after the 1970s. It has to be noted, however, that part of this gap is due to the increase importance of nonwage income and benefits. In fact, thanks to theincreaseinbenefits, the share of labor in national income has not fallen over this period. So whether average wages have stagnated or continued to increase in line with output growth depends on how benefits are valued relative to earnings. Finally, there is another major fact which will play an important role in the interpretation of the changes in wage inequality. There has been a remarkable increase in the supply of skills in the U.S. economy over the past sixty years, and this increase in the supply of skills accelerated starting in the early 70s. In 1939, just over 6 percent of American workers were college graduates. By 1996 this number had increased to over 28 percent. In 1939, almost 68 percent of all workers did not have a high school degree. In 1996, this number had fallen to less than 10 percent. Equally important, the rate of growth of the relative supply of skills significant the accelerated starting in the late 1960s,
138 1. CHANGES IN THE U.S. WAGE STRUCTURE 113 because of the Vietnam War draft laws, increase government support for education, and the high college enrollment rates of the baby boom cohorts. College wage premium Rel. supply of college skills.6.8 College wage premium Rel. supply of college skills year Relative Supply of College Skills and College Premium The behavior of the (log) college premium and relative supply of college skills (weeks worked by college equivalents divided by weeks worked of noncollege equivalents) between 1939 and Data from March CPSs and 1940, 1950 and 1960 censuses Permanent versus transitory inequality. An important question for certain purposes is whether the increase in inequality is permanent or transitory (temporary). For example, if it is transitory and individuals can insure against it (for example by saving and borrowing), the increase in income and earnings inequality may not correspond to an increase in utility inequality.
139 THE BASIC TRENDS AND INTERPRETATION The facts suggest that there is also an increase in the transitory component of earnings inequality, meaning that earnings fluctuations of workers around their permanent earnings levels are now greater. This fact was first noted by Gottschalk and Moffit. They document this fact by fitting an age-earnings profile for each individual, and then studying fluctuations of their incomes around this trend. The same pattern seems to arise both in the PSID and the CPS, and also can be seen in the UK. A word of interpretation is necessary here, because the increase in the temporary component of inequality is often misinterpreted. Such an increase in temporary earnings inequality may result from two distinct causes: (1) a given worker may move up and down more frequently (greater churning in the labor market); (2) a worker may move up and down the same amount, but the movements may be bigger. Mathematically, imagine the worker s permanent earnings level is w 0, but every period, with probability p he may get lower earnings, w l, and with probability q, higher earnings, w h. The two distinct causes correspond to changes in the probabilities p and q, andtochangesin earnings levels w l and w h. A closer look at the data indicates that all of the increase in the temporary earnings inequality is due to the second cause. For example, there is no greater movement of workers between different deciles of the wage distribution.
140 1. CHANGES IN THE U.S. WAGE STRUCTURE 115 This in fact makes a lot of sense. The leading interpretation of the fluctuations of a given worker s wages is that his skills are fluctuating over time (or the perception of the market regarding his skills are changing, for example as in Jovanovic s model). So we have w 0 = ws 0 where w is the market price of skills and s 0 is his regular skill level. We also have w h = ws h and w l = ws l. If there is an increase in wage inequality corresponding to a greater skill premium, w, this will translate into a greater wage gap between different skill levels and therefore into a greater temporary component in earnings inequality. This can all happen without a change in any of the parameters p, q, s 0 or s 1 that correspond to the likelihood and magnitude of skill level fluctuations of workers. This is important since many applied papers interpret the increase in earnings instability as reflecting greater churning. But there is basically no evidence for greater churning in the labor market. First, measures of job reallocation constructed by Davis and Haltiwanger indicate no increase in job reallocation during the past 20 or so years. Second, despite the popular perception to the contrary, there has not been a large increase in employment instability. The tenure distribution of workers today looks quite similar to what it was 20 years ago. The major exception to this seems to be middle-aged managers, who maybemorelikelytolosetheirjobstodaythan20-25yearsago Cross-country trends. We know somewhat less about changes in wage inequality in most other countries than in the U.S. But the following are now relatively well-established:
141
142 THE BASIC TRENDS AND INTERPRETATION (1) Wage inequality, both returns to schooling and residual inequality, increased significantly in the UK. (2) Wage inequality also increased somewhat in other Anglo-Saxon economies, perhaps quite markedly in New Zealand. (3) In much of continental Europe, there has been little increase in either returns to schooling or overall inequality. We return to a discussion of the possible explanations for these patterns below. 2. Interpretation I will now focus on the two major facts related to the increase in earnings inequality: the increase in the returns to schooling and increased overall and residual inequality. In this section, I will argue two things: (1) Both of these facts may be reflecting an increase in skill premia an increase in the market price of skills. (2) They are unlikely to reflect composition effects, cohort effects or anything related to signaling/selection Increase in inequality and unobserved skills. The idea that the increase in residual inequality may reflect increased skill premia is related to the idea that a large component of earnings dispersion not explained by schooling is nonetheless related to skill differences. If I am less skilled than another worker with the same education, for example, or because he can perform certain tasks that I cannot, the earnings inequality between us will widen when the tasks that he can
143
144
145 2. INTERPRETATION 117 perform become more valuable. In the data this will show up as increased residual inequality. This argument is put forth forcefully by Juhn, Murphy and Pierce (1993). More formally, suppose that two otherwise identical individuals differ in terms of their unobserved skills (for example, in terms of interpersonal skills, motivation, specific skills for their job, or IQ). Denote the unobserved skill of individual 1 by a 1 and that of individual 2 by a 2 >a 1, and assume that wages are given by (2.1) ln w it =2θ t a i + γ t h i, where γ t is the price of h skills at time t, while θ t is the price of a skills. Since these individuals are identical in all respects other than their unobserved skills, a, the variance of log wages (or of residual wages) among these two individuals is Var(ln w) =θ 2 t (a 2 a 1 ) 2. Now if at a later date, t 0, this variance increases to Var(ln w) 0,andwe know that these two individuals are still identical in all other respects and that a 2 a 1 has not changed, we can interpret the increase in Var(ln w) as reflecting an increase in the price of unobserved skills, θ t. In other words, if we ignore composition effects, which here correspondent to changes in a 2 a 1,thisincreasemustbeduetoariseinthe price of (and demand for) unobserved skills Composition effects. Could composition effects explain a significant component of the increase in residual and overall inequality, and also the bulk of the changes in the returns to education?
146 THE BASIC TRENDS AND INTERPRETATION First, to see the reasoning note that the increase in the returns to education may be simply the result of an increase in the average ability of workers with high education to that of workers with low education over time. This will immediately lead to an increase in the return to education. This change in relative abilities of the two groups may result from selection (for example, today different types of workers than before may be obtaining college degrees). There is no presumption that any signaling is going on here. The employers may well be observing these skill dimensions that we, as the economists, do not observe. Alternatively, these changes in relative abilities of the two groups may result from changes in signaling behavior. College education may have become a much more important signal today, because employers may expect only the very low ability workers not to obtain a college degree. Both of these explanations could potentially account for the increase in the returns to education and residual and overall inequality. However, the evidence suggests that the increase in the returns to education and residual inequality are not simply due to composition effects. Before discussing this evidence, note first that composition effects cannot by themselves explain the recent changes in inequality: composition effects suggest that inequality among educated and uneducated workers should move in opposite directions (see below). This suggests that changes in the true returns to skills have played at least some role in the changes in inequality. More generally, to get a sense of how important composition effects may be, consider a variant of equation (2.1) above with two education
147 2. INTERPRETATION 119 levels, high h =1and low h =0, and suppose wages are given by (2.2) ln w it = a i + γ t h i + ε it where h i is a dummy for high education, a i is unobserved ability, and ε it is a mean zero disturbance term. Define the (log) education premium the difference between the average wages of high and low education workers as: ln ω t E (ln w it h i =1) E (ln w it h i =0)=γ t + A 1t A 0t where A 1t E (a i h i =1)and A 0t E (a i h i =0). The increase in the education premium can be caused by an increase in γ t (a true increase in the returns to skills) or an increase in A 1t A 0t.Thereare basically two reasons for an increase in A 1t A 0t : (1) changes in cohort quality, or (2) changes in the pattern of selection into education. Consider changes in cohort quality first. If, as many claim, the U.S. high school system has become worse, we might expect a decline in A 0t without a corresponding decline in A 1t. As a result, A 1t A 0t may increase. Alternatively, as a larger fraction of the U.S. population obtains higher education, it is natural that selection into education (i.e., the relative abilities of those obtaining education) will change. It is in fact possible that those who are left without education could have very low unobserved ability, which would translate into a low level of A 0t,and therefore into an increase in A 1t A 0t. Although these scenarios are plausible, theoretically the opposite can happen as well. For example, many academics who have been involved in the U.S. education system for a long time complain about
148 THE BASIC TRENDS AND INTERPRETATION the decline in the quality of universities, while the view that American high schools have become much worse is not shared universally. The selection argument is also more complicated than it first appears. It is true that, as long as those with high unobserved abilities are more likely to obtain higher education, an increase in education will depress A 0t! But it will also depress A 1t. To see why assume that there is perfect sorting i.e., if an individual with ability a obtains education, all individuals with ability a 0 >awill do so as well. In this case, there will exist a threshold level of ability, a, such that only those with a > a obtain education. a i between b 0 and b 0 + b 1. Then, A 0 = 1 a b 0 and Next consider a uniform distribution of Z a ada = a + b 0 b 0 2 Z 1 b0 +b 1 A 1 = ada = b 0 + b 1 + a b 1 b 0 a a 2 So both A 0 and A 1 will decline when a decreases to a 0. Moreover, A 1 A 0 = b 1 /2, soitisunaffected by the decline in a. Intuitively, with a uniform distribution of a i,whena increases, both A 0 and A 1 fall by exactly the same amount, so the composition effects have no influence on the education premium. Clearly, with other distributions of ability, this extreme result will no longer hold, but it remains true that both A 0 and A 1 will fall, and whether this effect will increase or decrease the education premium is unclear. Overall, therefore, the effects of changes in composition on education premia is an empirical question Evidence on composition effects. Empirically, the importance of composition effects can be uncovered by looking at inequality
149 2. INTERPRETATION 121 changes by cohort (e.g. Blackburn, Bloom and Freeman, or Juhn, Murphy and Pierce). To see this, rewrite equation (2.2) as (2.3) ln w ict = a ic + γ t h ic + ε cit where c denotes a cohort i.e., a group of individuals who are born in the same year, or a group of individuals who have come to the market in the same year. I have imposed an important assumption in writing equation (2.3): returns to skills are assumed to be the same for all cohorts and ages; γ t though clearly they vary over time. We can now define cohort specific education premia as ln ω ct E (ln w ict h i =1) E (ln w ict h i =0)=γ t + A 1ct A 0ct where A 1ct E (a ic h i =1)and A 0ct is defined similarly. Under the additional assumption that there is no further schooling for any of the cohorts over the periods under study, we have ln ω ct = γ t + A 1c A 0c, which implies (2.4) ln ω c,t 0 t ln ω ct 0 ln ω ct = γ t 0 γ t, i.e., changes in the returns to education within a cohort will reveal the true change in the returns to education. The assumption that returns to skills are constant over the lifetime of an individual may be too restrictive, however. As we saw above, there are quite different age earning profiles by education. Nevertheless, a similar argument can be applied in this case too. For example, suppose ln ω cst = γ st + A 1c A 0c
150 THE BASIC TRENDS AND INTERPRETATION for cohort c of age s in year t, andthat γ st = γ s + γ t (this assumption is also not necessary, but simplifies the discussion). Then ln ω c,t 0 t = γ s 0 γ s + γ t 0 γ t, where obviously s 0 s = t 0 t. Nowconsideradifferent cohort, c 00 that is age s 0 in the year t and age s in the year t 00.Then ln ω c 00,t t 00 = γ s γ 0 s + γ t γ t 00 So, the true change in the returns to skills between the dates t 00 and t 0 is (2.5) 2 ln ω ln ω c,t 0 t ln ω c 00,t t 00 = γ t γ 0 t 00. The evidence using this approach indicates that there are large positive changes in the returns to a college degree or this time period. Juhn, Murphy and Pierce (1993) apply similar methodology to the increase in overall and residual inequality. They also find that these changes cannot be explained by composition effects either. These results suggest that the changes in the structure of wages observed over the past 30 years cannot be explained by pure composition effects, and reflect mainly changes in the true returns to observed and unobserved skills.
151
152 CHAPTER 6 The Basic Theory of Skill Premia The simplest framework for thinking about skill premia (returns to schooling and returns to other skills) starts with a supply-demand framework. The demand for skills is often thought to be generated by the technology possibilities frontier of the economy, but is also affected by international trade, and perhaps by the organization of production. 1. The Constant Elasticity of Substitution Framework 1.1. The aggregate production function. Let me start with thesimplestframeworkwheretherearetwotypesofworkers,skilled and unskilled (high and low education workers), who are imperfect substitutes. Imperfect substitution between the two types of workers is important in understanding how changes in relative supplies affect skill premia. For now, let us think of the unskilled workers as those with a high school diploma, and the skilled workers as those with a college degree, so the terms skill and education will be used interchangeably. In practice, however, education and skills are imperfectly correlated, so it is useful to bear in mind that since there are skilled and unskilled workers within the same education group, an increase in the returns to skills will also lead to an increase in within-group inequality. Suppose that there are L (t) unskilled (low education) workers and H (t) skilled (high education) workers, supplying labor inelastically at 123
153 THE BASIC THEORY OF SKILL PREMIA time t. All workers are risk neutral, and maximize (the present value of) labor income. Also suppose that the labor market is competitive. The production function for the aggregate economy takes the form the constant elasticity of substitution (CES) form, (1.1) Y (t) =[(A l (t) L (t)) ρ +(A h (t) H (t)) ρ ] 1/ρ, where ρ 1. I also ignore capital. I drop the time argument when this causes no confusion. The elasticity of substitution between skilled and unskilled workers in this production function is σ 1/ (1 ρ). Skilled and unskilled workers are gross substitutes when the elasticity of substitution σ > 1 (or ρ > 0), and gross complements when σ < 1 (or ρ < 0). Three noteworthy special cases are: (1) σ 0 (or ρ ) when skilled and unskilled workers will be Leontieff, and output can be produced only by using skilled and unskilled workers in fixed portions; (2) σ when skilled and unskilled workers are perfect substitutes (3) σ 1, when the production function tends to the Cobb Douglas case. The value of the elasticity of substitution will play a crucial role in the interpretation of the results that follow. In particular, in this framework, technologies either increase the productivity of skilled or unskilled workers, i.e., there are no explicitly skill-replacing or unskilledlabor-replacing technologies. Depending on the value of the elasticity
154 1. THE CONSTANT ELASTICITY OF SUBSTITUTION FRAMEWORK 125 of substitution, an increase in A h can act either to complement or to replace skilled workers. As a little digression, at this point we can note that a more general formulation would be Y (t) =[(1 b t )(A l (t) L (t)+b l (t)) ρ + b t (A h (t) H (t)+b h (t)) ρ ] 1/ρ, where B l and B h would be directly unskilled-labor and skill-replacing technologies, and an increase in b t would correspond to some of the tasks previously performed by the unskilled being taken over by the skilled. For most of the analysis here, there is little to be gained from this more general production function. The production function (1.1) admits three different interpretations. 1. There is only one good, and skilled and unskilled workers are imperfect substitutes in the production of this good. 2. The production function (1.1) is also equivalent to an economy where consumers have utility function [Y ρ l + Y ρ h ]1/ρ defined over two goods. Good Y h is produced using only skilled workers, and Y l is produced using only unskilled workers, with production functions Y h = A h H,andY l = A l L. 3. A mixture of the above two whereby different sectors produce goods that are imperfect substitutes, and high and low education workers are employed in all sectors. Although the third interpretation is more realistic, I generally use one of the first two, as they are easier to discuss.
155 THE BASIC THEORY OF SKILL PREMIA Since labor markets are competitive, the unskilled wage is (1.2) w L = Y L = Aρ l [Aρ l + Aρ h (H/L)ρ ] (1 ρ)/ρ. This equation implies w L / H/L > 0: as the fraction of skilled workers in the labor force increases, the wages of unskilled workers should increase. Similarly, the skilled wage is w H = Y H = Aρ h A ρ l (H/L) ρ + A ρ (1 ρ)/ρ h, which yields w H / H/L < 0; everything else equal, as skilled workers become more abundant, their wages should fall. Combining these two equations, the skill premium the wage of skilled workers divided by the wage of unskilled workers is (1.3) ω = w H w L = µ Ah A l ρ µ (1 ρ) H = L µ Ah A l (σ 1)/σ µ 1/σ H. L Equation (1.3) can be rewritten in a more convenient form by taking logs, (1.4) ln ω = σ 1 σ ln µ Ah A l 1 µ H σ ln L Naturally, the skill premium increases when skilled workers become more scarce, i.e.,. (1.5) ln ω ln H/L = 1 σ < 0. This is the usual substitution effect, and shows that for given skill bias of technology, ascapturedbya h /A l, the relative demand curve for skill is downward sloping with elasticity 1/σ =(1 ρ). Intuitively, an increase in H/L can create two different types of substitutions.
156 1. THE CONSTANT ELASTICITY OF SUBSTITUTION FRAMEWORK 127 Skill premium ω Relative supply of skills ω ω Relative demand for skills Skill-biased tech. change H/L H /L The relative demand for skills. (1) if skilled and unskilled workers are producing the same good, but performing different functions, an increase in the number of skilled workers will necessitate a substitution of skilled workers for tasks previously performed by the unskilled. (2) if skilled and unskilled workers are producing different goods (because they have different comparative advantages making them useful in different sectors), the greater number of skilled workers will lead to a substitution of the consumption of the unskill-intensive good by the skill-intensive good. In both
157 THE BASIC THEORY OF SKILL PREMIA cases, this substitution hurts the relative earnings of skilled workers Relative supply of skills, technology, and the skill premium. An interesting case study of the response of the returns to schooling to an increase in the supply of skills is provided by the experience in the West Bank and Gaza Strip during the 1980s. As Angrist (1995) illustrates, there was a very large increase in the supply of skilled Palestinian labor as there opened Palestinian institutions of higher education, which were totally absent before Angrist shows that premia to college graduate workers (relative to high school graduates) that were as high as 40 percent quickly fell to less than 20 percent. The extent of substitution was also clear. First, many college graduate workers could not find employment in skilled jobs. Angrist (1995) shows a sharp increase in the unemployment rate of college graduates, and Schiff and Yaari (1989) report that only one in eight Palestinian graduates could find work in his profession, with the rest working as unskilled laborers, mainly in the construction industry. Second, premia for tasks usually performed by more educated workers fell sharply. Between 1984 and 1987, the premium for administrative and managerial jobs (relative to manual laborers) fell from.32 to.12, while the premium for clerical workers fell from.02 to -.08 (see Angrist, 1995, for details). As equation (1.5) shows, the elasticity of substitution, σ, regulates the behavior of the skill premium in response to supply changes. The elasticity of substitution is also crucial for the response of the skill
158 1. THE CONSTANT ELASTICITY OF SUBSTITUTION FRAMEWORK 129 premium to changes in technology. Unfortunately, this parameter is rather difficult to estimate, since it refers to an elasticity of substitution that combines substitution both within and across industries. Nevertheless, there are a number of estimates using aggregate data that give a range of plausible values. The majority of these estimates are between σ =1and 2. The response of college premium for Palestinian labor reported in Angrist (1995), for example, implies an elasticity of substitution between workers with 16 years of schooling and those with less than 12 of schooling of approximately σ =2. How does the skill premium responds to technology? Differentiation of (1.4) shows that the result depends on the elasticity of substitution. If σ > 1 (i.e., ρ (0, 1]), then ω A h /A l > 0, i.e., improvements in the skill-complementary technology increase the skill premium. Diagrammatically, this can be seen as a shift out of the relative demand curve, which moves the skill premium from ω to ω 00. The converse is obtained when σ < 1: that is, when σ < 1, an improvement in the productivity of skilled workers, A h, relative to the productivity of unskilled workers, A l, shifts the relative demand curve in and reduces the skill premium. This case appears paradoxical at first, but is, in fact, quite intuitive. Consider, for example, a Leontieff (fixed proportions) production function. In this case, when A h increases and skilled workers become more productive, the demand for unskilled workers, who are necessary to produce more output by working with the more productive
159 THE BASIC THEORY OF SKILL PREMIA skilled workers, increases by more than the demand for skilled workers. In some sense, in this case, the increase in A h is creating an excess supply of skilled workers given the number of unskilled workers. This excess supply increases the unskilled wage relative to the skilled wage. This observation raises an important caveat. It is tempting to interpret improvements in technologies used by skilled workers, A h, as skill-biased. However, when the elasticity of substitution is less than 1, it will be advances in technologies used with unskilled workers, A l,thatincreasetherelativevalueovermarginalproductandwages of skilled workers, and an increase in A h relative to A l will be skillreplacing. Nevertheless, the conventional wisdom is that the skill premium increases when skilled workers become relatively more not relatively less productive, which is consistent with σ > 1. In fact, as noted above, most estimates show an elasticity of substitution between skilled and unskilled workers greater than 1. It is also useful to compute average wages in this economy. Without controlling for changes in the educational composition of the labor force, the average wage is (1.6) w = Lw L + Hw H L + H = [(A ll) ρ +(A h H) ρ ] 1/ρ, 1+H/L which is also increasing in H/L as long as the skill premium is positive (i.e., ω > 1 or A ρ h (H/L)ρ A ρ l > 0). Intuitively, as the skill composition of the labor force improves, wages will increase Summary. The results I have outlined so far imply that in response to an increase in H/L:
160 2. WHY TECHNICAL CHANGE MUST HAVE BEEN SKILL BIASED? Relative wages of skilled workers, the skill premium ω = w H /w L, decreases. 2. Wages of unskilled workers increase. 3. Wages of skilled workers decrease. 4. Average wages (without controlling for education) rise. These results can be easily generalized to the case in which physical capital also enters the production function, of the form F (A l L, A h H, K) and the same comparative statics hold even when the economy has an upward sloping supply of capital. It is also useful to highlight the implications of an increase in A h on wage levels. First, an increase in A h,witha l constant, corresponds to an increase in A h /A l ; the implications of this change on the skill premium were discussed above. Moreover if A h increases, everything else being equal, we expect both the wages of unskilled and skilled workers (and therefore average wages) to increase: technological improvements always increase all wages. This observation is important to bear in mind since, as shown above, the wages of low-skill workers fell over the past 30 years. 2. Why Technical Change Must Have Been Skill Biased? The most central result for our purposes is that as H/L increases, the skill premium, ω, should fall. Diagrammatically, the increase in supply corresponds to a rightward shift in the vertical line from H/L to H 0 /L 0, which would move the economy along the downward sloping demand curve for skills. But this tendency of the skill premium to
161 THE BASIC THEORY OF SKILL PREMIA fall could be counteracted by changes in technology, as captured by σ 1 ln(a σ h/a l ). As discussed above, the past 60 years, and particularly the past 30 years, have witnessed a rapid increase in the supply of skills, H/L, but no corresponding fall in the skill premium. This implies that demand for skills must have increased to prevent the relative wages of skilled workers from declining. The cause for this steady increase in the demand for skills highlighted by this simple framework is skill-biased technical change. More explicitly, the relative productivity of skilled workers, (A h /A l ) (σ 1)/σ, must have increased. The increase in (A h /A l ) (σ 1)/σ can be interpreted in a number of different ways. In a two-good economy, such skill-biased technical change corresponds to an increase in A h /A l and ρ > 0 (σ > 1) i.e., skilled workers become more productive. Skill-biased technical change could also take the form of a decrease in A h /A l and ρ < 0 (σ < 1). In this case the physical productivity of unskilled workers would increase, but their relative wages would fall due to relative price effects. Alternatively, with the one-good interpretation, skill-biased technical change simply corresponds to an increase in (A h /A l ) (σ 1)/σ. If we assume a specific valueforσ, we can translate these numbers into changes in A h /A l to get a sense of the magnitude of the changes. In particular, notice that the relative wage bill of skilled workers is given by (2.1) S H = w HH w L L = µ Ah A l (σ 1)/σ µ (σ 1)/σ H. L
162 2. WHY TECHNICAL CHANGE MUST HAVE BEEN SKILL BIASED? 133 Hence, we have (2.2) A h A l = Sσ/(σ 1) H H/L. We can easily calculate the implied A h /A l values for σ =1.4 and for σ =2using workers with some college, college graduates, and college equivalents definitions of Autor, Katz and Krueger (1998). In all cases, there is a very large implied increase in A h /A l and (A h /A l ) (σ 1)/σ. For example, these numbers indicate that, assuming an elasticity of substitution of 1.4, the relative productivity of college graduates, A h /A l,was approximately in 1960, increased to in 1970, and to in Between 1980 and 1990, it increased by a factor of almost three to reach As equation (1.4) shows, changes in the demand index D =(A h /A l ) σ 1 σ may be more informative than changes in A h /A l. The view that the post-war period is characterized by skill-biased technical change also receives support from the within-industry changes in employment patterns. With constant technology, an increase in the relative price of a factor should depress its usage in all sectors. Since the college premium increased after 1979, with constant technology, there should be fewer college graduates employed in all sectors and the sectoral composition should adjust in order to clear the market. The evidence is very much the opposite. Berman, Bound and Griliches (1994) and Murphy and Welch (1993) show a steady increase in the share of college labor in all sectors.
163 THE BASIC THEORY OF SKILL PREMIA This discussion therefore suggests that the past sixty years must have been characterized by skill-biased technical change. Note however that the presence of steady skill-biased technical change does not offer an explanation for rise in inequality over the past 25 years, since we are inferring that technical change has been skill biased for much longer than these decades, and inequality was stable or even declining during the decades before the 1970s. Moreover, skill-biased technical change by itself is not enough for inequality and skill premia to increase. It will only need to increase in inequality when it outpaces the increase in the relative supply of skills. We will discuss this topic in more detail below.
164 CHAPTER 7 Non-Technological Explanations For the Changes inthewagestructure Armed with a simple framework for analyzing returns to schooling and skill premia, we can now discuss what the potential causes of the changes in the way structures could be. In this section, I start with three non-technological explanations. In the next section, I will discuss theories where the increase in wage and earnings inequality may reflect changes in technologies. By non-technological explanations I do not mean explanations in which technology plays no role, but simply that there hasn t been anything unusual in the technology front. Instead some other changes are responsible for the transformation of the wage structure. The three explanations I will discuss are: (1) The steady-demand hypothesis. According to this view, there has been no major change in the structure of technology, and therefore in the structure of demand for skills. Changes in the returns to schooling and skill premium can be explained by the differential rates of growth in the supply of skills. 135
165 NON-TECHNOLOGICAL EXPLANATIONS FOR THE CHANGES IN THE WAGE STRUCTURE (2) The trade hypothesis. According to this view, the increase in international trade, especially trade with less-developed countries, is responsible for the (unusual) increase in the demand for skills over the past twenty-five years. (3) The labor-market institutions hypothesis. This view assigns changes in the wage structure to the decline of unions, the erosion of the real value of the minimum wage and more generally, to changes in labor market regulations. Throughout, it is useful to bear in mind that the leading alternative to the non-technology models is a view which sees an acceleration in the skill bias of technology, or some unusual technological developments affecting the demand for skills. So I will be sometimes explicitly or implicitly comparing these three non-technological hypotheses to the technology view 1. The Steady-Demand Hypothesis In a simple form, this hypothesis can be captured by writing µ Ah (t) (1.1) ln = γ A l (t) 0 + γ 1 t, where t is calendar time. Substituting this equation into (1.4), we obtain (1.2) ln ω = σ 1 σ γ 0 + σ 1 σ γ 1t 1 µ H σ ln. L According to equation (1.2), the demand for skills increases at a constant rate, but the supply of skilled workers could grow at different rates. Therefore, changes in the returns to skills are caused by uneven growth in the supply of skills. When H/L grows faster than the rate of
166 1. THE STEADY-DEMAND HYPOTHESIS 137 skill-biased technical change, (σ 1) γ 1, the skill premium will fall, and when the supply growth falls short of this rate, the skill premium will increase. The story has obvious appeal since the 1970s, when returns to schooling fell sharply, were a period of faster than usual increase in the supply of college graduate workers. In contrast, the 1980s were a period of slow increase in the supply of skills relative to the 1970s. Katz and Murphy (1992) estimate a version of equation (1.2) above using aggregate data between They find ln ω = t 0.71 ln H L (0.01) (0.15) This approach does fairly well in capturing the salient features of the changes in the college premium between 1963 and In fact, Katz and Murphy show that the predicted values from the above equation are quite close to the observed movements in the college premium. This implies that we can think of the U.S. labor market since 1963 as characterized by an elasticity of substitution between college graduate workers and noncollege workers of about σ =1/ , andan annual increase in the demand for skills at the rate of about 3.3 percent. The increase in the college premium during the 1980s is then explained by the slowdown in the rate of growth of supply of college graduates. Nevertheless, there are a number of reasons for preferring a cautious interpretation of this regression evidence. (1) The regression uses only 25 aggregate observations, and there is significant serial correlation in the college premium. If the true data were generated by an acceleration in skill bias and a larger value of the elasticity of substitution, this regression
167 NON-TECHNOLOGICAL EXPLANATIONS FOR THE CHANGES IN THE WAGE STRUCTURE could estimate a smaller elasticity of substitution and no acceleration in the demand for skills. For example, Katz and Murphy show that if the true elasticity of substitution is σ =4, a significant acceleration in the skill bias of technical change is required to explain the data. (2) From the wage bill share data reported above, Autor, Katz and Krueger (1998) conclude that even for the range of the values for the elasticity of substitution between σ =1and 2, skill-biased technical change is likely to have been more rapid during the 1980s than the 1970s. This can also be seen in the numbers reported above, where, for most measures, the increase in (A h /A l ) σ 1 σ appears much larger between 1980 and 1990 than in other decades. So it is important to undertake a detailed analysis of whether the steady-demand hypothesis could explain the general patterns. 2. Evidence On Steady-Demand Vs. Acceleration The first piece of evidence often put forth in support of an acceleration relates to the role of computers in the labor market. Krueger (1993) has argued that computers have changed the structure of wages, and showed that workers using computers are paid more, and this computer wage premium has increased over time. Although this pattern is striking, it is not particularly informative about the presence or acceleration of skill-biased technical change. It is hard to know whether the computer wage premium is for computer skills, or whether it is
168
169 2. EVIDENCE ON STEADY-DEMAND VS. ACCELERATION 139 even related to the widespread use of computers in the labor market. For example, DiNardo and Pischke (1997), and Enhorf and Kramartz (1998) show that the computer wage premium is likely to be a premium for unobserved skills. Equally, however, it would be wrong to interpret the findings of DiNardo and Pischke (1997) and Enhorf and Kramartz (1998) as evidence against an acceleration in skill-biased technical change, since, as argued below, such technical change would increase the market prices for a variety of skills, including unobserved skills. The second set of evidence comes from the cross-industry studies of, among others, Berman, Bound and Griliches (1994), Autor, Katz and Krueger (1998), and Machin and Van Rennan (1998). These papers document that almost all industries began employing more educated workers during the 1970s and the 1980s. They also show that more computerized industries have experienced more rapid skill upgrading, i.e., they have increased their demand for college-educated workers more rapidly. For example, Autor, Katz and Krueger run regressions of changes in the college wage-bill share in three digit industries on computer use between 1984 and They find, for example, that Sc = cu (.108) (.046) Sc = cu (.196) (.081) where Sc denotes the annual change in the wage bill share of college graduates in that industry (between the indicated dates), and cu is the increase in the fraction of workers using computers in that industry between 1984 and These regressions are informative since
170 NON-TECHNOLOGICAL EXPLANATIONS FOR THE CHANGES IN THE WAGE STRUCTURE the college wage bill share is related to the demand for skills as shown by equation (2.2). The results indicate that in an industry where computer use increases by 10 percent, the college wage bill share grows by about percent faster every year between 1980 and 1990, and 0.03 percent faster in every year between 1990 and Although this evidence is suggestive, it does not establish that there has been a change in the trend growth of skill-biased technology. As pointed out in above, the only way to make sense of post-war trends is to incorporate skill-biased technical change over the whole period. Therefore, the question is whether computers and the associated information technology advances have increased the demand for skills more than other technologies did during the 1950s and 1960s, or even earlier. This question cannot be answered by documenting that computerized industries demand more skilled workers. Cross-industry studies also may not reveal the true impact of computers on the demand for skills, since industries that are highly computerized may demand more skilled workers for other reasons as well. In fact, when Autor Katz and Krueger (1998) run the above regressions for college wage bill shares, they obtain Sc = cu (.058) (.025) Therefore, industries investing more in computers during the 1980s were already experiencing more skill upgrading during the 1960s, before the arrival of computers (though perhaps slower, since the coefficient here is about half of that between 1980 and 1990). This suggests that at least part of the increase in the demand for skills coming from highly
171
172 2. EVIDENCE ON STEADY-DEMAND VS. ACCELERATION 141 computerized industries may not be the direct effect of computers, but reflect an ongoing long-run shift towards more skilled workers. In this light, faster skill upgrading by highly computerized industries is not inconsistent with the steady-demand hypothesis. The third, and probably most powerful, piece of evidence also comes from Autor, Katz and Krueger (1998). They document that the supply of skills grew faster between 1970 and 1995 than between 1940 and 1970 by 3.06 percent a year during the latter period compared to 2.36 percent a year during the earlier 30 years. In contrast, returns to college increased between 1970 and 1995 by about 0.39 percent a year, while they fell by about 0.11 percent a year during the earlier period. If demand for skills had increased at a steady pace, the skill premium should have also fallen since Moreover, Autor, Katz and Krueger (1998) document greater within-industry skill upgrading in the 1970s, 1980s and 1990s than in 1960s, which is also consistent with more rapid skill-biased technical change during these later decades. A simple regression analysis also confirms this point. A regression similar to that of Katz and Murphy for the period yields similar results: ln ω = t 0.56 ln H L, (0.01) (0.20) with an R 2 of 0.63 and an implied elasticity of substitution of 1.8, which is somewhat larger than the estimate of Katz and Murphy. However, adding higher order terms in time (i.e., time squared, time cubed, etc.) improves the fit of the model considerably, and these higher-order terms
173 NON-TECHNOLOGICAL EXPLANATIONS FOR THE CHANGES IN THE WAGE STRUCTURE are significant. The next figure shows these higher order trends, which indicate an acceleration in skill bias starting in the 1970s. linear time trend quadratic time trend cubic time trend quartic time trend year Alternative Time Trends for the Relative Demand for Skills Estimatesoftimetrendsfromregressionsofln ω on ln (H/L), year, year 2, year 3 and year 4 between 1939 and 1996 (with observations in 1939, 1949, 1959 from the decennial censuses and observations for from the March CPSs). A final piece of evidence comes from the behavior of overall and residual inequality over the past several decades. As argued above, this increase in inequality weighs in favor of a marked change in labor market prices and demand for skills. Overall, therefore, there is a variety of evidence suggesting an acceleration in skill bias over the past 25 or 30 years. Although not all evidence is equally convincing, the rise in the returns to schooling over the past 30 years, despite the very rapid increase in the supply
174 3. TRADE AND INEQUALITY 143 of skills, and the behavior of overall and residual inequality since the 1970s suggest a marked shift in the demand for skills over the past several decades. It is useful to bear in mind, however, that the unusual increase in the demand for skills might be non-technological. It might reflect effect of increased international trade with skill-scarce countries, or it may reflect the collapse of some labor market institutions. 3. Trade and Inequality 3.1. Trade and wage inequality: theory. Standard trade theory predicts that increased international trade with less developed countries (LDCs), which are more abundant in unskilled workers, should increase the demand for skills in the U.S. labor market. Therefore, the increase in international trade may have been the underlying cause of the changes in U.S. wage inequality. To discuss these issues, consider the two good interpretation of the model above. Consumer utility is defined over [Y ρ l + Y ρ h ]1/ρ,withthe production functions for two goods being Y h = A h H and Y l = A l L. Both goods are assumed to be tradable. For simplicity, let me just compare the U.S. labor market equilibrium without any trade to the equilibrium with full international trade without any trading costs. Before trade, the U.S. relative price of skill intensive goods, p h /p l, is given by (3.1) p US = p h p l = ρ 1 Ah H. A l L
175 NON-TECHNOLOGICAL EXPLANATIONS FOR THE CHANGES IN THE WAGE STRUCTURE The skill premium is then simply equal to the ratio of the marginal value products of the two types of workers, that is, (3.2) ω US = p USA h A l Next, suppose that the U.S. starts trading with a set of LDCs that have access to the same technology as given by A h and A l, but are relatively scarce in skills. Denote the total supplies of skilled and unskilled workers in the LDCs by b H and b L where b H/ b L<H/L,whichsimply reiterates that the U.S. is more abundant in skilled workers than the LDCs. After full trade opening, the product markets in the U.S. and the LDCs are joined, so there will be a unique world relative price. Since the supply of skill-intensive and labor-intensive goods are A h ³H + bh and A l ³L + bl, the relative price of the skill intensive good will be ³ (3.3) p W = A h H + H b A l ³L + bl ρ 1 >p US. The fact that p W >p US follows immediately from bh/bl <H/L. Intuitively, once the U.S. starts trading with skill-scarce LDCs, demand for skilled goods increases, pushing the prices of these goods up. Labor demand in this economy is derived from product demands. The skill premium therefore follows the relative price of skill-intensive goods. After trade opening, the U.S. skill premium increases to (3.4) ω W = p W A h A l > ω US
176 3. TRADE AND INEQUALITY 145 where the fact that ω W > ω US is an immediate consequence of p W > p US. Therefore, trade with less developed countries increases wage inequality in the U.S.. The skill premium in the LDCs will also be equal to ω W after trade since the producers face the same relative price of skill-intensive goods, and have access to the same technologies. Before trade, however, the skill premium in the LDCs was bω = bpa h /A l,wherebp = ³ A h bh/a l bl ρ 1is the relative price of skill-intensive goods in the LDCs before trade. The same argument as above implies that bp >p W,i.e., trade with the skill-abundant U.S. reduces the relative price of skillintensivegoodsintheldcs. Thisimpliesthatω W < bω; after trade wage inequality should fall in the LDCs that have started trading more with the U.S. or other OECD economies Evidence. Although this analysis shows that increased international trade could be responsible for the rise in skill premia and inequality in the U.S., most economists discount the role of trade for the reasons discussed briefly in the introduction. First, as the comparison of equations (3.2) and (3.4) shows, the effect of international trade works through a unique intervening mechanism: free trade with the LDCs increases the relative price of skillintensive goods, p, andaffects the skill premium via this channel. The most damaging piece of evidence for the trade hypothesis is that most studies suggest the relative price of skill-intensive goods did not increase over the period of increasing inequality. Lawrence and Slaughter found that during the 1980s the relative price of skill-intensive goods actually
177
178
179 NON-TECHNOLOGICAL EXPLANATIONS FOR THE CHANGES IN THE WAGE STRUCTURE fell. Sachs and Shatz found no major change or a slight decline, while a more recent paper by Krueger found an increase in the relative price of skill-intensive goods, but only for the period. Second, as pointed out above, a variety of evidence suggests that all sectors, even those producing less skill-intensive goods, increased their demands for more educated workers. This pattern is consistent with the importance of skill-biased technical change, but not with an increase in the demand for skills driven mainly by increased international trade. Third, as noted above, a direct implication of the trade view is that, while demand for skills and inequality increase in the U.S., the converse should happen in the LDCs that have started trading with the more skill-abundant U.S. economy. The evidence, however, suggests that more of the LDCs experienced rising inequality after opening to international trade. Although the increase in inequality in a number of cases may have been due to concurrent political and economic reforms, the preponderance of evidence is not favorable to this basic implication of the trade hypothesis. Finally, a number of economists have pointed out that U.S. trade withtheldcsisnotimportantenoughtohaveamajorimpacton the U.S. product market prices and consequently on wages. Krugman illustrates this point by undertaking a calibration of a simple North- South model. Katz and Murphy, Berman, Bound and Griliches and Borjas, Freeman and Katz emphasize the same point by showing that the content of unskilled labor embedded in U.S. imports is small relative to the changes in the supply of skills taking place during this period.
180 4. LABOR MARKET INSTITUTIONS AND INEQUALITY 147 These arguments suggest that increased international trade with the LDCs is not the major cause of the changes in the wage structure by itself. 4. Labor Market Institutions and Inequality Two major changes in labor market institutions over the past twenty five years are the decline in the real value of state and federal minimum wages and the reduced importance of trade unions in wage determination. Many economists suspect that these institutional changes may be responsible for the changes in the structure of the U.S. labor market. The real value of the minimum wage eroded throughout the 1980s as nominal minimum wages remained constant for much of this period. Since minimum wages are likely to increase the wages of low paid workers, this decline may be responsible for increased wage dispersion. DiNardo et al. (1995) and Lee (1999) provide evidence in support of this hypothesis. Although the contribution of minimum wages to increased wage dispersion cannot be denied, minimum wages are unlikely to be a major factor in the increase in overall inequality for a number of reasons: (1) Only a very small fraction of male workers are directly affected by the minimum wage (even in 1992, after the minimum wage hike of , only 8 percent of all workers between the ages of 18 and 65 were paid at or below the minimum wage). Although minimum wages may increase the earnings of some workers who are not directly affected, they are highly unlikely to affect the wages above the median of the wage distribution.
181 NON-TECHNOLOGICAL EXPLANATIONS FOR THE CHANGES IN THE WAGE STRUCTURE (2) The difference between the 90th percentile and the median mirrors the behavior of the difference between the median and the 10th percentile. (Perhaps with the exception of during the early 1980s when there is a more rapidincreaseininequality at the bottom of the wage distribution, most likely due to the falling real value of the minimum wage). This implies that whatever factors were causing increased wage dispersion at the top of the distribution are likely to have been the major cause of the increase in wage dispersion throughout the distribution. (3) Perhaps most importantly, the erosion in the real value of the minimum wage started in the 1980s, whereas, as shown above, the explosion in overall wage inequality began in the early 1970s. The declining importance of unions may be another important factor in the increase in wage inequality. Unions often compress the structure of wages and reduce skill premia. Throughout the postwar period in the U.S. economy, unions negotiated the wages for many occupations, even indirectly influenced managerial salaries. Unions also explicitly tried to compress wage differentials. This suggests that the decline of unions may be a major cause of the changes in the structure of wages. But once again, deunionization does not appear to be the major cause of the increase inequality. (1) Wage inequality increased in many occupations in which prices were never affected by unions (such as lawyers and doctors).
182 4. LABOR MARKET INSTITUTIONS AND INEQUALITY 149 (2) Perhaps more important, in the U.S., deunionization started in the 1950s, a period of stable wage inequality. During the 1970s, though unionization fell in the private sector, overall unionization rates did not decline much because of increased unionization in the public sector. Overall union density was approximately constant, around 30 percent of the work force, between 1960 and It was the anti-union atmosphere of the 1980s and perhaps the defeat of the Air-traffic Controllers Strike that led to the most major declines of the unions, dating the sharp declines in unionization after the rapid increase in inequality during the early 1970s. Evidence from other countries also paints a similar picture. For example, in the UK, wage inequality started its sharp increase in the mid 1970s, while union density increased until 1980 and started the rapid decline only during the 1980s. In Canada, while unionization rates increased from around 30 percent in the 1960s to over 36 percent in the late 1980s, wage inequality also increased.
183 CHAPTER 8 Acceleration in Skill Bias By the process of elimination, we have arrived at an acceleration skill bias as the most likely cause of the increase in inequality over the past years. There is also a variety of direct evidence that also suggests that the technological developments of the past 30 years may have increase the demand for skills considerably. Most observers agree that many computer-based technologies require a variety of abstract and problemsolving skills, thus increasing the demand for college education and related skills. The evidence in Autor, Katz and Krueger indicates that industries that have invested in computer technology have increased their demand for skills substantially. They also show that this correlation is not driven by some omitted factors, such as R&D investment or capital intensity. 1. Exogenous Acceleration Skill Bias Themostpopularviewintheliteratureisthatthepast25years experienced an acceleration in skill bias because of exogenous technological developments, and link these technological developments to a technological revolution, most likely associated with the microchip, the computer technology, and improvements in communications technology. 151
184 ACCELERATION IN SKILL BIAS I would like to distinguish between 3 different approaches here Black-Box exogenous acceleration. This is the simplest view, and claims that for some (unknown/exogenous) reason there has been a more rapid increase in A h /A l during this period, translating into greater skill premia. This may be linked to the introduction of computer technology, but in this view there is no explicit theory of why it would be so. In other words, new technologies just happened to be more skill-biased and increase A h /A l. The advantage of this theory is its simplicity, and the disadvantage is that by a similar approach we could explain anything that happens. So for this theory to make progress, that has to be more empirical work somehow documenting that A h /A l has increased. Cross-industry regressions that explain the demand for skills by computer investment come close to this, but are not entirely satisfactory or easy to interpret. An interesting attempt in this direction is made by Autor, Levy and Murnane. They argue that the recent increase in the skill bias is an outcome of improvements in computer technology resulting from the fact that computers substitute for routine tasks, while at the same time increasing the demand for problem-solving skills. Using data from the Dictionary of Occupational Titles and decennial censuses, they show that in industries with greater computerization, there has been a shift away from occupations specializing in routine tasks towards occupations with a heavy problem-solving component. Therefore, this approach gives some empirical content to the otherwise exogenous and hard-to-observe skill bias. It also suggests that the recent acceleration
185
186
187 1. EXOGENOUS ACCELERATION SKILL BIAS 153 in the demand for skills maybe the outcome of the nature of computers, which by construction replaced routine, easy-to-replicate tasks Capital-skill complementarity. An interesting fact uncovered by Gordon is that the relative price of equipment capital has been falling steadily in the postwar period. Moreover, this rate of decline of equipment prices may have accelerated sometime during the mid to late 1970s. Krusell, Ohanian, Rios-Rull and Violante, using this fact, argue that the demand for skills accelerated as a result of the more rapid decline in the relative price of capital equipment. They build on an idea first suggested by Griliches that capital is more complementary to skilled rather than unskilled labor. Combining this insight with the relatively rapid accumulation of equipment capital due to the decline its relative price, they offerr an explanation for why the demand for skills may have increased at a faster rate during the past 25 years than before. More explicitly, these authors consider the following aggregate production function Y = K α s hb 1 L µ +(1 b 1 ) b 2 K λe +(1 b 2 ) H λ µ/λ i (1 α)/µ where K s is structures capital (such as buildings), and K e is equipment capital (such as machines). The parameter σ 1 =1/ (1 λ) is the elasticity of substitution between equipment and skilled workers, and σ 2 =1/ (1 µ) is the elasticity of substitution between unskilled workers and the equipment-skilled worker aggregate.
188 ACCELERATION IN SKILL BIAS If σ 1 > σ 2 (i.e., µ>λ), equipment capital is more complementary to skilled workers than unskilled workers, and as a result, an increase in K e will increase the wages of skilled workers more than the wages of unskilled workers. The skill premium in this model is ω = w H = (1 b 2)(1 b 1 ) H λ 1 b2 Ke λ +(1 b 2 ) H λ (µ λ)/λ w L b 1 L µ 1 Differentiation shows that as long as µ>λ, ω/ K e > 0. So provided that equipment capital is more complementary to skilled workers than unskilled workers, an increase in the quantity of equipment capital will increase the demand for skills. Since the post-war period has been characterized by a decline in the relative price of equipment goods, there will be an associated increase in the quantity of equipment capital, K e, increasing the demand for skills steadily.
189 1. EXOGENOUS ACCELERATION SKILL BIAS 155 Log rel. price of equip. capital Post 1974 trend Pre 1974 trend Log relative price of equipment capital year The behavior of the log relative price of equipment capital, Nevertheless, there are serious difficulties in adjusting capital prices for quality. This suggests that we may want to be cautious in interpreting this evidence. Another problem comes from the fact that, as I will discuss in more detail below, a variety of other evidence does not support the notion of faster technological progress since 1974, which is a basic tenet of this approach. Finally, one would presume that if, in fact, the decline in the relative price of equipment capital is related to the increase in the demand for skills, then in a regression of equation (1.2) as in the work by Katz and Murphy (1992), it should proxy for the demand for skills and perform better than a linear time trend.
190 ACCELERATION IN SKILL BIAS But, the evidence suggests that the relative quantity of equipment capital or its relative price never does as well as a time trend. When entered together in a time-series regression, the time trend is significant, while there is no evidence that the relative price of equipment capital matters for the demand for skills. This evidence casts some doubt on the view that the relative price of equipment capital is directly linked to the demand for skills and that its faster decline since 1970s indicates an acceleration in skill bias Technological revolutions and the Schultz view of human capital. Recall that according to Schultz/Nelson-Phelps view of human capital, skills and ability are more useful at times of rapid change (at times of disequilibrium as Schultz called it). So if indeed there has been a technological revolution, we might expect this may have increased the demand for skills. This view has been advanced by a number of authors, including Greenwood and Yorukoglu (1997), Caselli (1999), Galor and Moav (2000). For example, Greenwood and Yorukoglu (1997, p. 87) argue: Setting up, and operating, new technologies often involves acquiring and processing information. Skill facilitates this adoption process. Therefore, times of rapid technological advancement should be associated with a rise in the return to skill. Let me give a brief formalization of this approach built on Galor and Moav (2000) adapted to the above framework. Suppose that in
191 1. EXOGENOUS ACCELERATION SKILL BIAS 157 terms of the CES framework developed above (1.1) A l = φ l (g)a and A h = φ h a where a is a measure of aggregate technology, and g is the growth rate of a, i.e., g ȧ/a. The presumption that skilled workers are better equipped to deal with technological progress can be captured by assuming that φ 0 l < 0. Galor and Moav (2000) refer to this assumption as the erosion effect, since it implies that technical change erodes some of the established expertise of unskilled workers, and causes them to benefit less from technological advances than skilled workers do. Substituting from (1.1) into (1.3), the skill premium is (1.2) ω = w H w L = µ Ah A l (σ 1)/σ µ 1/σ µ (σ 1)/σ µ 1/σ H φh H =. L φ l (g) L Therefore, as long as φ 0 l < 0, more rapid technological progress, as captured by a higher level of g, will increase the skill premium. This approach therefore presumes that the recent past has been characterized by faster than usual technological progress, and explains the acceleration in skill biass by the direct effectofmorerapidstechnical change on the demand for skills Are we in the midst of a technological revolution? This is not an easy question to answer, but a relevant one to judge many of the theories discussed in this section. Here I will simply give my own view, which is: no. There is little direct evidence that the decades between 1970 and 1995 have been a period of rapid technical change. First, this period
192 ACCELERATION IN SKILL BIAS has experienced sluggish TFP and output growth relative to earlier periods. Although some authors argue that the slow TFP growth itself may be an outcome of the more rapid technical change, this is not entirely convincing. According to this argument, new revolutionary technologies first reduce productivity growth as firms and workers spend their time learning to use these technologies. Relatedly, following a suggestion by Griliches, many have argued that our ability to measure TFP growth may have deteriorated following a change in technological regime. Neither of these arguments are very convincing, however. It is difficult to imagine how a new and radically more profitable technology will first lead to twenty five years of substantially slower growth. Although, in an influential paper, Paul David (1990) argues that the spread of electricity to American manufacturing was also slow and productivity gains from electrification were limited until the 1920s, the parallel with the recent productivity slowdown should not be overstated. (1) Though productivity growth from electrification was sluggish during the early 1900s, the U.S. economy overall had a much higher level of output growth than growth levels experienced over the past three decades. Output growth between 1899 and 1909 in the U.S. economy was 4.2 percent a year, while between 1909 and 1919, it was 3 percent, and between 1990 and 1929, output grew by 3.6 percent a year. (2) As noted by Oliner and Sichel (1994), computers and other advanced office equipment have only been a trivial part of the aggregate capital stock of the U.S. economy until the mid
193 1. EXOGENOUS ACCELERATION SKILL BIAS s. It is therefore unlikely that the whole of the U.S. economy has been adapting to the changes in this relatively small part of the capital stock (3) As shown by Brendt, Morrison and Rosenblum (1994), more computerized sectors did not perform any better in terms of labor productivity growth over this period, and this pattern is also difficult to reconcile with a computer-led technological revolution. Finally, it is not even the case that historical evidence supports the notion that times of rapid technical change increase inequality. The major technological changes of the nineteenth century appear to have been largely unskilled-biased and to have reduced inequality, even though they seem as radical as computer technology. This suggests that it is the skill bias of technology, not merely its rapid arrival, that is important for the demand for skills. A final problem for all of the approaches based exogenous technological developments is the coincidence in the timing of this change, and the rapid increase in the supply of skilled workers. Recall that there was a very large increase in the supply of college graduate workers during the late 1960s and early 1970s. So the acceleration in skill bias is either concurrent with, or immediately follows, this large increase in the supply of skills. There is no a priori reason to expect the acceleration in skill bias to coincide with the rapid increase in the supply of skills. Those who want to subscribe to the exogenous technological progress view have to explain this as a chance event.
194 ACCELERATION IN SKILL BIAS 2. Endogenous Acceleration in Skill Bias The theories discussed so far presume technical change to be skillbiased by nature. Adifferent perspective is to link the type of technologies that are developed and adopted to (profit) incentives. The basic idea is that the development of skill-biased technologies will be more profitable when they have a larger market size i.e., when there are more skilled workers. Therefore, the equilibrium degree of skill bias, which will be determined endogenously, could be an increasing function of the relative supply of skilled workers. An increase in the supply of skills will then lead to skill-biased technical change. Furthermore, an acceleration in the supply of skills can lead to an acceleration in the demand for skills A basic model. Imagine that the production functions above are modified to: (2.1) Y L = 1 1 β and (2.2) Y H = 1 1 β µz NL 0 µz NH 0 x L (j) 1 β dj L β, x H (j) 1 β dj H β, where x L (j) and x H (j) denote machines used in the production of the labor-intensive and skill-intensive goods. This formulation with the use of these machines replaces the exogenous technology terms A l and A h above. N L and N H denote the range of machines that can be used in these two sectors. As is standard in Dixit-Stiglitz-type models (for example endogenous technical change models), these ranges of machines will
195 2. ENDOGENOUS ACCELERATION SKILL BIAS 161 be measures of productivity in the two sectors. Therefore, change in N H /N L will change the skill bias of technology. Assume that machines to both sectors are supplied by technology monopolists. Each monopolist sets a rental price χ L (j) or χ H (j) for the machine it supplies to the market. The marginal cost of production is the same for all machines and equal to ψ 1 β in terms of the final good. Price taking by the producers of the labor-intensive goods implies Z NL (2.3) max p LY L w L L χ L (j) x L (j) dj, L,{x L (j)} 0 This gives machine demands as 1/β pl (2.4) x L (j) = L. χ L (j) Similarly 1/β ph (2.5) x H (j) = H, χ H (j) Since the demand curve for machines facing the monopolist, (2.4), is iso-elastic, the profit-maximizing price will be a constant markup over marginal cost. In particular, all machine prices will be given by χ L (j) =χ H (j) =1. Profits of technology monopolists are obtained as (2.6) π L = βp 1/β L L and π H = βp 1/β H H. Let V H and V L be the net present discounted values of new innovations. Then in steady state: (2.7) V L = βp1/β L L r and V H = βp1/β H r H.
196 ACCELERATION IN SKILL BIAS The greater is V H relative to V L, the greater are the incentives to develop H-complementary machines, N H,ratherthanN L. This highlights the two effects on the direction of technical change that I mentioned above: (1) The price effect: a greater incentive to invent technologies producing more expensive goods. (2) The market size effect: a larger market for the technology leads to more innovation. The market size effect encourages innovation for the more abundant factor. Substituting for relative prices, relative profitability is (2.8) V H V L = µ 1 γ γ ε σ µ N H N L 1 σ µ H L σ 1 σ. where σ ε (ε 1) (1 β). is the (derived) elasticity of substitution between the two factors. When V H /V L there will be more research towards inventing new skill-complementary varieties, and N H /N L will increase. This is the essence of the model of endogenous skill bias. Greater profitability of skill-complementary technologies leads to more innovations that are skill complementary. As discussed above, in the case of substitution between skilled and unskilled workers, a high elasticity is reasonable. So here I presume that σ > 1. Then equation (2.8) immediately implies that the higher relative supply of skills, H/L, increases V H /V L, and via this channel, it induces an increase in N H /N L, creating skill-biased technical change. Also note that relative factor prices are
197 2. ENDOGENOUS ACCELERATION SKILL BIAS 163 (2.9) w H w L = p 1/β N H N L = µ 1 γ γ ε σ µ N H N L σ 1 σ µ 1 H σ. L First, the relative factor reward, w H /w L, is decreasing in the relative factor supply, H/L, this is simply the usual substitution effect, making the short-run (exogenous-technology) relative demand for for skills downward sloping. Second, greater H/L leadstoagreatern H /N L,whichisbiased toward skilled workers, and therefore increases w H /w L. In other words, an increase in the relative supply of skills causes skill-biased technical change. Next, the question is whether this induced skill bias effect could be strong enough to outweigh the substitution effect, and lead to an upward sloping relative demand curve. To answer this question, we need to specify the production function for the creation of new varieties of machines. Suppose that new varieties are created as follows: (2.10) Ṅ L = η L X L and Ṅ H = η H X H, where X denotes R&D expenditure. This gives the following technology market clearing condition: (2.11) η L π L = η H π H. Then, relative physical productivities can be solved for (2.12) N H N L = η σ µ 1 γ γ ε µ σ 1 H. L
198 ACCELERATION IN SKILL BIAS Substituting for (2.12) into (2.9), endogenous-technology factor rewards are obtained as (2.13) w H w L = η σ 1 µ 1 γ γ ε µ σ 2 H. L Comparing this equation to the relative demand for a given technology, we see that the response of relative factor rewards to changes in relative supply is always more elastic in (2.13) than in (2.9). This is simply an application of the LeChatelier principle, which states that demand curves become more elastic when other factors adjust that is, the relative demand curves become flatter when technology adjusts. The more important and surprising result here is that if σ is sufficiently large, in particular if σ > 2, the relationship between relative factor supplies and relative factor rewards can be upward sloping Implications. If σ > 2, then the long-run relationship between the relative supply of skills and the skill premium is positive. Why is this interesting? Three important facts about demand for skills are: (1) Secular skill-biased technical change increasing the demand for skills throughout 20th century. (2) Possible acceleration in skill-biased technical change over the past 25 years. (3) Many skill-replacing technologies during the 19th century.
199 2. ENDOGENOUS ACCELERATION SKILL BIAS 165 With an upward sloping relative demand curve, or simply with the degree of skilled bias endogenized, we have a natural explanation for all of these patterns. (1) The increase in the number of skilled workers that has taken place throughout 20th century is predicted to cause steady skill-biased technical change. (2) Acceleration in the increase in the number of skilled workers over the past 25 years is predicted to induce an acceleration in skill-biased technical change. (3) Large increase in the number of unskilled workers available to be employed in the factories during the 19th century could be expected to induce skill-replacing/labor-biased technical change. In addition, this framework with endogenous technology also gives a nice interpretation for the dynamics of the college premium during the 1970s and 1980s. It is reasonable to presume that the equilibrium skill bias of technologies, N h /N l, is a sluggish variable determined by the slow buildup and development of new technologies. In this case, a rapid increase in the supply of skills would first reduce the skill premium as the economy would be moving along a constant technology (constant N h /N l )curveinthefigure. After a while the technology would start adjusting, and the economy would move back to the upward sloping relative demand curve, with a very sharp increase in the college premium. This approach can therefore explain both the decline in the college premium during the 1970s and the subsequent large surge, and relates both to the large increase in the supply of skilled workers.
200 ACCELERATION IN SKILL BIAS If on the other hand we have σ < 2, the long-run relative demand curve will be downward sloping, though again it will be shallower than the short-run relative demand curve. Then following the increase in the relative supply of skills there will be an initial decline in the skill premium (college premium), and as technology starts adjusting the skill premium will increase. But it will end up below its initial level. To explain the larger increase in the 1980s, in this case we need some exogenous skill-biased technical change. case. The next figure draws this Relative Wage Initial Rel Wage Long-run Rel Wage Short-run Response Long-run relative demand for skills Exogenous Shift in Relative Supply The dynamics of the relative wage of skilled workers in response to an increase in the supply of skills with limited endogenous skill-biased technical change.
201 3. A PUZZLE: THE DECLINE IN THE WAGES OF LOW-SKILL WORKERS A Puzzle: The Decline in the Wages of Low-Skill Workers A common shortcoming of all the pure technology approaches discussed in this section is that they do not naturally predict stagnant average wages and/or falling wages for unskilled workers. In the basic framework above, average wages should always increase when the supply of educated workers increases, and all wages should rise in response to an increase in the productivity of skilled workers, A h.yet, overthepast30yearsthewagesoflow-skillworkershavefalleninreal value during, which contrasts with their steady increase in the 30 years previous Basic issues. Models of faster technological progress would naturally predict that unskilled workers should benefit fromthisfaster progress. The endogenous technology approach discussed above, on the other hand, predicts that there may be no improvements in the technologies for unskilled workers for an extended period of time because skill-biased innovations are more profitable than labor-complementary innovations. Yet in that case, their wages should be stagnant, but not fall. Some of the studies mentioned above have suggested explanations for the fall in the wages of low-skill workers. For example, recall that Galor and Moav (2000) argue that faster technological change creates an erosion effect, reducing the productivity of unskilled workers. Using equation (1.2) from above, in the simplified version of their model discussed above, the wages of unskilled workers is w L = φ l (g) a [1 + φ ρ h (H/L)ρ ] (1 ρ)/ρ, so the rate of growth of unskilled wages
202 ACCELERATION IN SKILL BIAS will be ẇ L /w L = g (1 + ε φ ),whereε φ is the elasticity of the φ l function which is negative by the assumption that φ 0 l < 0. If this elasticity is less than -1, an acceleration in economic growth can reduce the wages of low-skill workers due to a powerful erosion effect Allocation of capital between sectors and workers. As an alternative, Acemoglu (1999a) and Caselli (1999) derive a fall in the wages of less skilled workers because the capital-labor ratio for low education/low-skill workers falls as firms respond to technological developments. In Caselli s model this happens because the equilibrium rate of return to capital increases, and in my paper, this happens because firms devote more of their resources to opening specialized jobs for skilled workers. Consider the following simple example to illustrate this point. There is a scarce supply of an input K, which could be capital, entrepreneurial talent or another factor of production. the production function (3.1) Y h = A α hk 1 α h H α Skilled workers work with while unskilled workers work with the production function (3.2) Y l = A α l K 1 α l L α, where K l and K h sum to the total supply of K, which is assumed fixed. For simplicity, Y l and Y h are assumed to be perfect substitutes. In equilibrium, the marginal products of capital in two sectors have to be equalized, hence K l A l L = K K l A h H
203 3. A PUZZLE: THE DECLINE IN THE WAGES OF LOW-SKILL WORKERS169 Therefore, an increase in A h relative to A l will reduce K l, as this scarce factor gets reallocated from unskilled to skilled workers. The wages of unskilled workers, w L =(1 α) A α l K1 α l L α 1, will fall as a result. An innovative version of this story is developed by Beaudry and Green (2000). Suppose that equation (3.2) above is replaced by Y l = A η l K1 η l L η,withη < α, andk is interpreted as physical capital. This implies that unskilled workers require more capital than skilled workers. Beaudry and Green show that an increase in H/L can raise inequality, and depress the wages of low-skill workers. The increase in H/L increases the demand for capital, and pushes the interest rate up. This increase in the interest rate hurts unskilled workers more than skilled workers because, given η < α, unskilled workers are more dependent on capital. A potential problem with both the Beaudry and Green and Caselli stories is that they explicitly rely on an increase in the price of capital. Although the interest rates were higher during the 1980s in the U.S. economy, this seems mostly due to contractionary monetary policy, and related only tangentially to inequality. Perhaps, future research will show a major role for the increase in the interest rates in causing the fall in the wages of low education workers over the past twenty-five years, but as yet, there is no strong evidence in favor of this effect. Overall, a potential problem for all of these models based on technical change is to account for the decline in the wages of low-skill workers. The effect of technical change on the organization of the labor market may provide an explanation for this decline.
204 ACCELERATION IN SKILL BIAS 4. Organizational Change A variety of evidence suggests that important changes in the structure of firms have been taking place in the U.S. economy over twentyfive years. Moreover, it seems clear that a major driving force for this transformation is changes in technologies. For example, team production and other high-performance production methods are now widespread in the U.S. economy (e.g., Ichinowski, Prennushi, and Shaw, 1997, or Applebaum and Batt, 1994). Similarly, Cappelli and Wilk (1997) show that there has been an increase in the screening of production workers, especially from establishments that use computer technology and pay high wages. Murnane and Levy (1996) report case study evidence consistent with this view. From their interviews with human resource personnel at a number of companies, they describe the change in the hiring practices of U.S. companies. A manager at Ford Motor company in 1967 describes their hiring strategy as follows: If we had a vacancy, we would look outside in the plant waiting room to see if there were any warm bodies standing there. If someone was there and they looked physically OK and weren t an obvious alcoholic, they were hired (p. 19). In contrast, comparable companies in the late 1980s use a very different recruitment strategy. Murnane and Levy discuss the cases of Honda of America, Diamond Star Motors and Northwestern Mutual Life. All three companies spend substantial resources on recruitment and hire only a fraction of those who apply.
205 4. ORGANIZATIONAL CHANGE 171 Model of organizational change are interesting in part because they often predict a decline in the wages of low-skill workers as a result of organizational change. Moreover, such models can explain both the changes in the organizational work that we observe, and also make some progress towards opening the black-box of skill-biased technical change) A simple model. Iwillfirst outline a simple model, inspired by Kremer and Maskin (1999) and Acemoglu (1999a), that captures the effect of the changes in technologies on the organization of production. The basic idea is simple. As the productivity of skilled workers increases, it becomes more profitable for them to work by themselves in separate organizations rather than in the same workplace as unskilled workers. This is because when the skilled and unskilled work together, their productivities interact, and unskilled workers may put downward pressure on the productivity of skilled workers. Specifically, suppose that firms have access to the following production functions the old-style production function : Y = B p [(A l L) ρ +(A h h O ) ρ ] 1/ρ, the new-organization production function : Y = B s A β h h N. Intuitively, skilled and unskilled workers can either be employed in the same firm as with the old-style function, h O, or high skill workers can be employed in separate firms, h N. The fact that when they are employed in the same firm, these two types of workers affect each other s productivity is captured by the CES production function. This formulation implies that if the productivity (ability) of unskilled workers, A l,
206 ACCELERATION IN SKILL BIAS is very low relative to A h, they pull down the productivity of skilled workers. In contrast, when they work in separate firms, skilled workers are unaffected by the productivity of unskilled workers. Moreover, β > 1, which implies that improvements in the productivity of skilled workers has more effect on the productivity of new style organizations. The parameters B p and B s new style production functions. capture the relative efficiency of old and The labor market is competitive, so the equilibrium organization of production will maximize total output, given by B p [(A l L) ρ +(A h h O ) ρ ] 1/ρ + B s A β h (H h O), whereh O [0,H] is the number of skilled workers employed in the old-style organizations. For all cases in which h O > 0, the solution to this problem will involve (4.1) w H = B p A ρ h hρ 1 O [Aρ l Lρ + A ρ h hρ O ](1 ρ)/ρ = B s A β h, i.e., skilled workers need to be paid B s A β h to be convinced to work in the same firms as the unskilled workers. The unskilled wage is (4.2) w L = B p A ρ l Lρ 1 [A ρ l Lρ + A ρ h hρ O ](1 ρ)/ρ <w H Now consider an increase in A h.differentiating (4.1) yields (A h h O )/ A h < 0, which,from(4.2),impliesthat w L / A h < 0. Therefore, skill-biased technical change encourages skilled workers to work by themselves, and as a result, unskilled wages fall. Intuitively, since, in the old-style organizations, the productivity of skilled workers depends on the ability of unskilled workers, when the skilled become even more productive, the downward pull exerted on their productivity by the unskilled workers becomes more costly, and they prefer to work in separate organizations. This reduces the ratio h O /L and depresses unskilled wages. As a result,
207 4. ORGANIZATIONAL CHANGE 173 improvements in technology, which normally benefit unskilled workers as discussed above, may actually hurt unskilled workers because they transform the organization of production. An increase in B s /B p, which raises the relative profitability of the new organizational form, also leads to further segregation of skilled andunskilledworkers indifferent organizations. This last comparative static result is useful since Bresnahan (1999) and Autor, Levy and Murnane. (2000) argue that by replacing workers in the performance of routine tasks, computers have enabled a radical change in the organization of production. This is reminiscent to a technological change that makes the new-organization production function more profitable A more detailed model of the changes in the organization of production. Now consider a somewhat more structured model which also tries to get to the same issues. The basic idea is that when either the productivity gap between skilled and unskilled workers is limited or when the number of skilled workers in the labor force is small, it will be profitable for firms to create jobs that to employ both skilled and unskilled workers. But when the productivity gap is largeorthatareasufficientnumberofskilledworkers,itmaybecome profitable for (some) firms to target skilled workers, designing the jobs specifically for these workers. Then these firms will wait for the skilled workers, and will try to screen the more skill once among the applicants. In the meantime, there will be lower-quality (low capital) jobs specifically targeted at the unskilled.
208 ACCELERATION IN SKILL BIAS Suppose that there are two types of workers. The unskilled have human capital (productivity) 1, while the skilled have human capital η > 1. Denote the fraction of skilled workers in the labor force by φ. The firms choose the capital stock k before they meet a worker, and matching is assumed to be random, in the sense that each firm, irrespective of its physical capital, has exactly the same probability of meeting different types of workers. Once the firm and the worker match, separating is costly, so there is a quasi-rent to be divided between the pair. Here, the economy is assumed to last for one period, so if the firm and worker do not agree they lose all of the output (see Acemoglu, 1999, for the model where the economy is infinite-horizon and agents who do not agree with their partners can resample). Therefore, bargaining will result in workers receiving a certain fraction of output, which I denote by β. The production function of a pair of worker and firm is y = k 1 α h α, where k is the physical capital of the firm and h is the human capital of the worker. Firms choose their capital stock to maximize profits, before knowing which type of worker will apply to their job. For simplicity, I assume that firms do not bear the cost of capital if they decides not to produce with the worker who has applied to the job. I also denote the cost of capital by c. Their expected profits are therefore given by φx H (1 β) k 1 α η ck +(1 φ) x L (1 β) k 1 α ck,
209 4. ORGANIZATIONAL CHANGE 175 where x j is the probability, chosen by the firm,thatitwillproducewith aworkeroftypej conditional on matching that type of worker. Therefore, the first term is profits conditional on matching with a skilled worker, and the second term gives the profits from matching with an unskilled worker. There can be to different types of equilibria in this economy: (1) A pooling equilibrium in which firms choose a level of capital and use it both of skilled and unskilled workers. We will see that in the pooling equilibrium inequality is limited. (2) A separating equilibrium in which firms target the skilled and choose a higher level of capital. In this equilibrium inequality will be greater. In this one-period economy, firms never specifically target the unskilled, but that outcome arises in the dynamic version of this economy. Now it is straightforward to characterize the firms profit maximizing capital choice and the resulting organization of production (whether firms will employ both skilled and unskilled workers). It turns out that first choose the pooling strategy as long as η < µ 1/α 1 φ φ α φ Therefore, a sufficiently large increase in η (in the relative productivity of skilled workers) and/or in φ (the fraction of skilled workers in the labor force) switches the economy from pooling to separating).
210 ACCELERATION IN SKILL BIAS Such a switch will be associated with important changes in the organization of production, an increase in inequality, and a decline in the wages of low-skill workers. Is there any evidence that there has been such a change in the organization of production? This is difficult to ascertain, but some evidence suggests that there may have been some important changes in how jobs are designed and organized now. First, firms spend much more on recruiting, screening, and are now much less happy to hire low-skill workers for jobs that they can fill with high skill workers. Second, as already mentioned above, the distribution of capital to labor across industries has become much more unequal over the past 25 years. This is consistent with a change in the organization of production where rather than choosing the same (or a similar) level of capital with both skilled and unskilled workers, now some firms target
211 4. ORGANIZATIONAL CHANGE 177 the skilled workers with high-capital jobs, while other firms go after unskilled workers with jobs with lower capital intensity. Third, evidence from the CPS suggests that the distribution of jobs has changed significantly since the early 1980s, with job categories that used to pay average wages have declined in importance, and more jobs at the bottom and top of the wage distribution. In particular, if we classify industry-occupation cells into high-wage the middle-wage and low-wage ones (based either on wages or residual wages), there are many fewer workers employed in the middle-wage cells today as compared to the early 1980s, or the weight-at-the-tales of the vob quality distribution has increased substantially as the next figure shows.
212 ACCELERATION IN SKILL BIAS The evolution of the percentage of employment in the top and bottom 25 percentile industry-occupation cells (weight-at-the-tails of the job quality distribution). This framework also suggests that there should be better matching between firms and workers now, since firms are targeting high skilled workers. Therefore, measures of mismatch should have declined over the past 25 or so years. Consistent with this prediction, evidence from the PSID suggests that there is much less over- or under-education today than in the 1970s Alternative stories. Other possible organizational stories could also account for the simultaneous changes in the organization of production and inequality. One possibility is that the introduction of computers has enabled firms to reorganize production, giving much more power to skilled workers, and therefore increasing their productivity. Caroli and Van Reenen provide evidence consistent with this view
213 5. TECHNICAL CHANGE AND INSTITUTIONAL CHANGE 179 from British and French establishments. They show that measures of organizational change, such as decentralization of authority, have a strong predictive power for the demand for skills at the establishment level, even after controlling for other determinants of the demand for skills, such as computers. Another possibility, suggested by Thesmar and Thoenig, is that firms have been gradually changing their organization from mechanisticorganizations,whicharehighlyproductiveatagiventask,butnot adaptable to changing environments, towards more adaptive organizations, which may be less efficientatagiventask,butcanquickly and adapt to changes. They link this switch in organizational form to globalization and to the increased availability of skilled workers (as in the above story). Because adaptive organizations require more skilled workers, this change in organizational form increases the demand for skills. 5. Technical Change and Institutional Change The above discussion of the effect of labor market institutions on inequality suggested that these are unlikely to be the main reason for the change in inequality. But this still leaves the question of how come labor market institutions started to change shortly after the changes in the structure of wages. Moreover, other major changes in the labor market, including the explosion in the pay of the CEOs, indicate that the organization of the labor market has changed substantially. Are these changes totally unrelated to the changes in technology favoring skilled workers?
214
215
216 ACCELERATION IN SKILL BIAS One possible view is that changes in technology have also contributed to the changes in labor market institutions, and as a result, we have witnessed the decline of unions, increased power (and pay) of theceosetc. There can be a number of different reasons for why changes in technology may affect the organization of labor market and the form of equilibrium institutions. Here I will mention only two: (1) New technologies may directly make certain institutions harder to maintain. For example, if new technologies require a lot of job switching, this might make unions less sustainable. There may be a lot to a story like this, but probably not because there is more frequent job switching today, since as discussed above, the evidence does not support greater churning in the labor market. Such a story linking organizational forms to technology has not been developed yet, but may be a fruitful area for future research. (2) New technologies may increase inequality, and greater inequality may make certain organizational forms harder to maintain. Now I will develop a simple story of deunionization along lines of the second explanation. The same reasoning may apply to other dimensions of wage setting policies and labor market institutions as well as to deunionization. To see the basic argument suppose that production can be carried out either in unionized or nonunionized firms. In nonunionized firms, workers receive their marginal products, which I denote by A h and A l for skilled and unskilled workers. Assume that unions always compress
217 5. TECHNICAL CHANGE AND INSTITUTIONAL CHANGE 181 the structure of wages i.e., they reduce wage differentials between skilled and unskilled workers. This wage compression could be driven by a variety of factors. Acemoglu, Aghion and Violante (2000) argue that unions encourage productive training, and such training is incentive compatible for firms only when the wage structure is compressed Alternatively, collective decision making within a union may reflect the preferences of its median voter, and if this median voter is an unskilled worker, he will try to increase unskilled wages at the expense of skilled wages. It isalsopossiblethatunionmemberschoosetocompresswagesbecause of ideological reasons or for social cohesion purposes. The empirical literature supports the notion that unions compress wages. I capture this in a reduced form way here using the equation (5.1) ω = w H w L ψ A h A l, where ψ < 1. Unions could never attract skilled workers unless they provide some benefits to them. Here I simply assume that they provide a benefit β to all workers, for example, because unions increase productivity, or because they encourage training. Alternatively, β could be part of the rents captured by the union. The zero profit constraint for firms would be: (w H β)h +(w L β)l A h H + A l L (in the case where β stands for rents, the zero profit ensures that the firm does not wish to open a non-union plant). Combining this equation
218 ACCELERATION IN SKILL BIAS with (5.1), and assuming that both hold as equality, we obtain (5.2) w H = (A h + β) H +(A l + β) L A h H + ψ 1 A h. A l L Skilled workers will be happy to be part of a union as long as w H given by (5.2) is greater than A h.asa h /A l increases i.e., as there is further skill-biased technical change, w H will fall relative to A h. Therefore, skill-biased technical change makes wage compression more costly for skilled workers, eventually destroying the coalition between skilled and unskilled workers that maintains unions. There are two important points: (1) the change in technology potentially leads to a significant change in the organization of the labor market. In particular, after the skill bias of technology passes a certain threshold, workers are no longer organizing unions and the wage compression comes to an end. (2) deunionization causes a decline in the wages of unskilled workers from to A l. w L = (A h + β) H +(A l + β) L A h H + ψ 1 ψa l A l L Unskilled workers, who were previously benefiting from wage compression imposed by unions, experience a fall in real earnings as a result of deunionization. Therefore, in this model, technical change not only affects wage inequality directly, but also induces a change in labor market institutions. Interestingly, the effect of this change in institutions on inequality could be potentially larger than the direct effect of technical change, and explain the decline in the real wages
219 5. TECHNICAL CHANGE AND INSTITUTIONAL CHANGE 183 of less skilled workers. Whether this is the case or not is an empirical question.
220 CHAPTER 9 Changes in Residual Inequality A major issue that most models discussed so far failed to address is the differential behavior of returns to schooling and residual inequality during the 1970s. I argue in this section that an explanation for this pattern requires models with multi-dimensional skills. 1. A single index model of residual inequality The simplest model of residual inequality is a single index model, in which there is only one type of skill, though this skill is only imperfectly approximated by education (or experience). Expressed alternatively, in a single index model observed and unobserved skills are perfect substitutes. Consider, for example, the model developed above, but suppose that instead of skills, we observe education, e.g. whether the individual is a college graduate, which is imperfectly correlated with skills. A college graduate has a probability φ c of being highly skilled, while a noncollege graduate is high skill with probability φ n < φ c. Suppose that the skill premium is ω = w H /w L. The college premium in this case is ω c = w C w N = φ cw H +(1 φ c ) w L φ n w H +(1 φ n ) w L = φ cω +(1 φ c ) φ n ω +(1 φ n ), 185
221 CHANGES IN RESIDUAL INEQUALITY while within-group inequality, i.e., the difference between high wage college graduates (or noncollege graduates) and low-wage college graduates (or noncollege graduates), is ω within = ω. It is immediately clear that both ω c and ω within will always move together as long as φ c and φ n remain constant. Therefore, an increase in the returns to observed skills such as education will also be associated with an increase in the returns to unobserved skills. This framework provides a natural starting point, linking between and within-group inequality, but it predicts that within and betweengroup inequality should move together. However, as discussed above, during the 1970s, returns to schooling fell while residual group inequality increased sharply. We can only account for this fact by positing a decline in φ c relative to φ n of a large enough magnitude to offset theincreaseinω; this would ensure that during the 1970s the college premium could fall despite the increase in within group inequality. A large decline in φ c relative to φ n would predict a very different behavior of the college premium within different cohorts, but the above analysis showed that there was little evidence in favor of such sizable composition effects. I therefore conclude that the single index model cannot explain the changes in residual inequality during the 1970s and 1980s. 2. Sorting and residual inequality Another approach would combine educational sorting with an increase in the demand for skills. Suppose, for example, wages are given by ln w it = θ t a i + γ t h i + ε it where h i is a dummy for high education, a i is unobserved ability, and ε it is a mean zero disturbance term. Here γ t
222 2. SORTING AND RESIDUAL INEQUALITY 187 is the price of observed skills, while θ t is the price of unobserved skills. The education premium can be written as ln ω t E (ln w it h it =1) E (ln w it h it =0)=γ t + θ t (A 1t A 0t ) where A 1t E (ln w it h it =1)and A 0t is defined similarly. Residual (within-group) inequality can be measured as Var(A it h =0) and Var(A it h =1). Under the assumption that there is perfect sorting into education, i.e., that there exists a threshold a such that all individuals with unobserved ability a obtain education, within-group inequality among high and low education workers will move in opposite directions as long as the price of observed skills, θ, is constant. To see this, note that when θ is constant and a declines (i.e., average education increases), Var(A it h =1) will increase, but Var(A it h =0) will fall. Intuitively, there are more and more marginal workers added to the high education group, creating more unobserved heterogeneity in that group and increasing within-group inequality. But in contrast, the low education group becomes more homogeneous. Therefore, without a change in the prices for unobserved skills, this approach cannot account for the simultaneous increase in inequality both among low and high education groups. Anaturalvariationonthisthemewouldbeasituationinwhichγ and θ move together. However, this will run into the same problems as the single index model: if γ and θ always move together, then such a model would predict that within-group inequality should have fallen during the 1970s. Therefore, models based on sorting also require a
223 CHANGES IN RESIDUAL INEQUALITY mechanism for the prices of observed and unobserved skills to move differently during the 1970s. 3. Churning and residual inequality Another approach emphasizes that workers of all levels of education may face difficulty adapting to changes. According to this approach, an increase in inequality also results from more rapid technical change, not because of skill bias but because of increased churning in the labor market. Recent paper by Aghion, Howitt and Violante, for example, suggest that only some workers will be able to adapt to the introduction of new technology, and this will increase wage inequality. Here I present a simple aversion to give the basic idea. Suppose that the production function of the economy is Y =[(A l L) ρ +(A h H) ρ ] 1/ρ where H denotes skilled workers, who have productivity A h,andl denotes unskilled workers who have productivity A l. As in our baseline model, the skill premium, ω, isgivenbythestandardequationasabove, which I repeat here: (3.1) ω = w H w L = µ Ah A l ρ µ (1 ρ) H = L µ Ah A l (σ 1)/σ µ 1/σ H. L Note that as before, the skill premium is decreasing in H/L. Workers are not permanently skilled or unskilled, but instead switch between being skilled and unskilled stochastically. For concreteness, suppose that a worker becomes skilled at the flow rate λ (in continuous time), and loses his skills at the flow rate µ. Then in steady state, we
224 3. CHURNING AND RESIDUAL INEQUALITY 189 have L = µ µ + λ and H = λ µ + λ. Now consider a change in technology such that both A l and A h increase proportionately, but because this technology is different from existing technologies, µ the rate at which skilled workers lose their skills increases. This change in adaptability will increase L and reduce H. As a result, the skill premium ω, as given by equation (3.1), will also increase. Therefore, in this theory it is the temporary increase in churning or dislocation that is responsible for the increase in inequality. This approach also predicts that as workers adapt to the new technology, inequality should fall. Although there is some evidence that residual inequality is no longer growing (see the figure above), there is as yet no evidence of a fall in inequality, despite the very large increase in the supply of skills. Anadvantageofthisapproachisthatitisinlinewiththeincreased earnings instability pointed out by Gottschalk and Moffit. However, as pointed out a number of times above, there is relatively little evidence other than this increase in earnings instability that supports the notion that there is more churning in the labor market. Also theories based on churning do not naturally predict a divergence between returns to educations and residual inequality during the 1970s. Therefore, a mechanism that could lead to differential behavior in the prices to observed and unobserved skills is still necessary.
225 CHANGES IN RESIDUAL INEQUALITY 4. A two-index model of residual inequality Since models based on a single index of skill (or models where different types of skills are perfect substitutes) are inconsistent with the differential behavior of returns to schooling and within-group inequality during the 1970s, an obvious next step is to consider a two-index models, somewhat reminiscent of the view of human capital consisting of a number of different attributes is in the Gardener view. In addition, these different dimensions of skills have to correspond loosely to observed and unobserved skills, and be imperfect substitutes (see Acemoglu, 1998). In particular, suppose that there are four types of workers, differentiated by both education and unobserved skills. The economy has an aggregate production function Y =[(A lu L u ) ρ +(A ls L s ) ρ +(A hu H u ) ρ +(A hs H s ) ρ ] 1/ρ, where L u is the supply of low-skill low education workers, and other terms are defined similarly. Within-group inequality corresponds to the ratio of the wages of skilled low education workers to those of unskilled low education workers, and/or to the ratio of the wages of skilled high education workers to those of unskilled high education workers. A natural starting point is to presume that the fraction of high skill workers in each education group is constant, say at φ l = L s /L u and φ h = H s /H u > φ l, which implies that there are more high ability workers among high education workers. With this assumption, withingroup inequality measures will be (4.1) w Ls w Lu = µ Als A lu ρ φ (1 ρ) l and w Hs w Hu = µ Ahs A hu ρ φ (1 ρ) h.
226 4. A TWO-INDEX MODEL OF RESIDUAL INEQUALITY 191 The college premium, on the other hand, is ω = φρ h Aρ hs + µ ρ µ (1 ρ) Aρ hu 1+φl H φ ρ l Aρ ls +. Aρ lu 1+φ h L Using this framework and the idea of endogenous technology, we can provide an explanation for the differential behavior of returns to schooling and within-group inequality during the 1970s. Recall that according to the endogenous technology approach, it is the increase in the supply of more educated workers that triggers more rapid skill-biased technical change. Because technology adjusts sluggishly, the first effect of an increase in the supply of educated workers, as in the 1970s, will be to depress returns to schooling, until technology has changed enough to offset the direct effect of supplies. This change in returns to schooling has no obvious implication for within-group inequality in a multi-skill set up since it is the education skills that are becoming abundant, not unobserved skills in fact in equation (4.1) within-group inequality is invariant to changes in the supply of educated workers unless there is a simultaneous change in φ h and φ l. Under the plausible assumption that more skilled workers within each education group also benefit from skill-biased technical progress, technical change spurred by the increase in the supply of educated workers will immediately start to benefit workers with more unobserved skills, raising within-group inequality. Therefore, an increase in the supply of educated workers will depress returns to schooling, while increasing within-group inequality. After this initial phase, technical change will increase both returns to schooling and within-group inequality.
227 CHAPTER 10 Cross-Country Inequality Trends As noted above, inequality increased much less in continental Europe than in the U.S. and other Anglo-Saxon economies. There is currently no consensus for why this has been so. There are a number of candidate explanations. These include: (1) The relative supply of skills increased faster in Europe. (2) European wage-setting institutions prevented wage inequality from increasing. (3) For exogenous or endogenous reasons, technical change has been less skill biased in Europe. The first two are the traditional explanations, put forth by a number of authors. Although they are plausible, there is relatively little work that shows that these explanations can account for the differential inequality trends. I will suggest some preliminary ways of looking into this issue. 1. Traditional Explanations 1.1. Basic ideas. The first explanation claims that the more rapid increase in the relative supply of skills in Europe accounts for the lack of increase in inequality there. The second explanation, on the other 193
228 CROSS-COUNTRY INEQUALITY TRENDS hand, emphasizes the role of European wage-setting institutions. According to this explanation, it is not the differential growth of skilled workers in the population, but the differential behavior of skilled employment that is responsible for differences in inequality trends across countries. More specifically, firms respond to wage compression by reducing their demand for unskilled workers, and the employment of skilled workers (relative to that of unskilled workers) increases in Europe compared to the U.S. As a result, the market equilibriates with a lower employment of unskilled workers compensating for their relatively higher wages in Europe. The figure illustrates the first explanation using a standard relativesupply-demand diagram, with relative supply on the horizontal axis and the relative wage of skilled workers, ω, on the vertical axis. For simplicity, I drew the relative supply of skills as vertical. The diagram shows that an increase in the demand for skills, for a given supply of skills, will lead to higher wage inequality. At a simple level, we can think of this economy as corresponding to the U.S., where the consensus is that because of skill-biased technical change or increased trade with less skill-abundant countries, the relative demand for skills grew faster than the relative supply during the recent decades. As a result of the increase in the relative demand for skills, the skill premium rises from ω Pre to ω US-Post.
229 1. TRADITIONAL EXPLANATIONS 195 Skill premium ω US-Post Relative supply of skills U European supply shift ω Pre and ω E-Post E Relative demand for skills H/L Skill-biased tech. change or increased trade H /L Figure 2: Now imagine that continental Europe is also affected by the same relative demand shifts, but the relative supply of skills also increases. This captures the essence of the first explanation, where the supply of skills increases faster in continental Europe than in the U.S. Then the European equilibrium will be at a point like E which may not exhibit greater inequality than before. In fact, the next figure depicts the case in which there is no change in the skill premium in Europe. Probably the more popular explanation among economists and commentatorsisthesecondoneabove(e.g., Krugman, 1994, OECD, 1994, Blau and Kahn, 1996). To capture this story, imagine that wage-setting institutions in Europe prevent wage inequality from increasing for example, because of union bargaining, unemployment benefits, or minimum wages that keep the earnings of low-skill workers in line with those of high-skill workers. This can be represented as an institutional
230 CROSS-COUNTRY INEQUALITY TRENDS wage-setting line different from the relative supply curve as drawn in the next figure. (To make the story stark, I drew the institutional wagesetting line as horizontal). The equilibrium now has to be along this institutional wage-setting line, and consquently off the relative supply curve, causing unemployment. Now, even in the absence of an increase in the relative supply of skills, the skill premium may not increase; instead there will be equilibrium unemployment. In the figure, relative unemployment caused by the increase in the demand for skills is shown as the gap between the relative supply of skills and the intersection between relative demand and institutional wage-setting line. Notice that in the simplest version of the story, there is full employment of skilled workers, and the indicated gap simply reflects unskilled unemployment. The fact that unemployment increased in Europe relative to the U.S. is often interpreted as evidence in favor of this explanation.
231 1. TRADITIONAL EXPLANATIONS 197 Skill premium Relative supply of skills ω US-Post U ω Pre and ω E-Post H/L E Institutional wage-setting line for Europe Relative demand for skills Skill-biased tech. change or increased trade Relative unemployment in Europe Figure 3: But in this context note that in contrast to the prediction of this simple story, unemployment in Europe increased for all groups, not simply for the low-education workers. See, for example, Nickell and Bell (1994), Card, Kramartz and Lemieux (1996) and Krueger and Pischke (1998). Nevertheless, some of the increase in unemployment among the high-education workers in Europe may reflect the effect of wage compression within education groups on job creation (e.g., if firms areforcedtopaythesamewagestolow-skill college graduates as the high-skill college graduates, they may stop hiring the low-skill college graduates, increasing unemployment among college graduates). Notice that both of these explanations are supply-side. Firms are along their relative demand curves, and different supply behavior
232 CROSS-COUNTRY INEQUALITY TRENDS or institutional characteristics of the European economies pick different points along the relative demand curves. This observation gives us a way of empirically investigating whether these explanations could account for the differential inequality trends, while assuming that relative demand shifts have been similar across countries that is, that all OECD countries have access to more or less a common set of technologies Empirical investigation. Suppose that the aggregate production function for economy j is (1.1) Y j (t) = (A j l (t) Lj (t)) ρ +(A j h (t) Hj (t)) ρ 1/ρ, which is a multi-country generalization of our above framework. Suppose that wages are related linearly to marginal product: w j H (t) = βmp j H (t) and wj L (t) =βmpj L (t). The case where β =1corresponds to workers being paid their full marginal product, with no rent sharing. Irrespective of the value of β, wehave ω j (t) wj H (t) w j L (t) = MPj H (t) MP j L (t). That is, in this specification firms will be along their relative demand curves. Then, we can write (1.2) ln ω j (t) = σ 1 σ Ã! A j h ln (t) A j l (t) 1 µ H j σ ln (t). L j (t) This equation shows that the skill premium is decreasing in the relative supply of skilled workers, H j (t) /L j (t), except in the special case where σ (where skilled and unskilled workers are perfect substitutes).
233 1. TRADITIONAL EXPLANATIONS 199 Let us start with a relatively weak form of the common technology assumption. In particular, suppose that (1.3) A j h (t) =ηj h θj (t) A h (t) and A j l (t) =ηj l θj (t) A l (t). This assumption can be interpreted as follows. There is a world technology represented by A h (t) and A l (t), which potentially becomes more or less skill-biased over time. Countries may differ in their ability to use the world technology efficiently, and this is captured by the term θ j (t). Although the ability to use world technology is time varying, it is symmetric between the two sectors. In addition, countries may have different comparative advantages in the two sectors as captured by the terms η j h and ηj l (though these are assumed to be time invariant). Substituting (1.3) into (1.4), we obtain (1.4) ln ω j (t) =c j +lna (t) 1 µ H j σ ln (t), L j (t) where ln a (t) σ 1 ln (A σ h (t) /A l (t)) is the measure of skill-biased technical change, and c j σ 1 σ ηj h /ηj l. Then, using U.S. data we can construct an estimate for the change in ln a (t), denotedby ln â (t), using an estimate for the elasticity of substitution, σ as: ln â (t) = ln ω 0 (t)+ 1 µ H 0 σ ln (t), L 0 (t) where j =0refers to the U.S. Now define k as the k-period difference operator, i.e., k x x (t) x (t k).
234 CROSS-COUNTRY INEQUALITY TRENDS Then, predicted changes in the skill premium for country j between between t k and t are given by: (1.5) k ln ˆω j (t) = k ln â (t) 1 σ k ln µ H j (t). L j (t) The implicit assumption in this exercise is that there is no delay in the adoption of new technologies across countries. Instead, it is quite possible that some of the new skill-biased technologies developed or adoptedintheu.s.areonlyintroducedincontinentaleuropewitha lag. That is, instead of (1.3), we would have (1.6) A j h (t) =ηj h θj (t) A h t k j and A j l (t) =ηj l θj (t) A l t k j, implying that there is a delay of k j periods for country j in the adoption of frontier technologies. Motivated by the possibility of such delays, as an alternative method I use U.S. data from 1974 to 1997 to recover estimates of ln â (t), and calculate the average annual growth rate of ln â (t), denotedby g. I then construct an alternate estimate for the predicted change in the skill premium in country j between dates t k and t as: (1.7) k ln ω j (t) = gk 1 σ k ln µ H j (t) L j (t) In this exercise, I use 1974 as the starting point, since it is five years prior to the earliest observation for any other country from the LIS data, and five years appears as a reasonable time lag for diffusion of technologies among the OECD countries. I use 1997 as the final year, sincethisisthefinal year for which there is LIS data for a country in my sample.
235 1. TRADITIONAL EXPLANATIONS 201 Whether the relative-supply-demand framework provides a satisfactory explanation for cross-country inequality trends can then be investigated by comparing the predicted skill premium changes, the k ln ˆω j (t) s from (1.5) and the k ln ω j (t) s from (1.7), to the actual changes, the k ln ω j (t) s. logw predicted logw, eos=2 predicted logw, eos==1.4 logw predicted logw, eos=2 predicted logw, eos== year Australia - observed vs. predicted skill premium logw predicted logw, eos=2 predicted logw, eos== year Canada - observed vs. predicted skill premium year United Kingdom - observed vs. predicted skill premium Actual skill premia and predicted skill premia from equation (1.5) for σ =1.4 and σ =2.
236 CROSS-COUNTRY INEQUALITY TRENDS logw predicted logw, eos=2 predicted logw, eos==1.4 logw predicted logw, eos=2 predicted logw, eos== year Belgium - observed vs. predicted skill premium logw predicted logw, eos=2 predicted logw, eos== year Netherlands - observed vs. predicted skill premium logw predicted logw, eos=2 predicted logw, eos== year Finland - observed vs. predicted skill premium year Sweden - observed vs. predicted skill premium Actual skill premia and predicted skill premia from equation (1.5) for σ =1.4 and σ =2.
237 1. TRADITIONAL EXPLANATIONS 203 logw predicted logw, eos=2 predicted logw, eos==1.4 logw predicted logw, eos=2 predicted logw, eos== year Denmark - observed vs. predicted skill premium logw predicted logw, eos=2 predicted logw, eos== year Germany - observed vs. predicted skill premium logw predicted logw, eos=2 predicted logw, eos== year Israel - observed vs. predicted skill premium year Norway - observed vs. predicted skill premium Actual skill premia and predicted skill premia from equation (1.5) for σ =1.4 and σ =2.
238 CROSS-COUNTRY INEQUALITY TRENDS logw predicted logw, eos=2 predicted logw, eos==1.4 logw predicted logw, eos=2 predicted logw, eos== year Australia - observed vs. predicted skill premium logw predicted logw, eos=2 predicted logw, eos== year Canada - observed vs. predicted skill premium year United Kingdom - observed vs. predicted skill premium Actual skill premia and predicted skill premia from equation (1.7) for σ =1.4 and σ =2.
239 1. TRADITIONAL EXPLANATIONS 205 logw predicted logw, eos=2 predicted logw, eos==1.4 logw predicted logw, eos=2 predicted logw, eos== year Belgium - observed vs. predicted skill premium logw predicted logw, eos=2 predicted logw, eos== year Netherlands - observed vs. predicted skill premium logw predicted logw, eos=2 predicted logw, eos== year Finland - observed vs. predicted skill premium year Sweden - observed vs. predicted skill premium Actual skill premia and predicted skill premia from equation (1.7) for σ =1.4 and σ =2.
240 CROSS-COUNTRY INEQUALITY TRENDS logw predicted logw, eos=2 predicted logw, eos==1.4 logw predicted logw, eos=2 predicted logw, eos== year Denmark - observed vs. predicted skill premium logw predicted logw, eos=2 predicted logw, eos== year Germany - observed vs. predicted skill premium logw predicted logw, eos=2 predicted logw, eos== year Israel - observed vs. predicted skill premium year Norway - observed vs. predicted skill premium Actual skill premia and predicted skill premia from equation (1.7) for σ =1.4 and σ =2. 2. Differential Changes in the Relative Demand for Skills 2.1. Basic idea. An alternative to the traditional explanations involves differential changes in the relative demand for skills across countries. These differential changes could reflect fourdistinctforces: (1) Different countries could develop their own technologies, with different degrees of skill bias. (2) Some countries could be lagging behind the world technology frontier, and may not have adopted the most recent skill-biased technologies.
241 2. DIFFERENTIAL CHANGES IN THE RELATIVE DEMAND FOR SKILLS207 (3) While all countries face the same technology frontier, some may have adopted more skill-biased technologies from this frontier. (4) Different countries have experienced different degrees of trade opening, affecting the demand for skills differentially. We have already seen that increased international trade is probably not the major cause of the increase in inequality. This leaves us with the first three options. Plausibly, many advanced economies develop some of their own technologies. Nevertheless, it appears plausible that most OECD economies have access, and even relatively rapid access, to the same set of technologies. This suggests that the most likely reason why the relative demand for skills may have behaved differently in continental Europe is not differential development of new technologies or slow technology diffusion, but different incentives to adopt available technologies. Letmeherebriefly summarize how the interaction of technology adoption and differences in labor market institutions may induce differential skill-biased technical change in different countries. I will provide a full model of this once we see the general equilibrium search and matching models later in the class. The basic idea of the theory I propose is to link the incentives to adopt new technologies to the degree of compression in the wage structure, which is in part determined by labor market institutions. In particular, institutional wage compression in Europe makes firms more willing to adopt technologies complementary to unskilled workers,
242 CROSS-COUNTRY INEQUALITY TRENDS inducing less skill-biased technical change there. This theory is based on three premises: (1) There is some degree of rent-sharing between firms and workers, for example, because of bargaining over quasi-rents. (2) The skill bias of technologies is determined by firms technology choices. (3) A variety of labor market institutions tend to increase the wages of low-skill workers in Europe, especially relative to the wages of comparable workers in the U.S. The new implication of combining these three premises is that firms in Europe may find it more profitable to adopt new technologies with unskilled workers than their American counterparts. This is because with wage compression, firms are forced to pay higher wages to unskilled workers than they would otherwise do (that is, greater than the bargained wage). This creates an additional incentive for these firms to increase the productivity of unskilled workers: they are already paying high wages, and additional investments will not necessarily translate into higher wages. Put differently, the labor market institutions that push the wages of these workers up make their employers the residual claimant of the increase in productivity due to technology adoption, encouraging the adoption of technologies complementary to unskilled workers in Europe. A simple numerical example illustrates this point more clearly. Suppose that a worker s productivity is 10 without technology adoption, and 20 when the new technology is adopted. Assume also that wages are equal to half of the worker s productivity, and technology adoption
243 2. DIFFERENTIAL CHANGES IN THE RELATIVE DEMAND FOR SKILLS209 costs 6 (incurred solely by the firm). Now without technology adoption, the firm s profits are equal to 1/2 10 = 5, while with technology adoption, they are 1/ = 4. Thefirm, therefore, prefers not to adopt the new technology because of the subsequent rent-sharing. Next suppose that a minimum wage legislation requires the worker to be paid at least 9. This implies that the worker will be paid 9 unless his productivity is above 18. The firm s profits without technology now change to 10 9=1,sinceithastopay9totheworkerbecauseof the minimum wage. In contrast, its profits with technology adoption are still 4. Therefore, the firm canal prefers to adopt the new technology. The reason for this change is clear: because of the minimum wage laws, the firm was already forced to pay high wages to the worker, even when his marginal product was low, so it became the effective residual claimant of the increase in productivity due to technology adoption. This reasoning implies that there may be greater incentives to invest in technologies complementing workers whose wages are being pushed up by labor market institutions. Since European labor market institutions increase to pay of low-skill workers, technology may be endogenously less skill biased in Europe than in the U.S A simple formalization. Leaving a more fully developed model to later, let me now present a simple formalization. Suppose the productivity of a skilled worker is A h = aη, whereas the productivity of an unskilled worker is A l = a, wherea is a measure of aggregate technology in use, and η > 1. Suppose that wages are determined by rent sharing, unless they fall below a legally mandated minimum wage,
244 CROSS-COUNTRY INEQUALITY TRENDS in which case the minimum wage binds. Hence, w j =min{βa j,w}, where j = l or h, andβ is worker s share in rent sharing. Note that the cost of upgrading technology does not featuring in this wage equation, because rent sharing happens after technology costs are sunk. To capture wage compression, suppose the minimum wage is binding for unskilled workers in Europe. Now consider technology adoption decisions. In particular, firms can either produce with some existing technology, a, or upgrade to a superior technology, a 0 = a + α, atcost γ. The profit to upgrading the technology used by a skilled worker is (1 β)αη γ, both in the U.S. and Europe. The new technology will therefore be adopted as long as γ γ S (1 β)αη. Note that there is a holdup problem, discouraging upgrading: a fraction β of the productivity increase accrues to the worker due to rent sharing (Grout, 1984, Acemoglu, 1996). The incentives to upgrade the technology used by unskilled workers differ between the U.S. and Europe. In the U.S., this profit isgivenby (1 β)α γ. So, the new technology will be adopted with unskilled workers if γ γ U (1 β)α. Clearly, γ U < γ S, so adopting new technologies with skilled workers is more profitable. In contrast, the return to introducing the new technology is different in Europe because minimum wages are binding for unskilled workers. To simplify the discussion, suppose that even after the introduction of new technology, the minimum wage binds, i.e.,
245 2. DIFFERENTIAL CHANGES IN THE RELATIVE DEMAND FOR SKILLS211 w> β (A + α). Then, the return to introducing the new technology in Europe with unskilled workers is α γ, andfirms will do so as long as γ < α. Since α > γ U, firmsineuropehavegreaterincentives to introduce advanced technologies with unskilled workers than in the U.S.
246 Part 3 Theories of Unemployment (Notes)
247 In this last part of the class I will discuss theories of unemployment. Notice that these notes are less detailed than the previous chapters (I have run out of steam!). A couple of introductory remarks are in order: (1) The simplest approach to unemployment is to ignore it, and lump it together with non-participation, under the heading of nonemployment. Then the supply and demand for work will determine wages and nonemployment. This is a very useful starting place. In particular, it emphasizes that often unemployment (nonemployment) is associated with wages above the market clearing wage levels. (2) However, the distinction between voluntary and involuntary unemployment is sometimes useful, especially since many workers claim to be looking for work rather than being outside the labor force. Moreover, when there are very high levels of nonemployment among prime-age workers, the nonemployment framework may no longer be satisfactory. Therefore, three questions important in motivating the theories of unemployment are: (a) Why do most capitalist economies have a significant fraction, typically at least around 5 percent, of their labor forces as unemployed. (b) Why does unemployment increase during recessions? (c) Why has unemployment in continental Europe has been extremely high over the past 25 years?
248 CHAPTER 11 Some Basic Facts About Unemployment (1) The unemployment rate in the U.S. fluctuates around six percent, and is strongly countercyclical. (2) There is almost always higher unemployment among younger and less educated workers. (3) The unemployment rate in continental Europe was lowered in the U.S. throughout the postwar period, but rose above the U.S. level in the late 1970s or early 1980s, and has been consistently higher there than the U.S. level. (4) The unemployment rate in some countries, notably Spain, has reached, and for a long while stayed at, 20 percent. (5)Highunemployment ineuropereflects low rates of employment creation that is, unemployed workers leave unemployment only slowly compared to the U.S. Rates at which employed workers lose their jobs and become unemployed are higher in the U.S. than in Europe. (6) Wage growth and the behavior of the labor share in GDP indicate that there was a disproportionate wage growth in continental Europe compared to the U.S., but the labor share data indicate that much of this may have been reversed during the 1980s. 217
249 SOME BASIC FACTS ABOUT UNEMPLOYMENT (7) Unemployment in continental Europe increased both among the less and more educated workers. (8) Unemployment in continental Europe increased especially among young workers, and nonemployment has affected prime-age males little. It is the young, the old or the women (in some countries) who do not work in Europe.
250
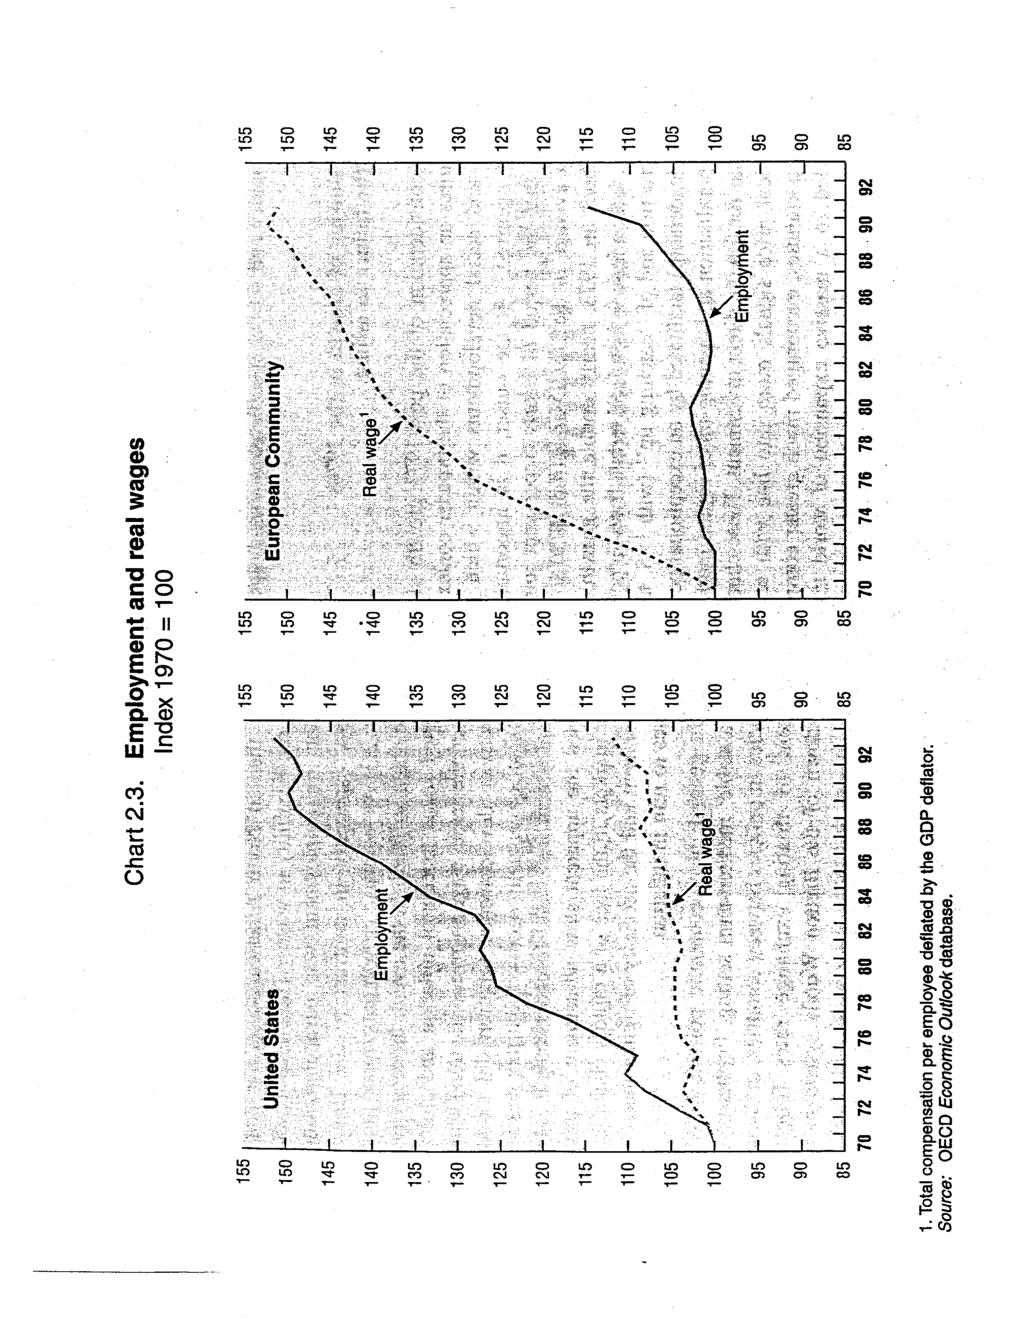
251
Labor Economics, Lectures 9 and 10: Investments in General and Speci c Skills
 Labor Economics, 14.661. Lectures 9 and 10: Investments in General and Speci c Skills Daron Acemoglu MIT Nov. 29 and Dec. 1, 2011. Daron Acemoglu (MIT) General and Speci c Skills Nov. 29 and Dec. 1, 2011.
Lecture 1:Human Capital Theory. September 27, 2017 Hideo Owan Institute of Social Science
 Lecture 1:Human Capital Theory September 27, 2017 Hideo Owan Institute of Social Science What is Organizational/Personnel Economics? 1. Key Component 1: Human Capital Theory + Heterogeneous skills/tasks
Econ 792. Labor Economics. Lecture 6
 Econ 792 Labor Economics Lecture 6 1 "Although it is obvious that people acquire useful skills and knowledge, it is not obvious that these skills and knowledge are a form of capital, that this capital
Labor Economics, Lectures 3 and 4: Social Mobility, Peer Effects and Human Capital
 Labor Economics, 14.661. Lectures 3 and 4: Social Mobility, Peer Effects and Human Capital Daron Acemoglu MIT October 28 and 30, 2014. Daron Acemoglu (MIT) Social Mobility and Peer Effects October 28 and
Labor Economics, Lectures 3 and 4: Social Mobility, Peer Effects and Human Capital
 Labor Economics, 14.661. Lectures 3 and 4: Social Mobility, Peer Effects and Human Capital Daron Acemoglu MIT November 2 and 7, 2017. Daron Acemoglu (MIT) Social Mobility and Peer Effects November 2 and
Intergenerational Mobility in Theory
 Intergenerational Mobility in Theory Labour Economics ECON 87100 Miles Corak Graduate Center, City University of New York Department of Economics @MilesCorak milescorak.com Motivating questions Reflecting
Economics 448W, Notes on the Classical Supply Side Professor Steven Fazzari
 Economics 448W, Notes on the Classical Supply Side Professor Steven Fazzari These notes cover the basics of the first part of our classical model discussion. Review them in detail prior to the second class
Notes on Intertemporal Consumption Choice
 Paul A Johnson Economics 304 Advanced Topics in Macroeconomics Notes on Intertemporal Consumption Choice A: The Two-Period Model Consider an individual who faces the problem of allocating their available
Chapter 3 Investment in Skills (Theory of Human Capital Education and On-The-Job Training) Economics 136 Julian Betts
 Economics 136 Julian Betts") Chapter 3 Investment in Skills (Theory of Human Capital Education and On-The-Job Training) Economics 136 Julian Betts 1 Main Questions 1) What determines optimal amount of education people obtain? 2) What
Chapter 3 Investment in Skills (Theory of Human Capital Education and On-The-Job Training) Economics 136 Julian Betts 1 Main Questions 1) What determines optimal amount of education people obtain? 2) What
Labor Economics, Lectures 3 and 4: Social Mobility, Peer Effects and Human Capital
 Labor Economics, 14.661. Lectures 3 and 4: Social Mobility, Peer Effects and Human Capital Daron Acemoglu MIT November 6 and 8, 2018 Daron Acemoglu (MIT) Social Mobility and Peer Effects November 6 and
Layoffs and Lemons over the Business Cycle
 Layoffs and Lemons over the Business Cycle Emi Nakamura Harvard University May 9, 2007 Abstract This paper develops a simple model in which unemployment arises from a combination of selection and bad luck.
Job Turnover and Income Mobility
 Job Turnover and Income Mobility Lecture notes Dan Anderberg Royal Holloway College January 2003 1 Introduction ² The income distribution at any one time is a simple snapshot. ² However, individuals position
Labor Economics, Lectures 3 and 4: Social Mobility, Peer Effects and Human Capital
 Labor Economics, 14.661. Lectures 3 and 4: Social Mobility, Peer Effects and Human Capital Daron Acemoglu MIT November 2 and 7, 2017. Daron Acemoglu (MIT) Social Mobility and Peer Effects November 2 and
WRITTEN PRELIMINARY Ph.D. EXAMINATION. Department of Applied Economics. January Consumer Behavior and Household Economics.
 WRITTEN PRELIMINARY Ph.D. EXAMINATION Department of Applied Economics January 2007 Consumer Behavior and Household Economics Instructions Identify yourself by your code letter, not your name, on each question.
IS WAGE COMPRESSION A NECESSARY CONDITION FOR FIRM-FINANCED GENERAL TRAINING?
 IS WAGE COMPRESSION A NECESSARY CONDITION FOR FIRM-FINANCED GENERAL TRAINING? Alison L Booth and Gylfi Zoega Institute for Social and Economic Research University of Essex Wivenhoe Park Essex CO4 3SQ Email:
31E00700 Labor Economics: Lecture 7
 31E00700 Labor Economics: Lecture 7 20 Nov 2012 First Part of the Course: Outline 1 Supply of labor 2 Demand for labor 3 Labor market equilibrium 1 Perfectly competitive markets; immigration 2 Imperfectly
Lecture 1 : The Diamond- Mortensen- Pissarides framework
 Lecture 1 : The Diamond- Mortensen- Pissarides framework ARNAUD CHÉRON (GAINS-TEPP, UNIVERSITY OF LE MANS) Attribution Non commercial - No Derivative Work : http://creativecommons.org/licenses/by-nc-nd/2.0/fr/
Labor Economics, Lectures 1 and 2: Labor Market Externalities
 Labor Economics, 14.661. Lectures 1 and 2: Labor Market Externalities Daron Acemoglu MIT Oct. 27 and Nov. 1, 2016. Daron Acemoglu (MIT) Externalities Oct. 27 and Nov. 1, 2016. 1 / 59 Introduction Introduction
!"#$%&'()( *+,&-%.&+%-(/+(01.#+(!#$/%#23( 4516#%/7+(#+5(8'#/+/+9(
( *+,&-%.&+%-(/+(01.#+(!#$/%#23( 4516#%/7+(#+5(8'#/+/+9(") !"#$%&'()( *+,&-%.&+%-(/+(01.#+(!#$/%#23( 4516#%/7+(#+5(8'#/+/+9( Chapter 9 introduces students to the concept of human capital and treats in detail education and training investments. The chapter begins
!"#$%&'()( *+,&-%.&+%-(/+(01.#+(!#$/%#23( 4516#%/7+(#+5(8'#/+/+9( Chapter 9 introduces students to the concept of human capital and treats in detail education and training investments. The chapter begins
Department of Economics. Harvard University. Spring Honors General Exam. April 6, 2011
 Department of Economics. Harvard University. Spring 2011 Honors General Exam April 6, 2011 The exam has three sections: microeconomics (Questions 1 3), macroeconomics (Questions 4 6), and econometrics
Applied Microeconometrics I
 Applied Microeconometrics I Lecture 5: Identification based on observables (continued) Tuomas Pekkarinen Aalto University September 25, 2018 Lecture Slides 1/ 31 Applied Microeconometrics I Reminder: Interpreting
Topic 3 Wage Structures Across Markets. Professor H.J. Schuetze Economics 371. Wage Structures Across Markets
 Topic 3 Wage Structures Across Markets Professor H.J. Schuetze Economics 371 Wage Structures Across Markets Wages vary across a number of different markets (dimensions) We ve looked at how wages vary across
Prof. Bryan Caplan Econ 812
 Prof. Bryan Caplan bcaplan@gmu.edu http://www.bcaplan.com Econ 812 Week 12: Labor Economics I. Human Capital Theory A. I assume you are all familiar with the calculation of present discounted values, or
Commentary: Causes of Changing Earnings Inequality
 Commentary: Causes of Changing Earnings Inequality Robert Z. Lawrence In the first half of this stimulating paper, Dennis Snower gives us a review of the existing academic literature on inequality. His
Field Exam January Labor Economics PLEASE WRITE YOUR ANSWERS FOR EACH PART IN A SEPARATE BOOK.
 University of California, Berkeley Department of Economics Field Exam January 2017 Labor Economics There are three parts of the exam. Please answer all three parts. You should plan to spend about one hour
Appendix to Skill-Biased Technical Change, Educational Choice, and Labor Market Polarization: The U.S. versus Europe
 Appendix to Skill-Biased Technical Change, Educational Choice, and Labor Market Polarization: The U.S. versus Europe Ryosuke Okazawa April 21, 2012 A. Multiple Pooling Equilibria In Section 3, although
movement of goods and labor. According to Hatton and Williamson (2005), average industrial
, average industrial") III. EDUCATION, INSTITUTIONS, MIGRATION, TRADE AND THE DEVELOPMENT OF TALENT III.I. Introduction In the modern world, a number of recent political developments have intensified the free movement of goods
III. EDUCATION, INSTITUTIONS, MIGRATION, TRADE AND THE DEVELOPMENT OF TALENT III.I. Introduction In the modern world, a number of recent political developments have intensified the free movement of goods
UNEMPLOYMENT AND ITS NATURAL RATE
 15 UNEMPLOYMENT AND ITS NATURAL RATE LEARNING OBJECTIVES: By the end of this chapter, students should understand: the data used to measure the amount of unemployment. how unemployment can result from minimum-wage
FINAL EXAMINATION VERSION A
 William M. Boal Signature: Printed name: FINAL EXAMINATION VERSION A INSTRUCTIONS: This exam is closed-book, closed-notes. Simple calculators are permitted, but graphing calculators, calculators with alphabetical
PERFORMANCE, PROCESS, AND DESIGN STANDARDS IN ENVIRONMENTAL REGULATION
 PERFORMANCE, PROCESS, AND DESIGN STANDARDS IN ENVIRONMENTAL REGULATION BRENT HUETH AND TIGRAN MELKONYAN Abstract. This papers analyzes efficient regulatory design of a polluting firm who has two kinds
Journal of Business & Economics Research Volume 2, Number 11
 An Examination Of Occupational Differences In The Returns To Labor Market Experience Paul E. Gabriel, (E-mail: pgabrie@luc.edu), Loyola University Chicago Susanne Schmitz, (E-mail: susans@elmhurst.edu),
Liang Wang University of Hawaii Manoa. Randall Wright University of Wisconsin Madison Federal Reserve Bank of Minneapolis
 ECONOMIC POLICY PAPER 16-02 JANUARY 2016 EXECUTIVE SUMMARY Many economists believe that prices are sticky they adjust slowly. This stickiness, they suggest, means that changes in the money supply have
****** 1. How is the demand for an input dependent upon the demand for an output? 2. Given a wage, how does a firm decide how many people to hire?
 1 Chapter 4- Income distribution and factor pricing Syllabus-Input markets: demand for inputs; labour markets, land markets, profit maximisation condition in input markets, input demand curves, distribution
Economics : Principles of Microeconomics Spring 2014 Instructor: Robert Munk April 24, Final Exam
 Economics 001.01: Principles of Microeconomics Spring 01 Instructor: Robert Munk April, 01 Final Exam Exam Guidelines: The exam consists of 5 multiple choice questions. The exam is closed book and closed
Harvard University Department of Economics
 Harvard University Department of Economics General Examination in Microeconomic Theory Spring 00. You have FOUR hours. Part A: 55 minutes Part B: 55 minutes Part C: 60 minutes Part D: 70 minutes. Answer
Markets and Values. The Evolution of Intrinsic Motivation. Tim Besley and Maitreesh Ghatak. November 2015
 Markets and Values The Evolution of Intrinsic Motivation Tim Besley and Maitreesh Ghatak November 2015 Besley & Ghatak (LSE) Markets and Values November 2015 1 / 26 Motivation Many commentators e.g. Durkheim,
WRITTEN PRELIMINARY Ph.D EXAMINATION. Department of Applied Economics. Trade, Development and Growth. June For students electing
 WRITTEN PRELIMINARY Ph.D EXAMINATION Department of Applied Economics Trade, Development and Growth June 2013 For students electing APEC 8702 and APEC 8703 option Instructions * Identify yourself by your
Signaling and Screening: Theory and Evidence Ec 423. Labour Economics Lent Term 2009
 Papers: Stigliz Spence Lang and Kropp Signaling and Screening: Theory and Evidence Ec 423. Labour Economics Lent Term 2009 Spence, QJE 1973 Job Market Signaling The big point: If there is a heterogeneity
1 Competitive Equilibrium
 1 Competitive Equilibrium Each household and each firm in the economy act independently from each other, seeking their own interest, and taking as given the fact that other agents will also seek their
Labor Economics. Evidence on Efficiency Wages. Sébastien Roux. ENSAE-Labor Economics. April 4th 2014
 Labor Economics Evidence on Efficiency Wages Sébastien Roux ENSAE-Labor Economics April 4th 2014 Sébastien Roux (ENSAE) Labor Economics April 4th 2014 1 / 36 Introduction Efficiency wages Explain why wages
Section 1: Introduction
 Multitask Principal-Agent Analyses: Incentive Contracts, Asset Ownership, and Job Design (1991) By Bengt Holmstrom and Paul Milgrom Presented by Group von Neumann Morgenstern Anita Chen, Salama Freed,
DOWNLOAD PDF JOB SEARCH IN A DYNAMIC ECONOMY
 Chapter 1 : Job Search General Dynamics JOB SEARCH IN A DYNAMIC ECONOMY The random variable N, the number of offers until R is exceeded, has a geometric distribution with parameter p = 1 - F(R) and expected
Introduction 3. For general queries, contact
 Introduction It is surprising to find that Schumpeter (1954) does not mention the word incentives in his monumental history of economic thought. Today, for many economists, economics is to a large extent
TOPIC 4. ADVERSE SELECTION, SIGNALING, AND SCREENING
 TOPIC 4. ADVERSE SELECTION, SIGNALING, AND SCREENING In many economic situations, there exists asymmetric information between the di erent agents. Examples are abundant: A seller has better information
INTRODUCTION TO CLASSIC AND THE NEW LABOR ECONOMICS
 INTRODUCTION TO CLASSIC AND THE NEW LABOR ECONOMICS SYRACUSE UNIVERSITY W. W. NORTON AND COMPANY NEW YORK LONDON Preface xv PRELIMINARIES 1 Introduction 1 2 The U.S. Labor Market 33 PARTI FOUNDATIONS 3
1.. There are two complementary goods that are consumed together (each individual good
 University of California, Davis Department of Economics Time: 3 hours Reading time: 20 minutes PRELIMINARY EXAMINATION FOR THE Ph.D. DEGREE Industrial Organization June 22, 2004 Answer four of the six
Understanding UPP. Alternative to Market Definition, B.E. Journal of Theoretical Economics, forthcoming.
 Understanding UPP Roy J. Epstein and Daniel L. Rubinfeld Published Version, B.E. Journal of Theoretical Economics: Policies and Perspectives, Volume 10, Issue 1, 2010 Introduction The standard economic
Buyer Heterogeneity and Dynamic Sorting in Markets for Durable Lemons
 Buyer Heterogeneity and Dynamic Sorting in Markets for Durable Lemons Santanu Roy Southern Methodist University, Dallas, Texas. October 13, 2011 Abstract In a durable good market where sellers have private
Technical Appendix. Resolution of the canonical RBC Model. Master EPP, 2010
 Technical Appendix Resolution of the canonical RBC Model Master EPP, 2010 Questions What are the causes of macroeconomic fluctuations? To what extent optimal intertemporal behavior of households in a walrasssian
Lecture 20 - Education, Human Capital, and. 1 Market Signaling
 Lecture 20 - Education, Human Capital, and Market Signaling 14.03 Spring 2003 1 Market Signaling The previous lecture s discussion of the Full Disclosure principle may suggest that markets can often efficiently
Sergio Scicchitano Italian Ministry of Economic Development, Abstract
 On the complementarity between on-the-job training and Ra brief overview Sergio Scicchitano Italian Ministry of Economic Development, Abstract In this paper I briefly review the existing literature on
Review Questions. Unions and Collective Bargaining. Choose the letter that represents the BEST response.
 192 Ehrenberg/Smith Modern Labor Economics: Theory and Public Policy, Tenth Edition Review Questions Choose the letter that represents the BEST response. Unions and Collective Bargaining 1. Which of the
ECO361: LABOR ECONOMICS FINAL EXAMINATION DECEMBER 17, Prof. Bill Even DIRECTIONS.
 ECO361: LABOR ECONOMICS FINAL EXAMINATION DECEMBER 17, 2009 Prof. Bill Even DIRECTIONS. The exam contains a mix of short answer and essay questions. Your answers to the 15 short answer portion of the exam
Test Codes: QEA and QEB (Both are of 'Descriptive' type) (Junior Research Fellowship in Quantitative Economics)
 (Junior Research Fellowship in Quantitative Economics)") Test Codes: QEA and QEB (Both are of 'Descriptive' type) (Junior Research Fellowship in Quantitative Economics) The candidates for Junior Research Fellowship in Quantitative Economics are required to take
Test Codes: QEA and QEB (Both are of 'Descriptive' type) (Junior Research Fellowship in Quantitative Economics) The candidates for Junior Research Fellowship in Quantitative Economics are required to take
14.03 Exam 3 Fall 2000 DO NOT OPEN THIS EXAM UNTIL TIME IS ANNOUNCED!
 14.03 Exam 3 Fall 2000 DO NOT OPEN THIS EXAM UNTIL TIME IS ANNOUNCED! There are 95 points on this exam and you have 120 minutes to complete it. The points can be used as a guideline for how many minutes
Economics Department 2009 Honors General Exam
 Economics Department 2009 Honors General Exam This is a 3-hour exam. (For joint concentrators with economics as the secondary field, this is a 1-hour exam. Choose one section of the exam to complete, and
Part II: Economic Growth. Part I: LRAS
 LRAS & LONG-RUN EQUILIBRIUM - 1 - Part I: LRAS 1) The quantity of real GDP supplied at full employment is called A) hypothetical GDP. B) short-run equilibrium GDP. C) potential GDP. D) all of the above.
Productivity or Signaling?
 Economics 623 Human Capital 4: Productivity or Signaling? Spring 2012 Productivity or Signaling? Why does education lead to higher earnings? The human capital perspective is that education raises the productivity
 Question # 1 of 15 ( Start time: 01:24:42 PM ) Total Marks: 1 A person with a diminishing marginal utility of income: Will be risk averse. Will be risk neutral. Will be risk loving. Cannot decide without
UC Berkeley Haas School of Business Economic Analysis for Business Decisions (EWMBA 201A) Leftovers, review and takeaways Lectures Oct.
 Leftovers, review and takeaways Lectures Oct.") UC Berkeley Haas School of Business Economic Analysis for Business Decisions (EWMBA 201A) Leftovers, review and takeaways Lectures 13-14 Oct. 1, 2011 Pricing While there is some involved analysis required,
UC Berkeley Haas School of Business Economic Analysis for Business Decisions (EWMBA 201A) Leftovers, review and takeaways Lectures 13-14 Oct. 1, 2011 Pricing While there is some involved analysis required,
Vertical Integration and Distance to Frontier
 Vertical Integration and Distance to Frontier The Harvard community has made this article openly available. Please share how this access benefits you. Your story matters. Citation Published Version Accessed
Volume Title: Schooling, Experience, and Earnings. Volume URL: Chapter URL:
 This PDF is a selection from an out-of-print volume from the National Bureau of Economic Research Volume Title: Schooling, Experience, and Earnings Volume Author/Editor: Jacob A. Mincer Volume Publisher:
Chapter 5: Variable pay or straight salary
 Chapter 5: Variable pay or straight salary University Professors get a straight salary which is not even based on age (may be considered high or low, depending on your point of view). Should we introduce
Topic 2 Human Capital. Professor H.J. Schuetze Economics 371. Human Capital
 Topic 2 Human Capital Professor H.J. Schuetze Economics 371 Human Capital Under labor supply we emphasized the quantity of labor supplied but there is also a quality dimension In the section on compensating
Lecture Note: Theories of the Provision and Payment of General Skills Training. David H. Autor MIT and NBER October 20, 2003
 Lecture Note: Theories of the Provision and Payment of General Skills Training David H. Autor MIT and NBER October 20, 2003 1 1 Goal of this lecture Review basic Becker story Consider stylized model of
Quasi-Fixed Labor Costs and Their Effects on Demand
 CHAPTER 5 Quasi-Fixed Labor Costs and Their Effects on Demand In addition to the questions below, solve the following end of chapter problems: Review questions 1,3-6, 8; Problems 1-3 1. Suppose that workers
WRITTEN PRELIMINARY Ph.D. EXAMINATION. Department of Applied Economics. University of Minnesota. June 16, 2014 MANAGERIAL, FINANCIAL, MARKETING
 WRITTEN PRELIMINARY Ph.D. EXAMINATION Department of Applied Economics University of Minnesota June 16, 2014 MANAGERIAL, FINANCIAL, MARKETING AND PRODUCTION ECONOMICS FIELD Instructions: Write your code
Name: I pledge to obey the Duke University Honor Code during this exam. ECON201 - Final Exam - Spring 2018 Professor Chelsea Garber
 Professor Chelsea Garber Name: Please answer all questions in the space provided. You do NOT need to provide explanations for your answers unless the question specifically asks for an explanation. If it
as explained in [2, p. 4], households are indexed by an index parameter ι ranging over an interval [0, l], implying there are uncountably many
![as explained in [2, p. 4], households are indexed by an index parameter ι ranging over an interval [0, l], implying there are uncountably many](/thumbs/81/84622370.jpg "as explained in [2, p. 4], households are indexed by an index parameter ι ranging over an interval [0, l], implying there are uncountably many") THE HOUSEHOLD SECTOR IN THE SMETS-WOUTERS DSGE MODEL: COMPARISONS WITH THE STANDARD OPTIMAL GROWTH MODEL L. Tesfatsion, Econ 502, Fall 2014 Last Revised: 19 November 2014 Basic References: [1] ** L. Tesfatsion,
THE HOUSEHOLD SECTOR IN THE SMETS-WOUTERS DSGE MODEL: COMPARISONS WITH THE STANDARD OPTIMAL GROWTH MODEL L. Tesfatsion, Econ 502, Fall 2014 Last Revised: 19 November 2014 Basic References: [1] ** L. Tesfatsion,
THE QUANTITY AND PRICING OF HUMAN CAPITAL IN CANADA AND THE UNITED STATES
 Preliminary and Incomplete: Please do not quote THE QUANTITY AND PRICING OF HUMAN CAPITAL IN CANADA AND THE UNITED STATES Audra Bowlus*, Haoming Liu** and Chris Robinson* *University of Western Ontario
The Microfoundations of Urban Agglomeration Economies: Dicussion of Duranton and Puga (DP), 2004
, 2004") 1 / 33 The Microfoundations of Urban Agglomeration Economies: Dicussion of Duranton and Puga (DP), 2004 Nathan Schiff Shanghai University of Finance and Economics Graduate Urban Economics, Lecture 3 March
1 / 33 The Microfoundations of Urban Agglomeration Economies: Dicussion of Duranton and Puga (DP), 2004 Nathan Schiff Shanghai University of Finance and Economics Graduate Urban Economics, Lecture 3 March
MRW model of growth: foundation, developments, and empirical evidence
 MRW model of growth: foundation, developments, and empirical evidence Mariya Neycheva * 1. Introduction The economics of growth is one of the most popular fields of study in both theoretical and empirical
Online shopping and platform design with ex ante registration requirements
 Online shopping and platform design with ex ante registration requirements O A Florian Morath Johannes Münster June 17, 2016 This supplementary appendix to the article Online shopping and platform design
ECO401 Current Online 85 Quizzes Question Repeated ignore In Green color are doubted one
 ECO401 Current Online 85 Quizzes Question Repeated ignore In Green color are doubted one Question # 1 of 15 ( Start time: 01:24:42 PM ) Total Marks: 1 A person with a diminishing marginal utility of income:
Monopoly. The single seller or firm referred to as a monopolist or monopolistic firm. Characteristics of a monopolistic industry
 Monopoly Monopoly: a market structure in which there is only one seller of a good or service that has no close substitutes and entry to the market is completely blocked. The single seller or firm referred
BACHELOR OF BUSINESS. Sample FINAL EXAMINATION
 BACHELOR OF BUSINESS Sample FINAL EXAMINATION Subject Code : ECO201 Subject Name : LABOUR ECONOMICS This examination carries 50% of the total assessment for this subject. Examiner(s) Moderator(s) Joyce
Essays in Economic Growth, Political Economy and Institutions
 Florida International University FIU Digital Commons FIU Electronic Theses and Dissertations University Graduate School 9-10-2012 Essays in Economic Growth, Political Economy and Institutions Ece Handan
Collusion. Sotiris Georganas. February Sotiris Georganas () Collusion February / 31
 Collusion February / 31") Collusion Sotiris Georganas February 2012 Sotiris Georganas () Collusion February 2012 1 / 31 Outline 1 Cartels 2 The incentive for cartel formation The scope for collusion in the Cournot model 3 Game
Collusion Sotiris Georganas February 2012 Sotiris Georganas () Collusion February 2012 1 / 31 Outline 1 Cartels 2 The incentive for cartel formation The scope for collusion in the Cournot model 3 Game
Pricing distortions in multi-sided platforms
 Pricing distortions in multi-sided platforms Hongru Tan and Julian Wright March, 2018 Abstract We show that in the context of pricing by a multi-sided platform, in addition to the classical market-power
Chapter 3. Labour Demand. Introduction. purchase a variety of goods and services.
 Chapter 3 Labour Demand McGraw-Hill/Irwin Labor Economics, 4 th edition Copyright 2008 The McGraw-Hill Companies, Inc. All rights reserved. 4-2 Introduction Firms hire workers because consumers want to
Search, Matching and Training
 Search, Matching and Training Chris Flinn 1 Ahu Gemici 2 Steven Laufer 3 1 NYU 2 Royal Holloway 3 Federal Reserve Board Human Capital and Inequality Conference University of Chicago December 16, 2015 Views
Internet Appendix to Technological Change, Job Tasks, and CEO Pay
 Internet Appendix to Technological Change, Job Tasks, and CEO Pay I. Theoretical Model In this paper, I define skill-biased technological change as the technological shock that began in the 1970s with
chapter: Solution Factor Markets and the Distribution of Income
 Factor Markets and the Distribution of Income chapter: 19 1. In 2010, national income in the United States was $11,722.6 billion. In the same year, 139 million workers were employed, at an average wage
Supplimentary material for Research at the Auction Block: Problems for the Fair Benefits Approach to International Research
 Supplimentary material for Research at the Auction Block: Problems for the Fair Benefits Approach to International Research Alex John London Carnegie Mellon University Kevin J.S. Zollman Carnegie Mellon
Wages, Human Capital, and the Allocation of Labor across Sectors
 Wages, Human Capital, and the Allocation of Labor across Sectors Berthold Herrendorf and Todd Schoellman Arizona State University June 30, 2014 Herrendorf and Schoellman Motivation Structural Transformation
Final Exam ECON4715 Labour economics
 Final Exam ECON4715 Labour economics This exam has 4 questions, with in total 13 sub-questions. All questions are weighted equally. When answering the questions on the exam you should be brief and to the
Training Contracts, Worker Overconfidence, and the Provision of Firm-Sponsored General Training
 Training Contracts, Worker Overconfidence, and the Provision of Firm-Sponsored General Training Author: Mitchell Hoffman Berkeley Presenter: Matthew Chao Caltech February 21, 2012 Introduction Hold-up
Chapters 1 and 2 Trade Without Money and A Model of Money
 Chapters 1 and 2 Trade Without Money and A Model of Money Main Aims: 1. Answer following two questions: Why money is used as a medium of exchange? How and why money improves allocations in an economy and
Lecture Private Information, Adverse Selection and Market Failure
 Lecture Private Information, Adverse Selection and Market Failure David Autor 14.03 Fall 2004 1 Private Information, Adverse Selection and Market Failure It used to be thought that markets for information
Inequality and the Organization of Knowledge
 Inequality and the Organization of Knowledge by Luis Garicano and Esteban Rossi-Hansberg Since the seminal work of Katz and Murphy (1992), the study of wage inequality has taken as its starting point a
Asset Price Bubbles and Endogenous Growth [PRELIMINARY DRAFT] Abstract
![Asset Price Bubbles and Endogenous Growth [PRELIMINARY DRAFT] Abstract](/thumbs/73/68268378.jpg "Asset Price Bubbles and Endogenous Growth [PRELIMINARY DRAFT] Abstract") Asset Price Bubbles and Endogenous Growth [PRELIMINARY DRAFT] Jong Kook Shin 1 Chetan Subramanian 2 Abstract This paper extends a simple Schumpeterian growth model to demonstrate that bubbles can generate
Asset Price Bubbles and Endogenous Growth [PRELIMINARY DRAFT] Jong Kook Shin 1 Chetan Subramanian 2 Abstract This paper extends a simple Schumpeterian growth model to demonstrate that bubbles can generate
ECON 500 Microeconomic Theory MARKET FAILURES. Asymmetric Information Externalities Public Goods
 ECON 500 Microeconomic Theory MARKET FAILURES Asymmetric Information Externalities Public Goods Markets can and do fail to achieve the efficiency and welfare ideals that we have presented thus far. Asymmetric
Chapter 8: Exchange. 8.1: Introduction. 8.2: Exchange. 8.3: Individual A s Preferences and Endowments
 Chapter 8: Exchange 8.1: Introduction In many ways this chapter is the most important in the book. If you have time to study just one, this is the one that you should study (even though it might be a bit
On-the-Job Search and Wage Dispersion: New Evidence from Time Use Data
 On-the-Job Search and Wage Dispersion: New Evidence from Time Use Data Andreas Mueller 1 Stockholm University First Draft: May 15, 2009 This Draft: August 11, 2010 Abstract This paper provides new evidence
2. Why is a firm in a purely competitive labor market a wage taker? What would happen if it decided to pay less than the going market wage rate?
 Chapter Wage Determination QUESTIONS. Explain why the general level of wages is high in the United States and other industrially advanced countries. What is the single most important factor underlying
Trends in US Wage inequality: Revising the Revisionists
 Trends in US Wage inequality: Revising the Revisionists Authors: Autor, Katz and Kearney Presenter: Diego Daruich Review of Economics and Statistics (2008) Prepared for Sargent s Reading Group (NYU) March
Earnings and Discrimination
 CHAPTER 19 Earnings and Discrimination Goals in this chapter you will Examine how wages compensate for differences in job characteristics Learn and compare the human-capital and signaling theories of education
Skills, Tasks and Technologies
 Skills, Tasks and Technologies Beyond the Canonical Model David Autor and Daron Acemoglu MIT and NBER Acemoglu-Autor (MIT and NBER) Skills, Tasks, Techs 1 / 49 Skills, Tasks and Technologies: Beyond the
Chapter 8 The Labor Market: Employment, Unemployment, and Wages
 Chapter 8 The Labor Market: Employment, Unemployment, and Wages Multiple Choice Questions Choose the one alternative that best completes the statement or answers the question. 1. If the price of a factor
Education, Institutions, Migration, Trade, and The Development of Talent
 Education, Institutions, Migration, Trade, and The Development of Talent Dhimitri Qirjo Florida International University This Version: March 2010 Abstract This paper proposes a theory of free movement