City Power Johannesburg (SOC) Ltd. Business Plan. Final Draft: Subject to NERSA Approval of the Tariffs
|
|
|
- Preston Bishop
- 5 years ago
- Views:
Transcription
 Ltd Business Plan 2018")

1 City Power Johannesburg (SOC) Ltd Business Plan Final Draft: Subject to NERSA Approval of the Tariffs 0
2 Official sign-off It is hereby certified that this Strategic Plan: Was developed by the management of City Power SOC Ltd under the guidance of the Chief Executive Officer (CEO) Takes into account all the relevant policies, legislation and other mandates for which City Power SOC Ltd is responsible Accurately reflects the strategic outcomes and objectives which City Power SOC Ltd will endeavour to achieve over the period Sign Off: CEO Name: Signature: Date: Sector ED Name:... Signature: Date:. Sector MMC Name: Signature: Date:. Company Details Company Name: City Power Johannesburg (SOC) Ltd Company Registration Number: Reg 2000/030051/30 Physical Address: 40 Heronmere Road, Reuven Postal Address: PO Box 38766, Booysens, 2016 Phone Number: (+27) Fax Number: (+27) Website: Customer Contact Centre: (+27)
3 Table of Contents 1. Executive summary Background Profile Core mandate Problem statement Strategic intent Market overview Environment analysis Demand dynamics Supply dynamics Revenue streams Key challenges SWOT analysis Shareholder alignment Strategy overview Strategic alignment Priority implementation plan Day to Day Operations: Group plans Business sustainability Group mandate Human Resources and Transformation Group mandate Finance Group mandate Enterprise support Group mandate Metering services Group mandate Engineering operations Group mandate Engineering services Group mandate Legal Group mandate Relationship management Group mandate
4 4.10 Internal audit Group mandate Financial projections Proposed tariff escalation Proposed budget overview Sources of funding Service charges Connection charges DSM levy / IRL levy Capital grants and contributions Other revenue Expenditure Bulk purchases Kelvin and other lease costs Employee related costs salaries Related to capex and repairs & maintenance Repairs and maintenance Bad debt provision Contracted services General expenses Internal charges fees earned Capital expenditure (CAPEX) CAPEX allocation impact Planned capex projects People Stakeholder management Engagement with political stakeholders Approach Engagement strategy Integrated communications strategic approach Internal communications approach External communications approach Corporate Social Investment (CSI) approach CSI considerations Risk management Enterprise risk management Background to enterprise risk management
5 8.2. Risk management process Philosophy and governance City Power s risk governance structure Risk maturity The Risk management plan City Power risk context Key strategic risks (City Power strategic risk register) Risk appetite and tolerance
6 List of Figures Figure 1: Map showing the electricity supply to the City of Johannesburg... 8 Figure 2: City Power strategic timeline... 9 Figure 3: City Power mandate Figure 4: Scenarios of key industry drivers for change Figure 5: Stakeholder alignment between City Power and City of Johannesburg Figure 6: Diphetogo link to City Power interventions Figure 7: City Power operating model Figure 8: City Power Operating Model Figure 9: City Power s footprint Figure 10: Capital grants and contributions 2018/ Figure 11: Alternative revenue streams for City Power Figure 12: Lease payments in Rands Figure 13: Contracted services (R 000) 2018/ Figure 14: Percentage split between various elements Figure 15: Internal charges Figure 16: Sources of capex for City Power Figure 17: Four strategic pillars outlining the HR and Transformation Group mandate Figure 18: Key Stakeholders Figure 19: Engagement with political stakeholders approach Figure 20: Engagement with dedicated councillors for City Power projects Figure 21: Integrated marketing framework Figure 22: Integrated marketing approach Figure 23: Internal communication Figure 24: CSI consideration Figure 25: Risk governance structure (CP Risk Management Framework) Figure 26: CP ERM process: Risk management framework (2017/2018) Figure 27: Risk maturity stages Figure 28: Issues which inform the risk context for City Power (2017/2018) Figure 29: Nine key strategic risks (City Power Strategic Risk Register 2017/2018)
7 List of Tables Table 1: Key statistics... 9 Table 2: PESTLE analysis Table 3: Industry change drivers Table 4: Table showing annual electricity demand trends between 2006 and Table 5: Current cross-subsidies Table 6: Current customer segmentation Table 7: Projected proposed tariff escalation figures Table 8: City Power revenue streams Table 9: Key challenges faced by City Power Table 10: SWOT analysis of City Power Table 11: Alignment of CoJ priorities and City Power objectives Table 12: Diphetogo programme alignment to City Power objectives Table 13: Service Level Standards Table 14: National Treasury programme Table 15: City Power KPIs Table 16: City Power KPIs Definitions Table 17: Business sustainability programmes Table 18: Human resources and transformation programmes Table 19: Finance programmes Table 20: Enterprise support programmes Table 21: Metering services programmes Table 22: Engineering operations programmes Table 23: Engineering services programmes Table 24: Legal programmes Table 25: Relationship management programmes Table 26: Internal Audit programmes Table 27: Projected proposed tariff escalation figures Table 28: Budget guidelines as set out by the City of Johannesburg Table 29: Revised bulk purchases Table 30: Breakdown of internal charges fees earned Table 31: Capex per category Table 32: Group objectives and key activities Table 33: Human Resources Performance overview Table 34: Strategic risks (City Power Approved Strategic Risk Register 2017/2018)
8 1. Executive summary The purpose of this document is to highlight that City Power has identified, and will implement, interventions to improve service delivery to citizens; and ensure revenue management while fighting fraud and corruption. These interventions highlighted in this document, will ensure that the company delivers on its mandate of providing energy to the citizens of Johannesburg. City Power is committed to meeting the expectations of its customers, stakeholders and shareholder by re-energising and refocusing the organisation. This commitment is based on City Power s vision of providing quality energy and electricity in a sustainable manner. The City of Johannesburg has earned its place as the largest metropolitan economy in Africa. Being larger than most African national economies, it continues to attract more residents and business interest in a remarkably shifting socio-economic tide. Over the last two decades the City has been able to bring together a diaspora of races and social classes living alongside one another and this has further been facilitated through the work of Corridors to Freedom. Even after the mining industry gradually moved out of the City, it has remained highly attractive for a host of businesses to build firm roots, creating a diversified economy. As the City grows and develops it is faces challenges similar to other growing Metro s globally including: high rate of urbanisation - requiring a scale up of services, growing middle class demanding higher quality of services, pro-poor support resulting in a greater focus on cross subsidisation of services between the wealthy and the poor. Based on the above challenges, it is imperative that City Power should fully execute on its mandate in order to fully support its shareholder, the City of Johannesburg. The document will set out how City Power aligns to the objectives of its shareholder and all the programmes that it intends to roll out in an effort to support the City of Johannesburg and to achieve its own mandate. It will also highlight some of the key drivers in the energy industry as wells as how City Power intends to position itself to effectively handle and deal with the dynamics involved Background Following the first democratic elections that took place in 1994, and the local government election that followed in 1995, eleven local authorities were amalgamated to form the Greater Johannesburg Metropolitan Council. By mid-1997 it became apparent that the new structures were not optimally effective and the Councils of Greater Johannesburg were facing a severe financial crisis. It was then agreed that a unified, metropolitan-wide initiative was necessary to focus specifically on the critical problems facing the City. This led to the inception of the i-goli 2002 plan. i-goli 2002 was essentially a three-year strategic plan. It involved the structural transformation of Metro functions with the view to ensuring enhanced and more cost effective service delivery. It achieved this by reducing fragmentation, eliminating duplication, improving accountability, focusing on human resource development and improving performance incentives. From an organisational perspective, the i-goli 2002 Plan put in place sensible structures that delivered at greater levels of efficiency. The i-goli 2002 Plan envisaged that the City would work through a combination of new political governance structures, agencies and corporatised entities. A key element of the i-goli 2002 strategy for service delivery was the establishment of utilities, agencies and corporatised entities now called the municipal owned entities (MOEs). One of the entities established was City Power Johannesburg (SOC) Ltd, 100% owned by the City of Johannesburg (CoJ), and established in terms of the Companies Act, on 30 November The National Energy Regulator of South Africa (NERSA) granted City Power a license to trade on 19 December City Power is not the sole provider of electricity services for the City. City Power is accountable for public lights in all of Johannesburg but the rest of the electricity services are split with Eskom as depicted in the map below (Figure 1). 7
 Ltd, the Council utilises")
9 Figure 1: Map showing the electricity supply to the City of Johannesburg. Shown in yellow, are the areas supplied by Eskom and shown in blue, are areas that are supplied by City Power In line with the establishment of City Power Johannesburg (SOC) Ltd, the Council utilises an Environment and Infrastructure Services Department (EISD) to oversee the performance and Group Governance to oversee the governance of the company, as well as to regulate it. In this regard various agreements in principle were concluded during the establishment of the companies. These included the Sale of Business Agreement (SBA) and the Service Delivery Agreement (SDA). The relationship maintained with the City of Johannesburg is one of Service Authority and Service Provider. City Power Johannesburg (SOC) Ltd is the preferred Service Provider for the Service Authority, the (Johannesburg Council). City Power Johannesburg (SOC) Ltd is the Energy Distribution Service Provider to the Service Authority (Johannesburg Council). The core competency of the business is to purchase, distribute and sell electricity within its geographical footprint of business. The City of Johannesburg is the sole Shareholder. The Council, by means of a Service Delivery Agreement, regulates the service in respect of the following: financial issues (such as tariffs and capital expenditure), human resource issues (such as skills development), delivery targets (maintenance of assets and addressing assets), and standards of customer care Profile The City Power strategy has evolved over the year in alignment with its sole shareholder, the City of Johannesburg. Figure 2 shows the City Power strategic journey since its inception: 8


10 Figure 2: City Power strategic timeline As shown in table Table 1, City Power has over customers and generates over R15 billion of revenue. Table 1: Key statistics 9


11 1.3. Core mandate The mandate of City Power is to provide reliable supply of energy to the City of Johannesburg (Figure 3). This is done through the strategic use of a mix of technologies and energy sources whilst maintaining the financial sustainability of the business. Figure 3: City Power mandate 1.4. Problem statement The aim of City Power is to assist the City of Johannesburg to address the South African challenge of security and quality of electricity supply. It is to enable consumers, who reside in the City of Johannesburg jurisdiction, to reliably obtain electricity at a defined quality and at affordable transparent rates. In parallel to this objective, City Power will also be required to ensure the sustainability of the business through the achievement of certain agreed to financial, social and environmental goals Strategic intent Vision The strategic reason of City Power s existence is to provide quality energy and electricity in a sustainable manner. The vision of City Power is aligned to the vision of the shareholder: A City Power that works is a Joburg that is Em-Powered (Draft vision, approval still pending) Mission The mission of City Power Johannesburg SOC is to meet the expectations of our customers and stakeholders by: Providing sustainable, affordable, safe and reliable energy supply Providing prompt and efficient customer services Being the preferred equal opportunity employer by developing and incentivising our employees Undertaking our business in an environmentally acceptable manner Values The aspired values of City Power are to be: Resourceful, Resilient, Reliable, Respectful, Service delivery with integrity 10
12 Strategic objectives City Power has seven (7) strategic Objectives: Re-energised, refocused and ethical organisation Strategy driven, risk intelligent and innovative organisation Safe secured smart grid Financial sustainability Revenue driven customer centric organisation Plant reliability Energy sustainability 11
13 2. Market overview 2.1. Environment analysis The environment that City Power operates in can best be described through a PESTLE analysis, shown in Table 2: Table 2: PESTLE analysis External Factors City Power response and effect Political Economic Social Change in Political leadership GDS 2040 COJ IDP SOCA/SONA Funding challenges Consumer spending pressures Increased cost of supply Kelvin pricing/ppa Security of supply Service delivery Social media Company image/reputation Theft and vandalism, Illegal connections High Unemployment levels Social and economic inequality Spatial challenges High Level strategic focus/alignment Changing priorities/funding Changing targets: knock on effect Promises made: refocus mandate Refocus of mandate; implications for service delivery and business model Limited funding Reduced revenue if people cannot pay Reduced margins; or pass on costs which make electricity expensive Locked into agreement negative impact on pricing Investor and economic impact Pressures to deliver Interconnectedness: challenge of maintaining a positive company image and responding immediately to issues Increased outages and service delivery pressures Inability to pay; increased crime (theft and vandalism) Increased demand on current network (old) or challenges to replace new network, workforce health 12
14 External Factors City Power response and effect Disruptive and New technologies New skills required Changing ICT landscape- cyber security Cyber security becomes a greater challenge Globalisation/interconnectedness CP must act quickly to be a world class utility Technological Legal Environmental Constitutional requirements Legislation and regulation requirements (e.g., ISMO, Energy legislation and ISO) Legislation and regulatory limiting (w.r.t. energy and low carbon) Drive to reduce consumption and emissions IPPs/renewable energy Security of supply, Reliance on coal and other fossil fuels for energy supply for the foreseeable future Climate change and Natural resource scarcity Mandate to supply electricity Limitation on procuring from IPP s Accreditation requirements to maintain license Legislation hinders carbon reduction and use of new energy Less consumption, less revenue Pricing of renewables may be +ve or ve Security of supply through alternative means Coal usage = more emissions Limited resources = challenge to the business operating model 13

15 The energy sector is in transformation and this creates challenges both at an industry level and at a municipal / entity level. Table 3 relates to the anticipated industry changes that may impact on strategy, business model and future performance: Table 3: Industry change drivers Change drivers Infrastructure investment Changing energy mix and distributed generation Empowered customers Digitization Regulatory frameworks New competitors Talent and diversity Changes over time Significant investment is required to update or replace power, gas and water assets Generation mix is shifting to cleaner sources, including natural gas and renewables, and is becoming more decentralised Customers will have more choices to manage their energy consumption through both distribution generation and energy management solutions Smart meters, big data and analytics can be used to optimize energy delivery, improve energy efficiency and enhance customer experiences Regulatory compact is under pressure to accommodate changing customer demands and encourage innovation New and powerful entrants have begun to offer customers innovative home energy management products and services Aging workforce and challenges of the new digital economy will require effective knowledge transfer and fresh thinking Utilities need to innovate across the value chain to derive competitive advantage and turn disruptive threats into opportunities. Figure 4 is showing industry scenarios for tomorrow s world and key changes: Figure 4: Scenarios of key industry drivers for change 14
16 The key changes in Figure 4 present the following opportunities to entities and companies in the industry: 1. Rising emerging markets energy demands (including poverty reduction and access to power) 2. Acquisitions or alliances to gain new capabilities (including growing skills base) 3. Growth in energy and ancillary services markets (including sustainable jobs) 4. Enhancing relationships with external regulatory and compliance bodies 5. Improving public perceptions (including customer control) 6. Increased focus on investor relations programs and communications (including security of supply to drive investor appetite) 7. Integration of distributed energy resources (including necessity to innovate) 8. Increased investment in generation capacity and delivery infrastructure in emerging markets (including security of supply and network investment) 9. Rising energy innovation in emerging markets 10. Improving onshore and offshore wind supply chain efficiency 2.2. Demand dynamics Statistics show that the overall actual demand for electricity over the past 12 years has decreased (Table 4), with the current volume growth rates (FY2017/18) of -2.8%. A significant decrease in demand was seen between FY16/17 FY17/18. This may be attributed to the economic slowdown but will need to be thoroughly assessed. Purchasing trends over this period show that GWh was for the actual bulk purchases for 16/17, which was higher than original forecast of GWh. Table 4: Table showing annual electricity demand trends between 2006 and 2017 Financial year Actual demand (GWh/a) Volume growth (%) FY2006/ FY2007/ FY2008/ FY2009/ FY2010/ FY2011/ FY2012/ FY2013/ FY2014/ FY2015/ FY2016/ FY2017/
17 Even with the noted decrease in electricity demands, other market players have increased prices to customers in the 2017/18 financial year: Eskom Annual Average increase 5,23% in April 2018 Kelvin Increase at 7,10% Eskom increase to municipal customers in July 2018 to be 6,96% NERSA Guide for Municipalities at 7,01% There are six tariff categories to service different customers that are charged differently, with agriculture and domestic customers being charged higher rates (49.7% and 33.4%, respectively) (Table 5): Tariff category Table 5: Current cross-subsidies Cross-subsidisation Contribution (Rm/a) Potential charge (%) Domestic prepaid Domestic conventional Agricultural Business Large users (MV) Large users (LV) The different customer segments contribute specific percentages to the overall revenue that City Power generates through its service and prodct offerings (Table 6). Table 6: Current customer segmentation Traffic category Contribution Consumption (%) Revenue (%) Large customer TOU Large customer Business conventional Business prepaid Agricultural Domestic TOU Domestic conventional Domestic prepaid Resellers conventional Resellers prepaid
18 To reduce levels of cross subsidisation in line with the benchmarks set by NERSA and to introduce fixed charges, especially for prepaid customer, yearly tariff escalations are projected to increase as shown in Table 7. Financial year Table 7: Projected proposed tariff escalation figures Overall tariff escalation rates (%) FY17* FY18 FY19 FY20 Large power users (TOU) Large power users Business conventional Business prepaid Agriculture Residential conventional Residential prepaid Reseller Business Reseller residential Total Average Tariff Increase Note * - Actual NERSA allowed 2.3. Supply dynamics By monitoring the different market factors and challenges, City Power is able to provide services that align with its mandate of supplying the City of Johannesburg citizens with quality, reliable and affordable energy. Services to citizens are provided mainly by implementing the City Power strategic programmes and projects. Through the projects, this is an example of what has been achieved: houses were electrified against a budget of Total public lights installed amounted to against a budget of Ripple relays installed were against budget of % of smart meters were installed against budget of 65% 2.4. Revenue streams City Power has the following revenue generation projects (Table 8): 17
19 Table 8: City Power revenue streams Project Problem Statement Response Strategy Prepaid Revenue Recovery Prepaid revenue is 28% below budget as at end of November This was due to the following: Faulty Prepaid Meters Unsecured and inaccessible prepaid meters Old Meter Technology Manually monitored metered Bypassed prepaid meters Community mass mobilization against City Power Prepaid Meter audits and disconnections Incorrect addresses on old prepaid installations Culture of non-payment and lack of understanding to link of payment of services to overall service delivery To respond to the challenges on the prepaid environment City Power has employed the following: Replacement of faulty prepaid meters City Power has a plan to replace 15,000 faulty prepaid meters that are not buying for 2017/2018. City Power is installing meters that has a capacity to be monitored remotely by installing Meter Data Concentrators All prepaid meters are monitored monthly using the buying history All prepaid meters not buying for 3 months are audited and disconnected if found to be bypassed Vigorous Stakeholder engagements with focus to culture change and other service offerings Use of GIS and LIS information category for prepaid meter registration Conventional Revenue Recovery The conventional billing is made out of LPU, business and domestic billing. This segment has a shortfall of 9% and below are the causes: Low reading performance on manual read meter population Unresolved billing exceptions Inconsistent billing on accounts resulting in loss of revenue Incorrect application of tariffs resulting in reduced billing Variance between properties billed on Rates against properties billed on electricity Timeous processing of revenue recovery adjustments To respond to the challenges on the conventional environment City Power has employed the following: The plan is to improve meter reading performance, by converting inaccessible and faulty meters to smart meters Uncleared billing exceptions have been identified as cause to revenue shortfall. These reports are now generated monthly to identify and resolve the exceptions Accounts billing patterns will be monitored per category. Accounts that have reduced consumption will be investigated. Tariff changes and application of tariffs per account is monitored monthly Properties variances are audited based on the pilots from town planning Energy balancing and installation verification will be done to identify areas of high losses 18
20 2.5. Key challenges The organisation is facing the following key challenges (Table 9): A system which is remaining constrained with underperforming assets largely because of the age profile Lower projected sales and losses (technical and non-technical) Over dependency on contractors City Power s operating environment is changing putting pressure on the future utility business model Table 9: Key challenges faced by City Power Challenges SAMWU leadership factional battles and lengthy court proceedings that have paralyzed the LLF processes Ineffective and inefficient shift model Collection rate of 95.58% was achieved which is just below the target Meter reading target of 98% not achieved, 89.6% achieved It took 20 days to repair streetlights against target of 9 days Smart meters are being rejected in some areas resulting in community uprising. Access and entry refusal is still a huge challenge which delays the installation process as properties must be revisited. Incorrect data on the system is also a challenge Mitigation Focused management of Labour Relations and adherence to legal procedure requirements Revision of operating model, organisation structures and resource deployment strategy (shift system vs. home standby system) to determine optimal staff numbers and quantitative utilisation Revised collection rate 92% Improve meter reading rate Decrease in number of days to repair street lights Enhancing Revenue by way of Energy Balancing; Post technical audits; Semi-smart prepaid roll out; Installation of Smart Installation Along with the immediacy of dealing with current circumstances, the key challenge is the ability to manage (or strike the right balance) across three horizons simultaneously: The complexities of current financial constraints Declining sales Getting the organisation fit again within the next 3-5 years Reorienting to a future in which the sector and the organisation s likely role may be radically different (longer term) City Power faces a challenge with immediate action needed to stabilise its operations. Implementing a business turnaround plan is a necessary part of that action. Given the complexity of this situation, plus City Power s need to maintain credibility with the citizens of Johannesburg and provide confidence, it is important that a balance is achieved between taking immediate and visible turnaround action whilst avoiding overpromising on the timetable or the quality of short-term outcomes or results. The company may fail to recover plant performance due to extensive plant degradation, limited/insufficient amounts of maintenance. 19
21 2.6 SWOT analysis Table 10 illustrates and details the strengths and weaknesses of City Power, in addition to an indication of the opportunities and threats faced by the entity: Table 10: SWOT analysis of City Power STRENGTHS ISO accreditation (4 accreditations) Unqualified Audit Documented value chains Supportive stakeholder and Board Pockets of strong subject matter expertise OPPORTUNITIES Expansion to improve network performance Alternative energy sources, Off grid solutions and disruptive forces Community involvement/ engagement Smart Grid realisation Company image/reputation Public-private partnerships Investment in energy management systems Recovery of non-technical losses WEAKNESSES Declining gross margin Revenue management Poor contracts management Non-technical losses Undefined organisational culture Shortage of critical skills Data integrity Poor network performance due to ageing infrastructure Safety related to high risk equipment Overloaded network Outages and slow restoration times to restore power following outages THREATS Self-generation energy Increasing number of non-payment customers Inability to get the required level of capital expenditure to renew infrastructure Theft/vandalism, illegal connections leading to loss of revenue and damage to infrastructure General customer indebtedness Comply with the Cluster programs while trying to refurbish and extend our network Service delivery protests High levels of coal usage leading to increased GHG despite pressures to reduce People setting up their own off grid solutions and becoming independent of the power grid 20

22 2.7. Shareholder alignment In order to obtain a closer insight on the environment that City Power operates in, this section explores the alignment between the entity and its shareholder, the legislative mandate and the entity s organizational structure. City of Johannesburg Figure 5 illustrates the high-level alignment of City Power to its shareholder the City of Johannesburg: Figure 5: Stakeholder alignment between City Power and City of Johannesburg 21

23 There are seven (7) strategic objectives underpinned by key strategic directives which inform the organisation s focus areas and operations. Table 11: Alignment of CoJ priorities and City Power objectives COJ Priority City Power Objective Enhance our financial sustainability Financial sustainability Ensure pro-poor development that addresses inequality and poverty and provides meaningful redress Create a City that responds to the needs of citizens, customers, stakeholders and businesses Preserve our resources for future generations Promote economic development and attract investment towards achieving 5% economic growth that reduces unemployment by 2021 Encourage innovation and efficiency through the Smart City programme Energy sustainability Revenue driven customer centric organisation Strategy driven, risk intelligent and innovative organisation Plant reliability Safe secured smart grid Create a culture of enhanced service delivery with pride Re-energised, refocused and ethical organisation Diphetogo Programme One of the that the City of Johannesburg is prioritising is the Diphetogo Programme. Figure 6: Diphetogo link to City Power interventions The intended strategic direction in responding to the weaknesses and threads and mitigating any possible adverse against Politics, Economics, Social, Technology and Legal issues. Table 12 below show the detailed alignment to Diphetogo programme of COJ. 22
24 Table 12: Diphetogo programme alignment to City Power objectives Diphetogo Impact to be Achieved COJ Target City Power Objectives Finance Infrastructure Social Services Increase in the collection of revenue to increase funding to City projects The collection of R50 Billion in self-generated revenue per annum Revenue driven customer centric organization Financial Sustainability Increase in the capex budget to keep pace with growth A minimum of R20 Billion capex budgeted per annum Financial Sustainability Improved quality of access to reliable, quality basic services across our City Provision of bulk services to communities without access to electricity and water services Increasing access to reliable, quality basic services through providing increased funding to informal settlements Increased instillation of new public lighting in the City Decreased public lighting downtime Improvement in the traffic light downtime in the City The expansion of free basic services to those in greatest need with the City's ESP 9% Expenditure on Repairs and Maintenance on the City's electrical and water infrastructure by % (Capex) spent on refurbishment of electrical and water infrastructure by 2021 Access to electricity 100 Informal Settlements, upgraded through the provision of basic services A working public light for every 50m of pavement 95% of all faulty streetlights on main arterials repaired or replaced within 48hrs by 2021 Reduction of traffic light downtime due to power outages to an average of 24 hours across the City 100% of qualifying residents receiving free basic services via a legitimate, audited indigent database Financial sustainability Energy Sustainability Plant Reliability Revenue driven customer centric organization Economic Development Increasing the number of SMMEs as suppliers to the City The roll out of the City s Work seekers Database Implementation of new SCM regulations to promote SMMEs Fully operational Work seekers Database accessible to all City residents Financial Sustainability Energy Sustainability The rollout of a Youth Skills Program The achievement of young beneficiaries of this program 23
25 Diphetogo Impact to be Achieved COJ Target City Power Objectives Institutional Review Change Management Skills Audit Strategic Vacancy Management Disciplinary Processes The structural realignment of the organisation to strategic direction of the administration Achievement of political alignment with the administration in terms of the direction, strategy and objectives of the City The rollout a skills audit throughout the managerial levels of the City, improving fitness for purpose Rapidity and efficiency in filling vacant positions identified as strategic Ensuring the streamlining of disciplinary processes in the City The achievement of the implementation of the organisational redesign of the City The completion of the skills audit from levels 1-6 in the City, and the full implementation of recommendations arising therefrom The completion of the skills audit from levels 1-6 in the City, and the full implementation of recommendations arising therefrom 90% of all vacancies, identified as strategic, being concluded within 90 days Average life cycle of disciplinary cases reduced to under 90 days and achievement of 90% success rate in all cases Re-energised, refocused and ethical organisation 24
26 Service Level Standards The City of Johannesburg has Services Level Standards (SLS) that are agreed upon by the community and its entities. Below are that apply to City Power Table 13: Service Level Standards Core Service 1. Average hours to restore loss of electricity supply to traffic signals 1 2. Average time taken to repair logged streetlight queries (Motorways and Main Arterials) 3. Average time taken to repair logged streetlight queries (Secondary Roads and Area lighting) Service Level Standard Target 2018/19 <24 hour <6 Days <10 Days 4. Repair work on damaged electricity meters Within 72 hours of logged call Service Level Standard Target 2019/20 Service Level Standard Target 2020/21 Less than 18 hours Less than 15 hours 95% less than 72 hours 95% less than 48 hours Less than 8 days Less than 6 days Within 72 hours of logged call Within 72 hours of logged call 30% within 1.5 hours 30% within 1.5 hours 30% within 1.5 hours 5. Restoration of power supply after forced interruption 6. Restoration of power supply for planned interruption 7. Investigation of illegal connections 8. Read all meters as per CoJ download file 2 and accurately read meters for billing by CoJ 60% within 3.5 hours 60% within 3.5 hours 60% within 3.5 hours 90% within 7.5 hours 90% within 7.5 hours 90% within 7.5 hours 98% within 24 hours 98% within 24 hours 98% within 24 hours 100% within 7 days 100% within 7 days 100% within 7 days Within 8 hours Investigation of illegal connections reported for a single property concluded within 24 hours of logged call Investigation of illegal connections reported for multiple properties concluded within 21 days of logged call 98% accurate automated meter reading for LPUs 3 95% accurate manual meter reading for domestic Less than 8 hours Investigation of illegal connections reported for a single property concluded within 24 hours of logged call Investigation of illegal connections reported for multiple properties concluded within 21 days of logged call 98% accurate automated meter reading for LPUs 3 95% accurate manual meter reading for domestic Less than 8 hours Investigation of illegal connections reported for a single property concluded within 24 hours of logged call Investigation of illegal connections reported for multiple properties concluded within 21 days of logged call 98% accurate automated meter reading for LPUs 3 95% accurate manual meter reading for domestic 25
27 Core Service 9. Prepaid meter conversion from Smart Meter 10. Communication of service interruption 11. Response time for City Power walk in queries Service Level Standard Target 2018/19 Within 3 days of receipt of complete application and payment Planned: 7 days before interruption Service Level Standard Target 2019/20 Within 3 days of receipt of complete application and payment Planned: 7 days before interruption Service Level Standard Target 2020/21 Within 3 days of receipt of complete application and payment Planned: 7 days before interruption Unplanned: Immediately Unplanned: Immediately Unplanned: Immediately All queries acknowledged within 1 hour 1 This KPI measures the average time taken to restore loss of electricity supply to traffic signals All queries acknowledged within 1 hour All queries acknowledged within 1 hour 2 City Power receives a file with meters to be read for billing purposes, which is called a Download file. Upon receiving this file, City Power sends it to the meter reading contractors to physically read meters in the field for conventional meters. The readings for the automated meters are extracted from the Meter Data Management (MDM) system and sent to CoJ for billing purposes. 3 Large Power User (commercial buildings, large hotels, factories etc.) 26
28 National Treasury National Treasury has come up with Circular 88, which all municipalities have to comply with. This table 14 illustrates City Power s response to circular 88: Table 14: National Treasury programme Outcome Outcome Indicator Output Indicator City Power Business Plan Indicator EE1. Improved access to electricity EE1.1. Percentage of households with access to electricity EE1.11 Number of dwellings provided with connections to the mains electricity supply by the municipality 1580 units (structures) in informal settlements with access to electricity EE2. Improved affordability of electricity EE2.1 Households receiving Free Basic Electricity as a percentage of all households with electricity connections EE2.11 FBE provision levels as a percentage of total residential electricity provision (in terms of MWh) kwh FBE provided in City Power area of Supply EE3. Improved reliability of electricity service EE3.1 System Average Interruption Duration Index EE3.2 Customer Average Interruption Duration Index EE3.11 Percentage of unplanned outages that are restored to supply within industry standard timeframes Restoration of power supply after forced interruption 30% within 1.5 hours, 60% within 3.5 hours, 90% within 7.5 hours, 98% within 24 hours, 100% within 7 days EE3.3 System Average Interruption Frequency Index EE3.21 Percentage of Planned Maintenance Performed Restoration of power supply for planned interruption within 8 hours EE3.4 Customer Average Interruption Frequency Index EE4. Improved energy sustainability EE4.1 Renewable energy capacity available within the municipal jurisdiction as a percentage of Eskom supply capacity to the municipality EE4.11 Total renewable energy capacity available through IPPs EE4.12 Installed capacity of embedded generators on the municipal distribution network 21,56 MW from alternative sources 15 MW of installed capacity of embedded generators 27

29 3. Strategy overview 3.1. Strategic alignment The City of Johannesburg has embarked upon journey to become a sustainable and smart City of the future in line with the principals of the Growth and Development Strategy 2040 and in line with the Vision, Mission, Pillars and priorities of the shareholder. Energy will be a critical component in realising these aspirations. Whilst energy is key to unlocking the economic and socio-economic development objectives, unchecked consumption of coal-based power will increase carbon and energy intensity, threaten economic and environmental sustainability and the quality of living within the City. An environmental scan is a process, which results in the identification and monitoring of factors from both inside and outside the organization that may impact the long-term viability of the organisation. For City Power, the Environmental scan provides the Board and Management Team with information that assists them in decision-making. Further to this, City Power has put in place key performance indicators (KPIs) that align to budgets, its shareholder objectives and National Treasury in order to drive the required performance of the organisation. These KPIs, are derived with careful consideration and input from City Power s board of directors, the shareholder and may be reviewed or amended at mid-term in accordance with the MFMA. The operating model outlines how the organisation will operationalise the strategy map: Figure 7: City Power operating model 28
30 3.2. Priority implementation plan The proposed City Power KPIs are aligned to the organisation s objectives, and their definitions are shown in Table 15 and Table 16. Table 15: City Power KPIs City Power Objective Key Performance Indicator Year-To- Date Performance 2018/19 Targets (Key Performance Indicators 2018/19 Quarterly targets 2019/ /21 Q1 Q2 Q3 Q4 Re-energised, refocused and ethical organisation Percentage Vacancy Rate Average number days taken to fill critical vacancies, Percentage Learning Expenditure as a percentage of Payroll Percentage Leadership development plan achievement Employee satisfaction index (Mean) Percentage of Employment Equity (EE) employees Percentage of Gender Equity (GE) employees Percentage of People with Disabilities (PWD) employees Percentage of employees receiving performance coaching and review as per the policy New 14,01% 12% Vacancy Rate Average of 90 days taken to fill critical vacancies 1,61% 1% Learning Expenditure as a % of Payroll Plan approved 100% Leadership development plan achievement 3,36 3,2 Employees satisfaction index (Mean) KPI will be replaced with Leadership Effectiveness Index. To be determined Annual Target The Employee Satisfaction survey only takes place every 3 years KPI will be replaced with Leadership Effectiveness Index. To be determined The Employee Satisfaction survey only takes place every 3 years 91,81% 85% of EE employees ,95% 27% of GE employees ,23% 2% of PWD employees New 100% of employees receiving performance coaching and review as per the policy
31 City Power Objective Key Performance Indicator Year-To- Date Performance 2018/19 Targets (Key Performance Indicators 2018/19 Quarterly targets 2019/ /21 Q1 Q2 Q3 Q4 Plant Reliability Financial Sustainability Resolution of disciplinary cases within 90 days Percentage compliance to NRS048 Percentage of net asset value spend on preventative maintenance New Resolve disciplinary cases within 90 days 99,56% 95% compliance to NRS New 7,46% of net asset value spend on preventative maintenance ,5 2, Percentage gross margin 23,25% 31% gross margin Percentage total losses 26,3% 19% total losses, Percentage capex spent 37% 95% capex spent, Energy Sustainability Number of SMME s supported Percentage operational budget spent Percentage valid invoices paid within 30 days, Tons CO₂ offset in greenhouse gas emissions Number public lights installed Number units (structures) in informal settlements with access to electricity Beneficiaries of job opportunities MW from alternative sources MW of installed capacity of embedded generators New 100 of SMME s supported, New 95% operational budget spent, New 100% valid invoices paid within 30 days 30047, ,7 Tons CO₂ offset in greenhouse gas emissions, , , , Public lighting units (structures) in informal settlements with access to electricity beneficiaries of job opportunities, New New 21,56 MW from alternative sources 15 MW of installed capacity of embedded generators, ,
32 City Power Objective Key Performance Indicator Year-To- Date Performance 2018/19 Targets (Key Performance Indicators 2018/19 Quarterly targets 2019/ /21 Q1 Q2 Q3 Q4 Revenue Driven Customer Centricity Strategy driven, risk intelligent and innovative organisation Percentage spent on Refurbishment Percentage spend on infrastructure investment Monthly reporting into Capital Management System (iris) Kilo Watt hour provided for Free Basic Electricity Percentage reputation index Percentage achievement of Service Level Standards (SLS) Percentage performance targets achieved Percentage resolution of Auditor General / Internal Audit findings as per management comments New 17% spent on Refurbishment, New 31% spend on infrastructure investment, New 80% monthly reporting into Capital Management System (iris) New kwh provided for FBE, % 75% reputation index, % 80% achievement of SLS New New 65% performance targets achieve 95% resolution of Auditor General / Internal Audit findings as per management comments
33 Table 16 below outlines the City Power KPIs definitions. City Power Objective Key Performance Indicator Table 16: City Power KPIs Definitions Definition and measure objective Reenergised, refocused and ethical organisation Plant Reliability Financial Sustainability Percentage Vacancy Rate This indicator measures percentage of positions that are vacant compered to staff compliment Average number days taken to fill critical The number of days taken to fill in vacancy vacancies, Percentage Learning Expenditure as a The learning expenditure as a percentage spent against the Payroll percentage of Payroll Percentage Leadership development plan The percentage of the leadership development interventions (milestones) against the approved leadership achievement development plan Employee satisfaction index (Mean) The Mean of satisfaction level of internal employees. The survey is conducted by CoJ for all departments and entities Percentage of Employment Equity (EE) The number of Employment Equity employees as a percentage of the total employees employees Percentage of Gender Equity (GE) employees The number of female employees as a percentage of the total employees Percentage of People with Disabilities (PWD) The number of employees who have voluntarily declared their disabilities as a percentage of the total employees employees Percentage of employees receiving The percentage of employees receiving performance coaching and review as per the policy performance coaching and review as per the policy Resolution of disciplinary cases within 90 days The number of days allowed to resolve any disciplinary case Percentage compliance to NRS048 Percentage of net asset value spend on preventative maintenance Percentage gross margin Percentage total losses Percentage capex spent Number of SMME s supported Percentage operational budget spent The Quality of Supply as outlined by NERSA e.g. Voltage characteristics, compatibility levels, limits and assessment methods (National Regulatory Standard 048) The percentage of net asset value spend on preventative maintenance Total Service charges/ (Bulk Purchases- Service Charges) and represents the portion of each rand of revenue that the company retains as gross profit. The Billed units (KWh) as a percentage of purchased units (KWh). (Less: Self usage, street light usage) The Capex spent on projects that the organisation has control over (excludes projects funded by public contributions and insurance claims). The number of SMME s supported This indicator measures the Opex spent by the organization compared to budget 32
34 City Power Objective Key Performance Indicator Definition and measure objective Energy Sustainability Revenue Driven Customer Centricity Strategy driven, risk intelligent and innovative organisation Percentage valid invoices paid within 30 days, This indicator measure percentage of valid invoices paid within 30 days Tons CO₂ offset in greenhouse gas emissions The Total Green House Gasses Reduction Contribution: tonnes of CO2 emissions per mega Watt hour Number public lights installed Number units (structures) in informal settlements with access to electricity Beneficiaries of job opportunities Public lighting refers to infrastructure for illumination of streets in the City of Joburg. This KPI measures the number of public lights installed The number of units (structures) in informal settlements that are electrified The number of job opportunities created MW from alternative sources The Mega Watts of electricity from alternative sources MW of installed capacity of embedded The Mega Watts of installed capacity of embedded generators generators Percentage spent on Refurbishment The percentage of Capex spent on refurbishment projects Percentage spend on infrastructure investment The percentage spend on infrastructure investment Monthly reporting into Capital Management The percentage of projects reported on iris System (iris) Kilo Watt hour provided for Free Basic The numbers for Number of kwh provided for Free Basic Electricity (FBE) have been capped as City Power Electricity depends on CoJ to provide a list of customers who qualifies and should get the FBE. Percentage reputation index Percentage positive sentiment from media and the percentage customer satisfaction Percentage achievement of Service Level Standards (SLS) Percentage performance targets achieved Percentage resolution of Auditor General / Internal Audit findings as per management comments This indicator measures the service level standards with COJ. It is made up of the following KPIs: 1. Average hours to restore loss of electricity supply to traffic signals 2. Average time taken to repair logged streetlight queries (Motorways and Main Arterials) 3. Average time taken to repair logged streetlight queries (Secondary Roads and Area lighting) 4. Repair work on damaged electricity meters 5. Restoration of power supply after forced interruption 6. Restoration of power supply for planned interruption 7. Investigation of illegal connections 8. Read all meters as per CoJ download file and accurately read meters for billing by CoJ 9. Prepaid meter conversion from Smart Meter 10. Communication of service interruption 11. Response time for walk in queries The number of KPIs achieved compared to total number of KPIs at company level The number of AG and IA findings resolved as per management comments 33


35 4. Day to Day Operations: Group plans City Power in order to achieve its mandate, has organised itself into specific groups that are individually accountable to deliver on programmes that are aligned to its strategic objectives. The operating model (Figure 8) highlights how these groups are organised in order to maximise efficiencies in delivering on City Power s objectives. This section below highlights all the groups programmes and objectives. Figure 8: City Power Operating Model 34
36 4.1. Business sustainability Group mandate To provide an integrated strategy, planning, risk management, compliance, performance monitoring, evaluation and reporting services to City Power. The development of an integrated business sustainability framework Table 17: Business sustainability programmes Programmes Programme Activities Strategic Objectives Programme Objective Expected Output Timeline Defining strategic Plant Reliability Development and Draft Policy and requirements Energy implementation of Framework Strategy Alignment Sustainability an integrated Development Workshops Financial sustainability Communication to Bottom up and Top Sustainability Framework in City the whole Down Business Strategy driven, Power organization Planning workshops risk intelligent and Validation, innovative Integration and organization consolidation Independent Verification, Finalization approval and adoption Communication and Roadshows for 2018/19 financial year Strategic direction Rethink and Alignment and Planning Strategy Alignment Workshops Bottom up and Top Down Business Planning workshops Validation, Integration and consolidation (due end March) Board workshop (16 April 2018) Strategy driven, risk intelligent and innovative organization Alignment of CP Strategic direction and Business Plan to inform optimal resource allocation by 30 June 2018 to ensure Service Delivery, Shareholder Value and Financial Sustainability Aligned, documented Business strategy and Business Plan Communicated to the whole organisation June 2018: Draft innovation programmes September 2018: Consultation Completion December 2018: Approval by all governance structures Implementation start January 2019 April 2018 Consultation Completion May 2018 Approval by all governance structures Implementation 1 July
37 Programmes Programme Activities Strategic Objectives Programme Objective Expected Output Timeline Independent Verification, Finalization (end April 2018) approval and adoption (end May 2018) Communication and Roadshows for 2018/19 financial year (July 2018) Innovation Programme Risk Alignment Programme Defining of requirements Innovation system workshops Bottom up and Top Down Innovation workshops Validation, Integration and consolidation Independent Verification, Finalization approval and adoption Communication and Roadshows for 2018/19 financial year Strategy alignment and planning workshops for Risk input Establishment of the ERM working group and plans Defining risk aggregation model for EXCO on emerging risks with common causes for Strategy driven, risk intelligent and innovative organization Strategy driven, risk intelligent and innovative organization Re-energised, refocused and ethical organization 36 Development and implementation of an Innovation system for City Power To ensure strategic alignment and embed risk thinking in execution of the turnaround plan in the short, medium to long term Aligned, documented Business strategy and Business Plan Communicated to the whole organization Clear tracking of risk treatment plans to fast track the turnaround deliverables Closing the revenue gap and realising short term gains September 2018 Consultation Completion December 2018 Approval by all governance structures Implementation 1 January 2018 April 2018 operational risks identified and analysed May 2018 risk aggregation model finalised June 2018 Risk performance criteria approved
38 Programmes Programme Activities Strategic Objectives Programme Objective Expected Output Timeline formulation of risk responses Developing Risk Performance Framework for Group Communication on insurance implications for the organisation Operational risk assessments Performance monitoring, evaluation and reporting programme Compliance Programme Definition of stakeholder requirements Development of preliminary dashboards Timeous reporting of performance Finalisation of dashboards Benefit realisation tracking Definition of stakeholder requirements Environmental scanning Development of preliminary integrated system Stakeholder engagement Final compliance plan Compliance implementation Strategy driven, risk intelligent and innovative organization Revenue driven customer centric organization Strategy driven, risk intelligent and innovative organization Re-energized, refocused and ethical organization Timeous visibility of company and group performance to all stakeholders in the organisation to assist with better decision making Timeous visibility of company compliance requirement and management Benefit monitoring system in place Compliance management plan in place Draft Performance monitoring, evaluation and reporting system by December 2018 Final Performance monitoring, evaluation and reporting system by December 2019 Draft Compliance plan by December 2018 Final Compliance plan by June
39 Programmes Programme Activities Strategic Objectives Programme Objective Expected Output Timeline Definition of Strategy driven, Timeous visibility of Knowledge stakeholder risk intelligent and company knowledge management plan requirements innovative requirement and in place Environmental scan organization management Development of preliminary integrated system Draft system Stakeholder engagement Final compliance plan implementation Knowledge Management Programme Draft knowledge Management plan by December 2018 Final knowledge Management plan by June Human Resources and Transformation Group mandate HR and Transformation is mandated to lead the organisational renewal efforts of re-energising and re-focusing our people as well as positioning our organisation as an ethical entity. Table 18: Human resources and transformation programmes Programme Programme Activities Strategic Objectives Capacity - quantitative and qualitative utilisation of staff program Review existing operating model Revise the organisation structure Obtain approval for the revised organisation structure Communicate and socialise the revised organisation structure Ensure the deployment and placement of staff in the right places and based on their strengths and capabilities Reenergised, refocused, and ethical organisation Programme Objective Expected Output Timeline To ensure appropriate staffing and optimal use of the workforce in a manner in which business operations are aligned with the strategic objectives of the leadership Organisation structure that is aligned to the defined strategic direction Elimination of none valueadding positions Organisation structure that has a significantly High level structure workforce transition - 1 Jan 18 Low level structure approval - 30 Mar 18 Vacancy rate revised - 30 Mar 18 38
40 Programme Programme Activities Strategic Objectives Negotiations of organised labour on resource deployment strategy (shift, extended standby, home standby, six-day workers or standard five-day workers) Critical workforce segmentation (strategic roles, core roles, requisite roles and misplaced roles) Obtain approval for critical vacancies to be filled in 2018/19 to bring vacancy rate down to 12% Programme Objective Expected Output Timeline reduced vacancy rate Role and mandate clarity Optimal staff utilisation Improved productivity Migration principles of low level structure signed off by EXCO - 30 Apr 18 Negotiations with organised labour on resource deployment strategy (shift/standby) finalised - 30 Jun 18 Jobs reprofiled and re-graded - 31 Dec 18 Recruitment per position concluded within 90 days ongoing Vacancy rate target of 12% achieved 31 Jul 19 39
41 Programme Programme Activities Strategic Objectives Review and update the City Reenergised, Capability Power Leadership Charter leadership Development of a detailed refocused, effectiveness competency model per and ethical program leadership segment (Informal organisation and Emerging Leaders; People leaders; Operational leaders; and Strategic Leaders) including definitions, desired behaviours and competency measurements Implement 360-degree multirate feedback process that assess key competencies Implement cognitive ability assessments to measure the critical thinking of our leaders, an essential capability required for managerial and executive roles where problems are often ambiguous and require the ability to quickly analyse data and draw inferences with limited information Implement personality assessments to assess key personality traits that indicate long-term patterns in behaviour and personal preferences. This helps to determine the overall fit within a role and the challenges he or she may face over the long term Create and implement a 12- month leadership blended learning program to identify, develop, and retain leaders who possess the capabilities the organisation needs Map the leadership on a ninebox grid on both performance and potential Programme Objective Expected Output Timeline Empowered leadership lead the change agenda: Determine the most effective leadership style(s) for City Power Build individual and collective leadership capability to drive results and shape the organisational culture Reduce gaps in current leadership s competence, knowledge and experience Build talent and leadership succession pools and improve relevant bench strengths Proactively defining the City Power Leadership Brand and building the right Leadership Culture in which leaders change the minds of others and move the organisation forward to accomplish identified goals Producing highly competent and committed company executives, senior, middle and lower management teams Design Phase - End June 2018 Delivery Phase - 12 months (Jun 18 Jun 19) Embed Phase - 12 months (Jan 19 Dec 19) 40
42 Programme Programme Activities Strategic Objectives Offer coaching in three categories: coaching for technical skills; coaching for managerial skills, and coaching for interpersonal skills Establish a supportive organisational culture wherein the organisation provides training on strategic skills; define and encourage rotational job assignments; and create a High Performing Organisation Work Group as a forum leaders can use to exchange ideas and solutions Roll out SIMPLE Performance Reenergised, Capability simple Management performance and Set expectations Clarify refocused, development individual goals for and ethical program Quantity/Quality/Timeline/Cost organisation (QQTC) measures cascaded from Group Balanced Scorecards (July/August 2018) Invite Commitment At individual level, communicate performance bonus criteria and calculations; and at company level clarify connection by communicating gate keepers and their link to 2022 VUCA vision (September 2018) Measure Progress Monthly/Quarterly/Bi- Annually/Annually results for Quantity/Quality/ Timeline/Cost (QQTC) measures Provide Feedback Frequent Quality Conversations - Weekly/Monthly/Quarterly/Bi- Annually/Annually Programme Objective Expected Output Timeline Competent workforce driving results: Alignment of Individual/Group/Company Goals and Results Planned development of the workforce Developing the right people with the right skills for the right job Improved business results Optimising Mandatory Grant payment Conduct Competency Modelling - 30 Jun 18 Roll out SIMPLE Performance Management - 30 Jun 18 Implement Work Skills Plan/Annual Training Plan aligned to the Energy and Water SETA Phase 1 SDF and Organisation registration - Feb Mar 18 Phase 2 Source data and submit - Feb Apr 18 41
43 Programme Programme Activities Strategic Objectives Link to consequences Roll out Performance Enhancement Program which includes Discipline/Counselling/Training Evaluate effectiveness Measure alignment between Individual scores/group Scores/Company Scores Implement culture change targeting the four stakeholders: Appraisers who must evaluate performance; Appraisees whose performance is being assessed; Human Resources professionals who must administer the system, and Senior Management that must lead the organisation into the future Conduct Competency Modelling Qualification catalogue Competency library Skills audit Implement Work Skills Plan/Annual Training Plan to address performance gaps, career aspirations and succession needs Phase 1 SDF and Organisation registration Phase 2 Source data and submit Phase 3 Grant payment process Define the Code of Conduct to Reenergised, Commitment set out the organization s core culture change values that, together with a refocused, program compelling mission and vision, and ethical are the foundations of the organisation leadership s culture expectations Programme Objective Expected Output Timeline Defining and embedding The City Power Way defined to drive Collective Ambition As-One, which is a summary of how leaders and employees think about why they exist, what they When an organization s culture and reward systems are aligned with its strategy and customers, good Phase 3 Grant payment process - Jan/Jul 18 Jun 19 On going 42
44 Programme Programme Activities Strategic Objectives Shape the required capabilities for change agents that provide a beacon and influencer of new culture behaviours and mindsets Identify the desired culture to support the change Develop interventions to shift culture Prioritise the key culture shifts that are critical to the early momentum and sustainability of the City Power Way Design supporting procedures and infrastructure to drive the right behaviours Establish leadership alignment and prioritise key behaviours for leaders (for role modelling) that will underpin the success of the City Power Way journey Introduce reinforcing mechanisms for leaders such as workstream accountability, performance expectations and rewards linkage Provide consistent and integrated change and communication support and embed the City Power Way Build the knowledge and skills to ensure a smooth transition Determine the drivers for Reenergised, Commitment employee engagement employee Revise the recognition and refocused, recognition program award section in the and ethical Remuneration and Benefits organisation policy Identify and define goals for participant groups Develop Criteria for Recognition Programme Objective Expected Output Timeline hope to accomplish, how they will collaborate to achieve their ambition, and how their brand promise aligns with their core values of the organisation. The City Power Way will guide the efforts of employees and leaders as they collaborate to shape a collective ambition that supersedes individual goals and taking into account the key elements required to achieve and sustain excellence in the 2022 VUCA vision The programs anchor the INvolved and INformed pillars of the I am IN campaign The most proven principle of management and motivation known to mankind is the simple notion that you get what you reward, i.e. the behaviours and performance that is noticed, inspected, recognized, things happen. This alignment creates an energy that drives individual and team performance, innovation, customer confidence, and value creation which is what 2022 VUCA vision is about Aims to boost employee morale and motivation levels Inspires leaders, teams and employees to support and actively Program to be activated 1 July
45 Programme Programme Activities Strategic Objectives Determine monetary and nonmonetary rewards and recognition methods to apply monthly/quarterly/annually Establish the Rewards and Recognition Governance Structure as well as the Adjudication Committees Establish SLA with Internal Audit for auditing of the process Communicate to all Solicit employees view about the programme Activate Programme Evaluate Programme and determine if behaviour has changed Commitment employee wellbeing program Conduct assessments of assigned job tasks to identify hazards and risky factors Identify jobs that predisposes employees to the onset of early signs of, or are actually causing musculo-skeletal diseases (MSDs) Pursue/advise on purchases of ergonomically sound office chairs (recommended by RA report by a hygienist/ergonomist) Design of work stations Modification of work practices through employee awareness Reenergised, refocused, and ethical organisation Programme Objective Expected Output Timeline appreciated, rewarded, incentivized or acknowledged will be repeated by those who are acknowledged and perhaps others who noticed or heard what happened The program is designed to build credible commitment through an employee recognition program that fairly identifies employees who excel far beyond their call of duty and where evidence of results or behaviours exists in every respect; and to link recognition as a reenforcing mechanism for the desired behaviours for the City Power Way defined As-One culture The programs anchors the INspired pillar of the I am IN campaign To implement an effective physical ergonomics plan which will ensure compliance, heed concerns of employees and nurture the culture of acceptance that a worker s health and safety rights are human rights To increase worker efficiency and reduce the likelihood of excessive physical and/or mental strain on employees, thereby improving productivity, with obvious participate in the 2022 VUCA vision journey at various levels Compliments and positively reinforces the As-One Culture change management activities Recognises individuals who represent and display behaviours that support and promote the change process Encourages repeat behaviour and influence others to follow Improved work practices, leading to increased efficiency, productivity and competitiveness Improved physical, psychological and social wellbeing of employees Improved job satisfaction, morale, and Baseline office ergonomics surveys - December 2018 March 2019 Development of an ergonomics health surveillance programme with identified risk job categories - May
46 Programme Programme Activities Strategic Objectives programmes aimed at behaviour change Provision of therapeutic counselling Provision of CISD (Critical Incidence Stress Debriefing) Referral to specialist service providers and community resources Conduct programmes and campaigns in line with identified trends and national health calendar Marketing of EAP services and related programmes Compliance HR and transformation regulatory compliance awareness program Engagements with groups impacted by the policy Policies vetted by Legal and Internal Audit Consultation with Labour Submission to EXCO/Social, Ethics & HR Committee/Board for approval Create awareness through workshops Placing of reviewed policies on SharePoint Develop a communication plan Conduct workshops on policies Reenergised, refocused, and ethical organisation Programme Objective Expected Output Timeline benefits for workers and the organization To provide ongoing professional counselling services to employees and immediate family members To capacitate and support line in managing affected/troubled employees To enhance financial and debt management support To conduct employee wellness awareness and empowerment programmes in relation to the business needs, trends and patterns To restore work-life balance To ensure that City Power employees are informed about the HR policies To create conditions for employee engagement, motivation and wellbeing To ensure that all HR activities are aligned and comply with legislative and regulatory requirements employee retention Reduced absenteeism Reduced disruption of operations. Higher return-towork rates following injury or illness Reduced costs for workers compensation claims Harmonised relationship between manager and employee Support base for both employer and employee (Adherence to employment regulations/care and advocacy) Improved productivity Reduction in suspensions, disciplinary hearings and grievances Legislative amendments are incorporated into policy Compliance risks are properly EAP programmes - July 2018 June 2019 EW awareness programmes - July 2018 June 2019 Workshops to be concluded 31 July
47 Programme Programme Activities Strategic Programme Objective Expected Output Timeline Objectives Measure awareness levels controlled and mitigated Compliance establish local management forum 31 July 2018 Compliance employee records integrity Make recommendations for the review of the Rules of Engagement Review the current Conditions of Service Identify matters which require consultation and remove them from the current Conditions of Service Get the necessary approval for the amendments of the Conditions of Service Consult/negotiate with Organised Labour on the proposed changes to the Conditions of Service Workshop the Conditions of Service with all City Power employees Ensure personal file creation for all employees Ensure completeness of all files Verify content accuracy of employee files Digitisation of employee data on SharePoint Reenergised, refocused, and ethical organisation Reenergised, refocused, and ethical organisation To provide platform for matters of mutual interest to be negotiated at the LLF and/or LMC To empower management to regulate policy matters as well provide a platform for such matters to be consulted on To correct and reconstruct employee data and keep employee records in line with ISO standards Timeous implementation of management decisions Management empowerment to take decisions on key business matters New conditions aligned to the current strategic imperatives Complete employee files that drive operational efficiencies but also easily support the audit process ISO compliance Review of all files and digitisation by 30 June
48 4.3. Finance Group mandate To lead in the development of the financial strategy of the company, directing, and monitoring the financial health, sustainability and stability of the business. Table 19: Finance programmes Programmes Asset Management Compliance SCM Processes management Programme Key Activities Completion certificates Technical closure of projects Design of the template Population of the template with approved budget Engagement with various groups Strategic Programme Objectives Output Timeline Objectives Compliance to Timeous GRAP capitalisation of Capital work in progress; Timeous 31 depreciation of st May 2018 assets; Timeous wear and tear allowances from the Receiver. Financial sustainability Establishment of an Organisational Demand Plan Establish a demand plan for each Division within City Power; Demand Plan information to inform the development of the acquisition plan. 25 th June 2018 Programmes SCM Processes management Programme Key Activities Development of acquisition plan Continuous training of staff Strategic Objectives Financial sustainability Programme Objectives Output Timeline Timeous completion of supply chain process Proper planning leading to reduced time taken to complete procurement process; 31 st July
49 SCM Processes Training Conducting workshops Financial sustainability Compliance to SCM related regulatory framework Compliance to regulatory framework; Improved service delivery; Availability of all material in time; Improved staff morale Improved compliance to regulatory framework Improved working relationships between SCM and all divisions. Quarter 1 of 2018/19 FY 48
50 4.4. Enterprise support Group mandate The Enterprise Support division is a horizontal and diverse structure, which acts as an enabler to attain business set targets and objectives. The group is poised to make a meaningful contribution towards such through the provision of an effective ICT, Data and Process mapping, Physical Security, Logistics and SHERQ services. Conduct Cable Theft and Vandalism Hot Spot Security Risk Assessment Table 20: Enterprise support programmes Programmes Programme Activities Strategic Objectives Programme Objective Output Timeline Identify cable theft Strategy driven, To reduce cable Reduction of 2018/2019 and vandalism risk intelligent and theft and vandalism outages hotspots. innovative To improve service Conduct security risk organisation delivery, assessment on Safe, secured shareholder value each. smart grid and financial Submit reports and sustainability. recommendations to internal clients. Conduct Substations Security Risk Assessment Develop Load Centres Security Inspection Plan Develop Contractors Security Policy & Standards Develop security risk assessment schedule Conduct security risk assessments Submit reports with recommendations Develop load centre security condition inspection plan. Conduct security condition inspections. Submit reports with recommendations Conduct research Develop policy and standards Submit for consultation and inputs Strategy driven, risk intelligent and innovative organisation Plant reliability Plant reliability Strategy driven, risk intelligent and innovative organisation Re-energised, refocused and ethical organisation 49 To improve security of substations. To minimize manifestation of security threats and incidents at substations To improve security condition of load centres To minimize vandalism, thus improve reliable electricity supply To limit number of foreign nationals working on network infrastructure to scarce skills only. Safe, secure and resilient substations Minimal security incidents at substations Improved security condition of load centres Reduction in load centre vandalism Improved contractor due diligence Minimal contractorrelated security risks and incidents 2018/ / /2019
51 Programmes Programme Activities Strategic Objectives Programme Objective Output Timeline Submit for approval To improve Implement contractors integrity and ethical conduct. To reduce network infrastructure Develop Security Screening Policy Roll Out Integrated Security Systems Capacitate Regional Warehouse with stock levels Incorporate legal inputs and submit for policy for approval. Formulate and conclude MOU with Group Forensic Investigations to conduct vetting Install dual perimeter fence, perimeter lighting and perimeter intruder detection at Roodetown and Prospect substations. Roll out of ISS (access control and CCTV systems) at Lenasia Depot Appointment of material services providers. Monthly inventory count Stock distribution to regional warehouses. Maintain reorder point on SAP. Training and awareness of inventory policy Re-energised, refocused and ethical organisation Revenue driven customer centric organisation Safe secured smart grid Financial sustainability Energy sustainability Plant reliability Financial sustainability security incidents To comply with legislative provisions To improve employee integrity and ethics To reduce cable theft and vandalism Deter, deflect, delay, detect, respond to and contain intrusion into Roodetown and Prospect bulk intake substations and Lenasia depot To ensure that all material is in contracts. To reduce obsolete levels of materials To capacitate regional warehouse with stock levels. To maintain optimal levels material. Review inventory management policy Improved employee integrity and ethics Reduction of personnel security incidents Improved security and ultimately protection of the bulk-intake substations and Lenasia depot Improve turnaround time. Improve customer service Support efforts to improve restoration times 2018/ /2019 Appointment of material services providers [June 2019] Monthly inventory count [Monthly] Stock distribution to regional warehouses [Monthly] Maintain reorder point on SAP [Monthly] Training and awareness of 50
52 Programmes Programme Activities Strategic Objectives Programme Objective Output Timeline inventory policy [June 2018] Normalisation of Fleet operating hours Implement Telco Network solution Appointment of generators services providers. Monthly vehicle audits Ensure availability of standby generators Training and awareness of fleet policy Complete the implementation and commissioning of the MPLS core; 4 months Supply and commissioning of the networking equipment for Data Centre and LAN for Reuven and Roodepoort; 8 Months Supply and commissioning of the networking equipment for the depots; 18 Months Revenue driven customer centric organisation Financial sustainability Strategy driven, risk intelligent and innovative organisation Safe, secured smart grid To have mobile standby generators in place. To review the current drivers database. To develop SLA with internal customers. To develop a process that is aligned with the company s winter strategy. Approval of General vehicle utilisation policy Review the current fleet operating hours in order to meet the business requirements To implement Telco next generation MPLS network solution that will provide the communications platform for Smart Grid Improve turnaround time. Improve customer service. Support efforts to improve restoration times Capacity for high bandwidth Smart Grid applications. Real time communication. High availability and reliability. Ability to add new innovative solutions Create the required services for Last Mile network Appointment of generators services providers [June 2018] Monthly vehicle audits [Monthly] Ensure availability of generators [Monthly] Maintain reorder point on SAP [Monthly] Training and awareness of fleet policy [June 2018] June
53 Programmes Programme Activities Strategic Objectives Programme Objective Output Timeline Supply and commissioning of management software: 3 months Re-cabling of LAN with CAT 6: 12 months Supply and commission of unified messaging: 6 months Create Redundancy for Palo Alto device Create redundancy for core switch Prevention of Data Leak Open tender for Redundant Palo Alto device Evaluate tender Select the best company to deploy the Palo Alto based on tender results Implement the Redundant Palo Alto Firewall Test failover for the redundant device Open tender for Redundant Cisco Core Switch Evaluate tender Select the best company to deploy the Cisco Core Switch based on tender results Implement the Redundant Cisco Core Switch Test failover for the redundant device Open tender for Redundant Cisco Core Switch Evaluate tender. Financial sustainability Strategy driven, risk intelligent and innovative organisation Financial sustainability Strategy driven, risk intelligent and innovative organisation Strategy driven, risk intelligent and innovative organisation 52 To provide redundancy in order to protect and secure the City Power ICT Corporate Network by filtering the internet sites visited by internal employees and to allow internet access for all internal employees To provide redundancy for the ICT Network To provide redundancy for the ICT Network Redundancy created for the City Power ICT environment that caters for Internet access and Internet Filtering. Business Continuity in case of hardware failure Redundancy created for the City Power ICT Network. Business Continuity in case of hardware failure Redundancy created for the City Power ICT Network. June 2018 [70%] June 2019 [100%] June 2018 [70%] June 2019 [100%] June 2018 [70%] June 2019 [100%]
54 Programmes Programme Activities Strategic Objectives Programme Objective Output Timeline Select the best Financial Business company to deploy the Cisco Core Switch based on tender results Implement the Redundant Cisco Core Switch Test failover for the redundant device sustainability Continuity in case of hardware failure Provide Cloud Solution Decide which systems/applications will be hosted on premise (private cloud) and which ones will be hosted off premise (Public Cloud) Obtain budget to implement both the private cloud, using the hardware already purchased, and for the public cloud. Appoint the strategic partner to implement the private/public platform. Implement the private/public (hybrid) cloud platform. Test the implemented platform Strategy driven, risk intelligent and innovative Revenue driven customer centric organisation 53 To have a hybrid cloud platform (Private and Public). To have all City Power systems running on the one platform (on premise/private cloud), which will enable resources sharing across the environment, and to have other systems to run off premise (public cloud). To alleviate the strain on the hardware equipment by hosting some of the systems/applications on the public cloud. To have the platform accessed from anywhere in the internet. To allow automation on the environment which will improve service delivery. To have all systems monitored with one To have one managed platform for all City Power systems June 2018 [20%] June 2019 [100%]
55 Programmes Programme Activities Strategic Objectives Programme Objective Output Timeline monitoring system from a central point Enable VM Ware Support Upgrade Microsoft Exchange Upgrade Connected Backup (Data-Pro) Restoration Implement Disk-disk-tape back-up solution Renew all expired licenses with VMware. Get a VMware verified partner to perform the VMware Upgrade to the supported version. Plan and perform the upgrade. Test failover for the redundant device Obtain a strategic partner to do the upgrade. Perform the upgrade. Test the upgrade. Test the Fail over Open tender for Data Protection of Laptops and Desktops. Evaluate tender Select product that is best suited Implement the product selected Test the product that has been implemented Open tender for implementation of Disk to Tape Solution Evaluate tender Strategy driven, risk intelligent and innovative organisation Revenue driven customer centric organisation Strategy driven, risk intelligent and innovative Revenue driven customer centric organisation Financial sustainability Strategy driven, risk intelligent and innovative organisation 54 Renew all expired licenses to activate support. To keep the environment functioning and to ensure there is support with VMware in case there is problems Upgrade MS Exchange 2013 to MS Exchange 2016 to address the redundancy problem. Add additional Servers for Redundancy and Continuity To eliminates the risk of data loss from desktops and laptops To backup from Disk to Disk and to create a long-lasting backup on tape To have support with VMware. Additional features available with upgrade Redundancy created for the City Power ICT system. Business continuity Protection of Data Recover data in the event of disaster, failure or corruption The disk-to-disk-totape backup enables quick access to data from a disk medium, and June 2018 June 2018 City Power Employees - June 2018 [100%] All Internal Groups - June 2019 [100%] City Power Employees - June 2018 [40%] All Internal Groups - June 2019 [100%]
56 Programmes Programme Activities Strategic Objectives Programme Objective Output Timeline Select the best We have a Tape stores exactly the company to deploy the Solution Implement the Solution Test the Solution library that is not currently in use same data on tape Create Storage Replication to DR Re-engineering Value Chain and Business Processes Re-certify and sustain the integrated ISO Certificates Open tender for implementation of Disk to Tape Solution Evaluate tender Select the best company to deploy the Solution Implement the Solution Test the Solution Improved Process Compliance Increase accountability Improve reliability Simplify regulatory compliance Signed-off Value Chain(s) and Business Processes Conduct internal and external SHERQ audits. Conduct SHERQ training and awareness campaigns. Review legal appointments. Review policies, update legal registers, impact/ Financial sustainability Strategy driven, risk intelligent and innovative organisation Strategy driven, risk intelligent and innovative Revenue driven customer centric organisation Strategy driven, risk intelligent and innovative Financial sustainability 55 To create a DR site with Replicated Storage Units. To replicate all systems to DR Streamline business operations Reduce operational friction Enable continuous improvement Enable performance management Enable optimal usage of resources Optimize productivity To sustain the integrated ISO Certificates. To close the gaps identified in the last ISO audit and prepare different groups for the integrated scheduled audit. To uphold the principles and codes of conducts and best To have backups of all systems and to ensure availability Value-chain-driven and supports the enterprise with informed business intelligence, and seamless business continuity towards an integrated smart grid An ISO Certified Organisation on the new 2015 Standards. An ISO compliant Organisation to the new ISO An Improved and changed organisational culture towards SHERQ perspectives. June 2018 [50%] June 2019 [100%] 2022 Conduct internal and external SHERQ audits [April 2018] Conduct SHERQ training and awareness campaigns [June 2018] Review legal appointments [June 2018]
57 Programmes Programme Activities Strategic Objectives Programme Objective Output Timeline aspect and procedures. Appoint strategic partners to prepare the organisation for practice as outlined in the World Health Organisation (WHO) and relevant institutions. migration from To offer a reliable OHSAS ISO Implementation ISO 2015 version standards in alignment of ERM ISO and quality service to all City Power staff and relevant stakeholder with the prime aim of improving productivity Reduction of employee and contractor incidents Conduct sporadic internal and external audits. Conduct intensified SHERQ training and awareness campaigns. Resuscitate SHERQ forums and committees. Ensure mandatory training is conducted in partnership with HR. Strategy driven, risk intelligent and innovative organisation Re-energised, refocused and ethical organisation 56 To Develop, Implement, Monitor and Review and efficient and effective Integrated SHERQ Management System To identify SHERQ related risks and bring such to tolerable levels Boost employee morale Compliance A Compliant Organisation in line with Legal and other Standards requirements Better environmental management in the organization which will reduce waste and energy use. Improve efficiency to cut costs in running the organization. Meet legal regulations with regards to environmental management. Demonstrate environmental management compliance which can expand business opportunities. Identify hazards in the organization and put controls in place to manage Hazards and Risks Reduction of workplace accidents, reduction in illnesses, and cut related costs and downtime. Hazard Conscious staff and contractors. Review policies, update legal registers, impact/ aspect and procedures [April 2018] Appoint strategic partners to prepare the organisation for migration from OHSAS ISO [July 2018] Implementation ISO 2015 version standards in alignment of ERM ISO [December 2018] June 2019
58 Programmes Programme Activities Strategic Objectives Programme Objective Output Timeline Revive HIRAC Better safe working Committee(Hazard conditions. Identification and Improved quality of Risk Assessments work life and Controls) 57
59 4.5. Metering services Group mandate To ensure sustainability of revenue, gross margin and quality customer experience by: Effective energy trading Reducing non-technical losses (Revenue completeness) Recognising accurate revenue Effective Revenue collections Table 21: Metering services programmes Programmes Addressing shortfall in gross margins for billing Addressing the shortfall in revenue collection Programme Key Activities Clear billing outsorts and implausible Clear invoice outsorts and uninvoiced Audit Large Power Users billed below 300kWh Approval and capturing of outstanding journals Investigate incorrectly billed service charge Investigate reversals above R500 million credit Meter testing and installation verification Segmentation of Large Power Users Improve meter reading performance Strategic Objective Financial Sustainability Financial Sustainability Programme Objective Expected Output Timeline Currently City Power is experiencing a shortfall of R695 million. There is a dual objective to: reduce non-technical losses Increase Revenue City Power revenue collections is currently below target by 5% and overspend of R339 Billing Exception R114 million (30% of R380 M) Outstanding Journals R 70 million Accounts to be further investigated 20% of R56 million (20% of R280 M) Consumption from under-billed LPU customers = R100 million All these are expected to improve revenue by R340 million Increase in cash flow Availability of funding End March 2018 Billing Exceptions R114 million End June 2018 Outstanding Journals R70 million Accounts to be investigated R56 million (estimated of 30% of the Billing exceptions and accounts to be investigated will be realised as revenue 100% of Journals will be realised) Consumption from underbilled LPU customers - R100 million March % Collection R350 Million June
60 Programmes performance and reducing current increase in provision for bad debts from the budget of R258 million to the actual R597 million Improve reconciliation of energy against customer consumption for Unregistered Customers on bulk purchases Address shortfall in gross margin to Improve Prepaid Programme Key Activities Domestic collection will be monitored through the regional collection performance Audit Disconnections Re-introduce key account managers Review of the payment arrangement terms Match LiS data with SAP data Audit stands not registered on SAP Investigate closed electricity installation on SAP Monthly reconciliation of property data Energy balancing and Customer to network link Strategic Objective Revenue driven customer centric organisation To be updated Financial Sustainability Programme Objective Expected Output Timeline million on provision for bad debt from the budgeted R258 million. Improve collection performance from 91% to 96% of billed revenue Determine priority interventions to collect revenue Oversee the execution of interventions to ensure cash collection against set targets Reduce nontechnical losses emanating from customers that are consuming electricity but not registered on SAP Increase revenue by eliminating inability to reconcile energy and customer consumption against bulk purchases Prepaid customers not buying electricity due to meter theft, old meter technology and electricity theft 59 Increase in customer satisfaction Reduction in legal cost Savings will be on the provision to bad debts The interventions are expected to improve collection by R700 million to achieve 96% payment level by end June 2018 Revenue Completeness Reduction of nontechnical losses Improve losses identification and planning Identification of customers that are not billed will improve revenue Energy reconciliation from Eskom to customer These interventions are expected to improve revenue by R80 million by end June 2018 Revenue Completeness Reduction of nontechnical losses 96% Collection R350 Million Provision for bad debts in line with budget End June 2018 Estimated of R80 million will be realised based on the previous completed pilots July 2018 to June 2020 Stand to Stand Audit by CoJ Energy balancing and stand to stand audit End June 2018 Installation of 15,000 prepaid meters
61 Programmes Revenue Collection Improve poor meter reading performance Programme Key Activities Repair faulty and bypassed meters reported System enhancement Integration and migration into City Power of CoJ Device Management functions Conversion of Manual Meters to AMR Meters Data match and updating of meter changes on all systems Fix all AMR & AMI Meters not successfully reading Maintain all Online Meter Status month-tomonth Revise internal processes and streamline all interdepartmental processes between CP and CoJ to cover exceptions: Investigate unused readings Investigate missing billing orders Strategic Objective Revenue driven customer centric organisation Programme Objective Expected Output Timeline Reduce nontechnical losses Increase Revenue Change the culture of non-payment Improve and increase overall meter reading performance from 82.02% to overall 95% Improvement of revenue collection Improve data accuracy These interventions are expected to improve prepaid revenue by R18 million Improve meter reading performance to 95% To improve operational efficiencies Reduction in Customer Queries Unbridge of 15,000 meters Monitor, audit and disconnect meter found bridged from July to date Estimated of R18 million revenue to be recovered 2019/2020/2021/2022 Replacement of old technology meters End March 2018 Overall meter reading performance = 85% End June 2018 Overall meter reading performance 95% 60
62 Programmes Develop ability to independently verify Eskom purchases and determine losses at connection points Achieve optimisation of Bulk Purchases to avoid excess charges incurred on exceeding Notified Maximum Demand (NMD) Programme Key Activities Action deleted readings Resolution of Interface errors Field audit and disconnection on customers whose meter are not read due to access Install check meters Aggressive manual reading of meters Configure the metering systems to provide half hourly consumption values for demand, energy, etc. for all Eskom intake points Energy Balancing Allow Real-time / day after access to the above data To get to the leakages, the analysis must focus on the following elements: Maximum Demand (Winter) Existing NMD levels in relation to load Engage Eskom and Planning departments and follow the process to correct NMDs for each intake point Strategic Objective Revenue driven customer centric organisation Financial Sustainability Programme Objective Expected Output Timeline To address City Power inability to independently verify all Eskom bulk purchases To ascertain the level of losses at connections points with Eskom To ensure that NMD levels are at optimal levels and are reviewed in line with infrastructure plans. To cap wasteful expenditure. Assurance & alignment on Eskom invoices Enhanced energy balancing Revenue recovery Ability to ascertain the level of losses between City Power and Eskom networks Test assumptions to ensure benefits are qualitative Optimised NMD to save R77million per annum Benefits are expected by December 2018 March 2018: All intakes will be audited May 2018: AMR at all Eskom intakes Planning March 2018 Engagements with Eskom April 2018 Acceptance of Eskom Quotes Execution July 2018 Execution of field work October 2018 New NMDs implemented 61
63 4.6. Engineering operations Group mandate The purpose for Engineering Operations is to prevent outages by operating the network safely, effect appropriate planned maintenance and to restore electricity supply to customers where outages occur, quickly and in the most cost-effective manner. Workmanship Improvement Plan Table 22: Engineering operations programmes Programmes Programme Activities Strategic Objective Programme Objective Expected Output Timeline Ensure that all Re-energised, Reduce the number Reduced number of On going jointing teams are refocused and of outages caused outages qualified jointers ethical organisation by poor Increased quality Conduct quality workmanship workmanship inspections All jointers to have Enforce jointing certificates consequences and unique number management on every joint Outage Investigation Plan Planned Maintenance Planned Maintenance Training of operators and controllers on root cause analysis Root cause analysis on all outages Produce flash reports on HV outages Build RCA in Forcelink with drop downs Give input into maintenance plan Formulate maintenance teams Acquire specialised tools Training of staff on switchgear maintenance Re-energised, refocused and ethical organisation Plant reliability 62 Reduce outages through lessons learnt from root causes investigations To Improve network reliability and availability To reduce network down times Plant reliability Planned Maintenance as a focus area Effect planned maintenance on all equipment Optimal operation of equipment Reduced number of repeated outages Prevention of outages Improved plant reliability Well maintained asset base Migration to planned maintenance Safe and reliable network September 2019 June 2019
64 Programmes Programme Activities Strategic Objective Programme Objective Expected Output Timeline Restoration time improvement Improve Quality of Supply Restore plant out of service within stipulated times Improve time taken to dispatch resources & close work orders Ensure adequate resources allocation and optimisation Enforce partial restoration of supply Ensure usage of MDT Influence design philosophy on electrification Ensure all AVR systems are operational Removal of illegal connections Re-energised, refocused and ethical organisation Plant reliability Re-energised, refocused and ethical organisation Plant reliability Safe secured smart grid To meet all NRS 047 restoration times Improve quality of Supply Prevent quality related outages Improved restoration time Reduced losses Increased revenue Improved company image Reduced power quality complaints Reduced insurance claims Improved customer satisfaction and image On going 63
 primary plant depots distributed across the City Power footprint.")
65 Day to day operations: Preventative network maintenance City Power is mandated to operate and maintain the electricity network in a manner that is safe, reliable and cost-effective to maximize continuity of electrical supply. There are ten (10) primary plant depots distributed across the City Power footprint. Each depot takes full accountability for service delivery within the designated geographical area. Figure 9 is the overview of City Power infrastructure within its entire footprint. Figure 9: City Power s footprint Repairs and maintenance City Power spends 6% of its operating expenditure on Repairs & Maintenance, against a National Treasury benchmark of 8%. Although City Power has invested in condition monitoring of its critical assets, the utility faces several challenges including: o Overloading networks particularly in low-cost areas o Theft and vandalism of copper equipment and o High rate of equipment failures City Power has devised response plans, which include: o Building in-house capability as opposed to heavy reliance on contractors o Focus on high risk equipment o Focus on worst performing networks o Substantially increasing the level of planned maintenance, prioritised per asset class (substations, load centres, LV overhead lines) o Laser-like focus on streetlight maintenance 64
66 4.7. Engineering services Group mandate Optimise the long-term stability and sustainability of the electrical distribution networks by the ongoing strengthening and immediate refurbishment to meet current and future demand through the process of research, plan, construct, monitor and evaluate. Execute Refurbishment and Upgrade Projects within Capex Allocation Table 23: Engineering services programmes Programmes Programme Activities Strategic Objectives Programme Objective Expected Output Timeline Plan projects as per Plant Reliability Ensure that Capex 100% of ES needs analysis from Energy execution controllable Capex Engineering Sustainability commence from July projects Operation and Financial 2018 Metering Services Sustainability Approval compliance with PEC and TEC Approval compliance with CIC Compilation of project files Compilation of the Acquisition plan Improve Technology Workgroups to increase participation of departments in the technology-approval value chain. Implement Metering Programme to ensure mass roll out of meters Appointment of committee members Draft terms of reference Quarterly meetings Comments and voting on related documents Replacement of inaccessible, faulty, bridged and conventional meters Approval compliance with CIC Strategy driven, risk intelligent and innovative organisation Financial Sustainability Revenue driven customer centric organisation Centralise approvals for new and existing technologies. Seek solutions to company challenges such as theft and vandalism Strategize on energy mapping To ensure that customers are measured accurately Continuous approval following Technology value chain Reduction of meter reading estimation Reduction of nontechnical losses April % of projects May % of projects June % of projects November % of projects January % of projects April 2018 Appointment letters May 2018 Terms of references June 2018 Workshops 2018/19 Benefits realisation September % of projects December % of projects March % of projects 65
67 Programmes Programme Activities Strategic Objectives Programme Objective Expected Output Timeline Compilation of June % project files of projects Compilation of the Acquisition plan 4.8 Legal Group mandate Our mandate is to provide, manage and coordinate quality legal services to City Power including: Legal counsel and representation; Litigation; Legal risk management; Contract drafting and vetting; Policy development and vetting; and Legal advice 66
68 Table 24: Legal programmes Programmes Programme Activities Strategic Objectives Programme Objective Expected Output Timeline Awareness programmes in metering department Inform and provide advisory services on legal requirements Strategy driven, risk intelligent and innovative organization To keep metering informed on the legal requirements when disconnecting customers; to ensure successful civil litigation and criminal proceedings Reduce legal costs Reduction of urgent applications for reconnections 30 April Relationship management Group mandate The mandate of the Department is to promote, and protect the company s reputation amongst its internal and external stakeholders through the employment of various communications channels and platforms, which assist the company to access specific target audience. 67
69 Table 25: Relationship management programmes Programmes The ambassadors program Customer Satisfaction Survey Programme Activities Event organising Content generation Employee enrolment Customer satisfaction survey Strategic Objectives Reenergised, refocused and ethical organisation Reenergised, refocused and ethical organisation Strategy driven, risk intelligent and innovative organisation Programme Objective Expected Output Timeline To encourage employees to participate in company programs and to be goodwill ambassadors of the organisation To know and understand the levels of satisfaction customers have regarding the services we offer Improved company reputation. Involved employees Increased employee satisfaction Mitigation and resolution of things that customers are not happy about Plan approved - April 2018 Last week of each month complete a campaign to all depots (starting April 2018) Procurement April 2018 Appointment of service provider May 2018 Implementing sustainable community programs in our regions Implement different community related programs Reenergised, refocused and ethical organisation Uplifting Community through sustainable programs and projects (CSI) Sustainable community living standards Ongoing 68
70 Programmes Stakeholder engagements Programme Activities Weekly customer meetings and forums Project support Key customer forum engagements Strategic Objectives Reenergised, refocused and ethical organisation Strategy driven, risk intelligent and innovative organisation Programme Objective Expected Output Timeline To have regular meetings and forums with our customers To understand our customer needs and requirements To position the company in a good place to provide our customers with their needs and aspirations Better understanding our stakeholders Improved relations with stakeholders Stakeholder program advocacy Ongoing ( weekly) 69
71 4.10 Internal audit Group mandate To provide City Power with an efficient and effective assurance and advisory service to City Power for the achievement of company goals and objectives. Embedding the Internal Audit Function in Business Table 26: Internal Audit programmes Programmes Programme Activities Strategic Objective Programme Objective Expected Output Timeline Conducting Financial Awareness of the 30 th June 2018 Inductions into the sustainability internal audit Internal audit function Function to all Divisions Achievement of clean audits for the Divisions and the organisation; Implementation of controls within the business 70


72 5. Financial projections 5.1. Proposed tariff escalation To reduce levels of cross subsidisation in line with the benchmarks set by NERSA and to introduce fixed charges, especially for prepaid customer, yearly tariff escalations are proposed to increase as shown in Table 24. Table 27: Projected proposed tariff escalation figures Financial year Overall tariff escalation rates (%) FY17* FY18 FY19 FY20 Large power users (TOU) Large power users Business conventional Business prepaid Agriculture Residential conventional Residential prepaid Reseller Business Reseller residential Total Average Tariff Increase Note * - Actual NERSA allowed 5.2. Proposed budget overview The City of Johannesburg set budget guidelines for all its entities and departments. The table below outlines the budget guidelines and assumptions that have been utilised by City Power to draft its budget: Table 28: Budget guidelines as set out by the City of Johannesburg 71
73 Focus areas when compiling the budget: The construction / upgrading of substations to alleviate loading problems and the elimination of non-standard voltages; Upgrade of all transmission and/or distribution equipment in order to alleviate the current overloading situations; Upgrade all equipment where safety of personnel is jeopardised; Upgrade / replace all un-maintainable cable networks; Upgrade of protection systems with modern technology equipment; The expansion of the SCADA system to make it possible to monitor / operate substations remotely; Roll out of DSM / Load Management; Upgrade metering to improve revenue collection. Based on the budget guidelines, the income statement below depicts the sources of funding. The respective expenditure items that are budgeted herein, are to be incurred in the current financial year and beyond: 72
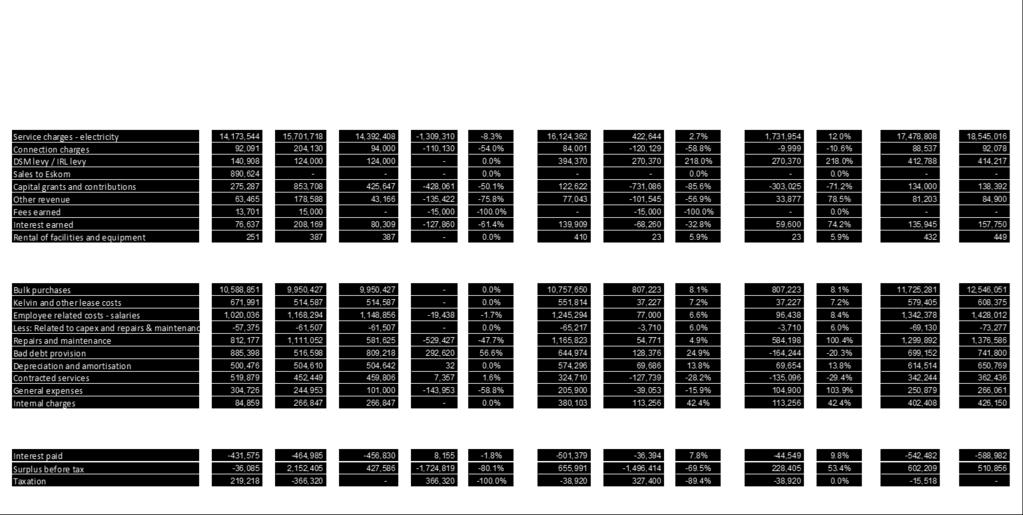
74 73
 on generators and diesel by focusing on CAPEX Compartment 1 Maintaining existing infrastructure (e.g. new mini-subs means no generators required).")
75 1. Absorb the salary cut by moving funds from Contractor services to salaries and by bringing positions in-house (R100 million) 2. Eliminate the need for additional expenditure (R280 million) on generators and diesel by focusing on CAPEX Compartment 1 Maintaining existing infrastructure (e.g. new mini-subs means no generators required) Sources of funding Sources of Funding Proposed Budget 2018/19 Variance based on original budget Variance Variance based on revised budget Variance R 000 % R 000 % Sources of funding Service Charges - electricity 16, 124, , % 1, 731, % Connection Charges 84, , % -9, % DSM levy/ IRL levy 394, , % 270, % Sales to Eskom % - 0.0% Capital grants and contributions 122, , % -303, % Other revenue 77, , % 33, % Fees earned - -15, % - 0.0% Interest earned 139, % 59, % Rental of facilities and equipment % % TOTAL % % Service charges form the bulk in terms of sources of funding (90.125%) Service charges The two tables below indicate the revenue generated from service charges in the current financial year as well as the Budgeted revenue for the financial year 2018/


76 The 2017/18 Revenue budget is revised downwards due to a lower than expected tariff and higher than expected Total Losses. The estimated price increase, which was lower than the expected tariff, Increase of 8.4% whereas the actual price increase approved by NERSA was 1.85%. For the year 2017/18 total losses are expected to be at 21.63%% (a slight increase from 19.84% in 2016/17). The expected revenue model is based on the unit distribution of 8% Prepaid, 36% Domestic, 7% Business and 49% LPU. The above revenue excludes New Connection fees. Units sold have been revised downwards by 8.35%. Revenue for 2018/2019 will increase by 12.03%% which is R1,7 billion, from R 14.4 billion in 2017/2018 to R16,1 billion. Units sold will increase by 3.95% which is 357 GWh The price will increase by R0.1310c/kWh which is 8.24% For the year 2018/19, total losses are expected to be at 19% as part of the 5-year Non- Technical losses reduction plan. 75


77 The table below outlines the projection of service charges: 76


78 5.3.2 Connection charges Estimated number of service connections for 2018/19 financial year is at the estimated cost per connection of R Thus, the Service Connections are estimated at R84 million for the 2018/19 financial year DSM levy / IRL levy Since inception, City Power has been spending most of its capital budget on high voltage network. The company requires more capital to refurbish and replace medium and low voltage network. As a result of that, City Power is proposing an Infrastructure Replacement Levy that will be utilised for network replacement and refurbishment in order to ensure that the company reduces the age of the infrastructure. The table below shows the proposed levy and projection: The total amount budgeted for infrastructure renewal over the next three years is R 802 million Average rate of non-technical losses is targeted to decline from by approximately two percent points from 8% in 2017/18 to 6.29% in 2018/ Capital grants and contributions The Capital Grants and Contributions budget is forecasted to decrease from R 854 million in 2017/18 to R122.6 million in 2018/19 due to the decrease in DOE funding. The chart below outlines the sources of funding for the grants and contribution: 77
79 Department of Energy 26% USDG 74% Figure 10: Capital grants and contributions 2018/ Other revenue The other revenue for City Power comes from Cut off fees, Sundry Revenue, Skills Development Grant, Canteen Revenue, Tender Administration Fees, Gym Fees, External Training, Cash Shortages and Surpluses and Advertising Street poles. The budgeted amount for 2018/19 financial year totals R 77 million and is broken down as follows: R '000 Advertising Streetpoles Cash Shortages and Surplusses External Training 330 Gym Fees 262 Tender Administration Fees Canteen Revenue Skills Development Grant Sundry Revenue Cut off fees Figure 11: Alternative revenue streams for City Power 78
80 Notes: A. Income from cut off fees is estimated at R35 million for the 2018/19 financial year because of the implementation of the credit control measures to ensure that City Power is paid what is due to it by customers B. Sundry Revenue is estimated at R 5million, which is made up of small sundry income categories which yield small income however Insurance claims re-imbursement is in line with the number and the value of claims C. Income from Skills Development grant is estimated at R8,4 million for the 2018/19 financial year D. An expected price increase on food items and other non-perishables with an objective of a break-even when a cost benefit analysis is done. This is estimated to generate income of R4,5 million for the 2018/19 financial year E. Tender Administration fees is estimated at R2,5 million for the 2018/19 financial year because of an increase in the number of tenders to be issued in line with the increased budget F. Income from the gym is expected at R which influenced by membership fees of approximately R per month G. External Training is estimated at R for the 2018/19 financial year H. Cash Shortages and Surpluses is estimated at R16 million for the 2018/19 financial year I. Advertising Street poles revenue is estimated at R5 million for the 2018/19 financial year Expenditure Bulk purchases City Power has made the following assumption in the bulk purchases: Volumes are expected to increase by approximately 0.5% Kelvin s overall increase is at 8.9% The Eskom tariff increase to Municipal Distributors in 1 July 2018 is expected to be 6,96% (& 5,23% to Eskom direct customers in 1 April) The NERSA Guideline for Municipalities is expected at 6.69%% The overall escalation on the proposed bulk purchases budget for FY18/19 is 7,5% from 89c/kWh to 96c/kWh Eskom Ekurhuleni Kelvin OCTGs Proposed budget FY18/19 Table 29: Revised bulk purchases 2017/18 FY Revised bulk purchases Description Revised Proposed 2017/18 FY 2018/19 FY Millions GWh R c/kwh Millions GWh R c/kwh Millions GWh R c/kwh Millions GWh R c/kwh Millions GWh R c/kwh Variance Variance 11.5% 4,0% 7.1% -28.3% 0.0% -28.3% -9.6% -19.5% 12.2% % 0.5% 7.5% 79
81 5.4.2 Kelvin and other lease costs City Power has a lease agreement with Kelvin Power and, in terms of the agreement; the following are the expected costs for 2018/19: JUN MAY-19 APR-19 MAR-19 FEB-19 JAN-19 DEC-18 NOV-18 OCT-18 SEP AUG-18 JUL Figure 12: Lease payments in Rands 80

: 5.4.")
82 5.4.3 Employee related costs salaries An additional R 67.5 million has been provided for to cover the Annual Salary increase of 6.1%, while the creation of new critical positions is estimated at R 5.7 million for the 2018/19 financial year. This brings the total budget for the employees cost to R1 180 million as per the table below (this is after deduction of provisions for employee time spent on capex, repairs and maintenance): Related to capex and repairs & maintenance City Power has made provision to recover employees time spent on Capex, Repairs and Maintenance related work. The table below outlines these recoveries: 81
. 5.4.")

83 5.4.5 Repairs and maintenance The table below outlines the proposed Repairs and Maintenance budget for City Power: For 2017/2018 FY the provision for repairs and maintenance has been revised downwards to 6.89% from 7.53% whereas for 2018/2019 FY the provision is forecast to be 7.69% (R 1.166bn) Bad debt provision The table below outlines the bad debt provision: For FY 2017 /2018, the provision for bad debts has been increased to R.516, 598 to R.608,733 whereas for FY 2018/2019 the provision is forecast to be R Contracted services The contracted services include Fleet Costs, Meter Reading, Commission Paid, Audit Fees, Professional Services, Contracted Cleaning Services and Consultant fees. The breakdown budget for 2018/2019 FY totalling R 325 million is as follows: 82
 2018/19 The following are the notes on the above amounts: A.")
84 Rand '000 Consultant fees Contracted Cleaning Services 863 Professional Services (K1) Audit Fees Commission Paid Meter Reading Fleet Figure 13: Contracted services (R 000) 2018/19 The following are the notes on the above amounts: A. The budgeted costs relating to fleet is estimated at R166 million for the 2018/19 financial year budget and the major contributing factors are fleet lease due to annual rate increases and diesel usage on generators to cater for power outages B. Meter reading costs is estimated at R10,8 million for the 2018/19 budget C. Commission costs is estimated at R50 million for the 2018/19 financial year D. Audit Fees are estimated at R5,7 million for the 2018/19 financial year E. Contract cleaning services are estimated at R0,8 million for the 2018/19 financial year F. Professional fees budget is estimated at R90 million to cater for strategic, tactical and operational services required as part of Strategic Partnership agreement. The table below outlines City Power s contracted services: 83


85 5.4.8 General expenses General expenses are estimated at R206 million for 2018/19 financial year. The table below outlines the breakdown of the general expenses: The percentage split between the various elements of general expenditure above is presented below: 24% 25% 43% Telecommunications Stores and Material Staff Costs Sundry Expenses 8% Figure 14: Percentage split between various elements 84
86 5.4.9 Internal charges fees earned Table 30: Breakdown of internal charges fees earned Source Note Amount (R 000) Rates and services A GIS B 532 Housing C Fleet costs D Insurance general E Legal fees F Communication costs G Grass Cutting H Insurance COID I SAP Software licenses J MFMA training K 87 Engineering Service contribution L Security M Fleet and equipment N Proposed budget FY18/19 380,102 Notes: A. CoJ Revenue Services administration fee charged to City Power for the 2018/19 financial year is estimated at R92,8 million. B. Provision made for the operation of the GIS system is estimated at R0,5 million for the 2018/19 financial year. C. The provision to cater for accommodation rental for City Power employees is estimated at R3 million D. Fleet costs includes an amount of R5,6 million for fleet insurance. E. The estimated insurance premium payable by City Power as per CoJ Risk and Assurance Department schedules amounts to R65 million for 2018/19 financial year, this relates to insurance to cover all the assets City Power owns. F. Legal fees is estimated at an amount of R15,8 million for 2018/19 financial year to cover legal and litigation costs. G. Communication costs is estimated at R23,5 million for 2018/19 financial year. This caters for costs related to public relations, marketing and advertising. H. Insurance COID is estimated at R7,2 million for 2018/19 financial year to provide for Compensation for Occupational Injuries or Diseases sustained by employees in the cause of duty. I. SAP Software Licenses is estimated at R12,4 million for 2018/19 financial year to cover SAP annual licenses. J. MFMA Training is estimated at R for 2018/19 financial year to cover training for senior management. K. Engineering Services is estimated at R1,5 million for 2018/19 financial year L. Security costs is estimated at R96,3 million for 2018/19 financial year M. Fleet and Equipment is estimated at R4,8 million for 2018/19 financial year. The breakdown of internal charges is presented below: 85
87 Rates and Services GIS Housing Fleet Costs Insurance General Legal fees Communication costs Grass Cutting Insurance COID SAP Software licenses MFMA Training Engineering Service contributions Security Fleet and Equipment 1% 25% 25% 1% 0% 3% 0% 2% 1% 2% 13% 17% 6% 4% Figure 15: Internal charges 5.5. Capital expenditure (CAPEX) City Power s capital expenditure can be identified in five separate compartments: CAPEX allocation impact Network and bulk infrastructure projects that are not funded may have a major impact on service delivery. Therefore, there is no doubt that a reduction in this investment will have a significant impact on service delivery and, due to the nature of these projects, natural load growth and network deterioration. The required investment will have to be made sooner or later. It is most likely that this reduction will put pressure on future capital budget allocations. The following are some of the areas which will see the negative impact in the near future: Impact in the reduction of unplanned outages; Impact in the improvement of restoration times; Provision of new service connections will be negatively impacted; There will be an increase in OPEX (R&M) due to emergency repairs; Stock Levels will be impacted negatively (most likely to be high); Township developments will slow down due to capacity constraints; N-1 contingency will be violated, impacting negatively on network reliability; Deferred budgets will place additional burden on future financial year budgets 86

88 The company requires more capex to upgrade, refurbish and replace its infrastructure. The chart below outlines the assumed current sources of capex for City Power, subject to COJ budget office confirmation of final increase of R193 million in 2018/19 budget. The plan has therefore assumed these sources as described: Figure 16: Sources of capex for City Power The usage of Capex to Refurbish, strengthen and upgrade City Power s infrastructure, is a key component to support the deliverables of the City of Johannesburg. The optimization of Capital Expenditure is aligned with the objectives of the company to maintain continuous service delivery to the citizens of Johannesburg which influences strategic alignment. 87
89 The table below outline the amounts per category: Table 31: Capex per category Type 2018/19 Draft Approved by COJ 2019/20 Draft Approved by COJ 2020/21 Draft Approved by COJ 2018/18 TO 20/21 Draft Bulk Infrastructure 557,794, ,387, ,170,000 1,445,351,000 DSM - 14,600,000 33,500,000 48,100,000 Electrification 172,122, ,272, ,677, ,071,000 Fire & Security 5,880,000 10,950,000 13,400,000 30,230,000 Information Technology - 10,950,000 11,538,000 22,488,000 Metering 126,000,000 97,386,000 93,650, ,036,000 Operating Capital 15,000,000 15,000,000 15,000,000 45,000,000 Protection 7,880,000 29,200,000 26,750,000 63,830,000 Public lighting 45,000,000 40,000,000 40,000, ,000,000 SCADA 12,840,000 18,250,000 16,750,000 47,840,000 Service Connections 63,295,000 66,795,000 70,015, ,105,000 Telecommunications 5,880,000 21,900,000 23,450,000 51,230,000 Upgrade of Electrical Network 29,500, ,698, ,002, ,200,000 Total 1,041,191, ,388,000 1,350,902,000 3,293,481, /19 Draft Approved by COJ 2019/20 Draft Approved by COJ 2020/21 Draft Approved by COJ 2018/18 TO 20/21 Draft Investment Portfolio Maintain existing Networks and Service 397,875, ,993, ,205,000 1,464,073,000 Eliminating non tech loss 126,000,000 97,386,000 93,650, ,036,000 Electrify Informal Settlements 172,122, ,272, ,677, ,071,000 Infrastructure Expansion 345,194, ,787, ,670,000 1,034,651,000 ICT & Operating Capital - 10,950,000 6,700,000 17,650,000 Total 1,041,191, ,388,000 1,350,902,000 3,293,481,000 88
90 5.6. Planned capex projects City Power has several planned capex projects that are critical to its operations. Two of these projects, electrification and public lighting, are very important to the shareholder in ensuring that the shareholder is able to deliver value and services to its constituency in the City of Johannesburg. The other capex projects are outlined in the diagram below. Capex Projects Budgets Core-sub projects and project status Electrical Infrastructure (Bulk): The aim of this project is to expand, refurbish and develop downstream electrical infrastructure networks R557,8m Cleveland SS, Waterval, Pennyville, Heriotdale SS, Sebenza, Mondeor, Pennyville, Elderado Park, Nancefield and transformer refurbishments Electrical Infrastructure: The aim of this project is for the installation of meters, meter system enhancement, meter protective structures, prepaid metering, replacing of faulty pole transformers and replacement of aged cables R136m Metering Load management Emergency work Electrification: The aim of this project is ensure that homes in four Johannesburg informal settlements are electrified. There has been challenges with implementing work on site due to community issues R172,1m Princess, Alexandra normalisation, Soweto Sub Station, Rugby Club and Rabie Ridge Public Lighting: The aim of this project is to provide public lighting systems in areas that are currently without public lighting R45m Fine Town, Braamfischer Ville, Hurlingham, Meadowlends Ext 9, Midrand Industrial Park, Protea Glen, Rivonia and Morningside Power Systems: The aim of this project is to refurbish and update substation components (protection relays in substations and fibre cables between substations) R17,6m Replacement of aged protection relays Installation of Fibre cables between sub stations Replacement of aged DC equipment (battery chargers and batteries) Other Capex & Asset Purchases: The aim of this project is to expand, refurbish and develop downstream R49,84m Tools and loose gear 89
91 electrical networks infrastructure Furniture Computers Telecommunications NOTE :Total 2018/19 Capex Budget is R1041million. R63m (non-controllable CAPEX) is for Service connection 6. People Human capital is a dynamic, shifting asset as the organisation, its managers and individuals make choices daily that help create or potentially destroy value. The sum of knowledge, skills, experience and other relevant work attributes that reside in our workforce drives productivity, performance and achievement of goals. In the changing world of work, the one constant is the need for an exceptional workforce. This is regardless of size, revenue, industry or economic environment. Undoubtedly, our most valuable asset continues to be our workforce. How we manage this asset spells the difference between success and failure. Increasingly the demands and composition of the workforce have shifted in response to the recent strategic shift. The need for more specific skills to respond to strategic imperatives, has created a growing talent mismatch and scarcity of leadership talent. City Power also experiences multiple generations in terms of age and an undefined culture in the workplace which has resulted in changes in motivations and preferences, profoundly impacting individual choice. The world has moved with technological developments that allow new ways of getting work done. In particular for our industry migrating to a smart grid that allows our workforce to work smarter. We find ourselves in an era where it is extremely challenging to manage our workforce effectively. Despite their varied implications, the trends above revolve around one central theme: the need to empower the right people, in the right places, in the right ways. This requires sustained commitment to and a strategic investment in talent. Our talent needs to be managed as aggressively as the finetuning we apply to other organisational assets. Everything else fails if we do not have the right talent in place. We may not have control over some external trends, and the reality is we are faced with enormous internal challenges, but regardless of all that, we can proactively shape our people strategies in order to respond to those trends, positioning City Power to gear up for renewal and growth. In order to enable this, this section of the document articulates our operational approach in aligning the people strategy with business goals. For us, talent is the number one impediment or success factor to executing a business plan. Our people strategy: Articulates a comprehensive vision of where the company wants to go, what unique value it delivers, and what effects it wants to have. This intention is articulated in the 2022 VUCA vision; Organise work structures and our people to unleash the knowledge, innovation and creativity of every employee in order to achieve that vision. This is anchored by the LIGHTS ON! Programme; Examine, understand and deliver what our employees want from their employer and work environment. This is to be defined in the City Power Way. The above is being done in order to deliver a re-energised, refocused and ethical organisation that keeps the LIGHTS ON! The operational plan charts the path of building an exceptional workforce 90


92 where our people are competent, committed, and enthusiastic and provide advocacy for our organisation. The situational analysis indicates that City Power requires a fundamental cultural change that will drive the 2022 VUCA vision. In order to succeed in its strategic mandates, City Power needs to develop the ability to improve the design and implementation of initiatives and to reduce cycle time in all organisational activities. HR and Transformation is mandated to lead the organisational renewal efforts of re-energising and re-focussing our people as well as positioning our organisation as an ethical entity. Therefore, HR and Transformation must serve the organisation both as a cultural catalyst and cultural guardian. Further to that, the strategic intent of HR and Transformation includes ensuring that the business performs in a stable nurturing environment that is conducive to the achievement of its objectives, whilst building an exceptional workforce of competent and committed people who provide leadership and advocacy for our organisation. The HR and Transformation Group mandate is expressed through the model depicted below outlining four strategic pillars: Figure 17: Four strategic pillars outlining the HR and Transformation Group mandate 91
93 Table 32: Group objectives and key activities Group Objectives Capacity: To ensure appropriate staffing and optimal use of the workforce in a manner in which business operations are aligned with the strategic objectives of the leadership. Capability: To define, assess and build individual and collective contribution to the delivery of the business strategy through Performance Management and Skills Development of our people. Commitment: To implement measures of employee care and advocacy as a catalyst for employee willingness to give time and energy that drives organisational success. Compliance: To drive adherence to transformation imperatives, employment regulations and organisational directives. Key activities Translate business strategy into organisational capabilities Conduct Organisation Design that delivers a pictorial view of operating model, business units, functions, and roles depicted in an organisation structure Determine the talent needed to deliver on organisational capabilities Conduct a talent gap analysis for current and future states Identify actions and investments for gap management Conduct Competency Modelling Strengthen Individual Performance Management Process Conduct Talent Assessments and Invest TREADs in Driving Capability Developing Leadership Competencies through 360-degree Feedback and Coaching Implement Work Skills Plan aligned to the Energy and Water SETA Define the City Power Way in the form of a Culture Charter Determine the drivers for Employee Engagement Develop a model for employee wellbeing that incorporates the Physical, Psychological and Social elements Implement the I am IN program with interventions to strengthen employee engagement, employee wellbeing and ethical conduct Implement Ongoing Communication and Regularly Conduct Pulse Checks Determine the HR Regulatory Compliance Framework Review policies and procedures to align to the HR Regulatory Compliance Framework and B-BBEE codes Engage Organised Labour on matters of negotiation, consultation and information sharing Roll out communications to the organisation on HR policies and procedures Ensure data integrity for employee records and HR records 92
94 Table 33: Human Resources Performance overview Company Objectives Group Objectives Key Performance Areas Key Performance Indicator Baseline Dec 2017 Target June 2018 Target June 2019 Re-energised, refocused and ethical organisation To ensure appropriate staffing and optimal use of the workforce in a manner in which business operations are aligned with the strategic objectives of the leadership Talent Planning % Job Vacancy Rate (The ratio of vacant positions against the approved staffing establishment) 52,17% 12% 10,8% To define, assess and build individual and collective contribution to the delivery of the business strategy through Performance Management and Skills Development of our people Leadership Development Leadership Development Plan % Achievement (Milestone achievement per Board approved plan) New 100% 100% Talent Development Learning Expenditure as a % of Payroll (Training and Development expenses in relation to the overall payroll costs) New 1% 1% To implement measures of employee care and advocacy as a catalyst for employee willingness to give time and energy that drives organisational success Productivity % Lost time rate (All unplanned leave as a percentage of the number of planned and scheduled man hours for the month) New 2.2% 2% Employee Wellness % Employee Medical Surveillance (Number of employees attending entry, exit and periodic medical surveillance as a percentage of the total number of employees nominated to attend) n/a 100% 100% Employment Equity Employee Profile Overall view of the diversity of the workforce profile 91.79% (AA) 85% (AA) 85% (AA) 93
95 Company Objectives Group Objectives Key Performance Areas Key Performance Indicator Baseline Dec 2017 Target June 2018 Target June % (Gender) 27% (Gender) 28% (Gender) To drive adherence to transformation imperatives, employment regulations and organisational directives 2.21% (PWD) 2% (PWD) 2% (PWD) Disciplinary Procedures Average number of days taken to resolve disciplinary cases n/a 90 days 90 days 94

96 7. Stakeholder management Stakeholder management for City Power is aimed at: Creating awareness of City Power activities, services, projects and programmes Forging and strengthening positive relations with all internal and external stakeholders Encouraging public participation and engaged active citizenry Ensuring effective communication to all stakeholders by providing relevant and credible information Promoting and enhancing the City Power brand Figure 18: Key Stakeholders 7.1. Engagement with political stakeholders Engage with councillors to determine the method of communication and interaction with customers in their area. Enable and empower councillors to engage with communities on the challenges, benefits, workings and implementation plans of City Power Equip the City Power technical teams to successfully interact with residents aided by the area councillor s support. Enable smart communication (two way) between City Power, the councillors and their constituents. 95


97 7.2. Approach Figure 19: Engagement with political stakeholders approach 7.3. Engagement strategy City Power will engage with the councilors in all regions as well as the dedicated councilors for City Power projects: Figure 20: Engagement with dedicated councillors for City Power projects 96


98 7.4. Integrated communications strategic approach City Power is embarking on a journey to change the way in which the organisation communicates and integrates its communications efforts to achieve optimum results. Whilst City Power has made great strides in positioning its leadership, in order to effectively communicate on projects and other initiatives, there needs to be one voice to integrate marketing communications efforts. There needs to be a focused approach in communicating City Power and the broader City of Johannesburg s overall vision and mandate, business, strategic and political aspirations for communication to yield the desired results. City Power has developed an Integrated Marketing Communications Strategy that integrates public relations, marketing and advertising, internal communications, stakeholder engagements and corporate social investment efforts: Figure 21: Integrated marketing framework Figure 22: Integrated marketing approach 97


99 7.5. Internal communications approach In order to drive a high-performance culture, the engagement of internal employees must be prioritised for City Power to achieve its strategic business objectives. Figure 23: Internal communication 7.6. External communications approach External relations will focus on the following: Proactive media engagement The media engagement programme is aimed at building relationships with key media influencers to position City Power, its vision and positioning and ensure an understanding of these in the media to ensure their effective reporting on it. Brand championship Use champions e.g. happy customers, third party endorsements to spread the good word about City Power and its initiatives Story telling Leverage different initiatives for story telling opportunities such as sharing good news stories Tell success stories of City Power s achievements as a long term strategy Stories will be packaged in various forms audio and video. Social Media Use social media platforms relevant to the business including Twitter, Facebook and Instagram as a platform to engage with customers and other stakeholders Speaking engagements Identify relevant industry conferences or workshops where spokespeople can give presentations as keynote speakers / speakers at events in order to establish City Power and City of Joburg s leadership and spokespeople with key stakeholders; and show visibility and involvement of City Power at relevant industry events (key for stakeholder engagement) Targeted leadership profiling Identify relevant media profiling opportunities for identified spokespeople Thought leader positioning Make industry contributions on relevant topics, develop content that speaks to industry changes, innovations, topical issues, and research and by-line articles for targeted media distribution 98

100 7.7. Corporate Social Investment (CSI) approach Corporate social investments will be focused on enabling the business to succeed while empowering communities, because the success of society and our communities is linked with the future success and performance of the business. The approach will be focused on yielding long-term positive results for clients and building sustainable relationship with the communities in which they operate. Key considerations will be made in aligning solutions with the organisation s business objectives, values and vision of becoming a world class electricity distributor. Employee s participation will form a key part of the CSI programme and will be used to boost morale internally by involving them to participate in identifying worthy causes in communities CSI considerations Figure 24: CSI consideration 99
101 8. Risk management 8.1. Enterprise risk management Background to enterprise risk management The City Power Board is ultimately accountable to ensure that management has designed and implemented an effective system of enterprise risk management and that risks are managed within the approved risk appetite and tolerance levels. Moreover, in terms of section 95 (c )(i) of the MFMA, the accounting officer of a municipal entity is responsible for managing the financial administration of the entity, and must for this purpose take all reasonable steps to ensure that the entity has and maintains effective, efficient and transparent systems of financial and risk management and internal controls. City Power adopted a structured approach to risk management, using consistent approaches to the assessment, treatment, monitoring and reporting of all types of risk, at different levels for activities across the business. A risk is significant if the potential consequences could have a material impact on the achievement of a City power s business plan objectives aligned to those of the City of Johannesburg. Risk treatment plans were developed and implemented to ensure that strategic, business and operational (organisational) objectives and budgets are met. Each of the strategic risks is allocated to an EXCO risk owner to ensure accountability. Monitoring and review is done at EXCO with Board RAC exercising oversight as mandated by Board. Risk reviews are held on an ongoing basis with different with different Group Executives and their teams to identify any new or emerging risks that may affect the achievement of business objectives Risk management process Philosophy and governance The overall risk management philosophy of City Power is to identify and predict potential and emerging risks before they occur or materialise and implement a risk management system and methodology that is applicable to all City Power operations. To further embed sound risk management principles, City Power adopted a Combined Assurance approach to assurance during this financial year to further strengthen the assurance to our control environment. This is an ongoing project to ensure that risks and controls identified are managed across the three lines of defence, and that appropriate assurance is provided, reported and monitored this is effected through a developed Combined assurance governance forum. 100
 that is cascaded into tactical risk management steps: Figure 26: CP ERM process: Risk management framework (2017/2018)")
102 City Power s risk governance structure Figure 25: Risk governance structure (CP Risk Management Framework) The below figure 4 depicts the strategic progress cycle which is underpinned by the Risk Framework (ISO 31000) that is cascaded into tactical risk management steps: Figure 26: CP ERM process: Risk management framework (2017/2018) 101

103 8.3. Risk maturity This figure below illustrates the risk maturity curve and shows City power s current state based on different maturity stages as defined by the attributes associated with each stage. The improvement areas have been factored into the City Power Risk Management plan which Board RACC has approved and is currently implemented to support the Corporate Plan. Figure 27: Risk maturity stages Gaps which were identified to improve risk management have helped to define priorities in the risk management plan. This will drive risk maturity and enable City Power to become a risk intelligent organisation. Since risk disclosure is an integral part of assurance City Power will on a quarterly basis continue reporting and appraising all key structures on risk performance across The Risk management plan A detailed City Power Enterprise Risk Management plan has been developed and approved by Board Risk Assurance and Compliance Committee. The context of the plan is framed by the following drivers: Direction provided by a board approved Enterprise Risk Management Framework Support to City Power s strategic and operational objectives Priorities from the City of Johannesburg as per the Group Risk Governance and Compliance plan Compliance reviews by Group Internal Audit The need to redefine, set and approve risk appetite and tolerance levels The need to improve risk maturity and get the organization to become risk intelligent by
EMBEDDED GENERATION: THE CITY POWER EXPERIENCE
 EMBEDDED GENERATION: THE CITY POWER EXPERIENCE 19 April 2016 Contents 1 City Power at a glance 2 Evolution of distributed generation 3 City power approach 4 How to engage? CITY POWER AT A GLANCE City Power
Utility sector overview & their challenges. Dependency on Energy sector. What needs to addressed in 2018 & beyond
 PRESENTATION OUTLINE Utility sector overview & their challenges Dependency on Energy sector What needs to addressed in 2018 & beyond Business Case: - How utilities can maximize revenue protection by adopting
Strategic Direction for Eskom s Retail Tariffs 2011 onwards
 Strategic Direction for Eskom s Retail Tariffs 2011 onwards Author & Presenter: Deon Conradie B Eng (Hons) University of Pretoria, MBL Unisa Senior Manager (Electricity Pricing), Eskom Co-author: S Salvoldi
Title of presentation
 Title of presentation Dr Willie de Beer Chief Operations Officer EDI Holdings Are the REDs Dead? Presentation Outline Current Electricity Supply Industry Structure Current Situation Supply / Demand : In
ELECTRICITY DISTRIBUTION INDUSTRY RESTRUCTURING
 ELECTRICITY DISTRIBUTION INDUSTRY RESTRUCTURING 1. BACKGROUND On the 25 th of October 2006 Cabinet, having considered the results of the modelling exercise, approved the proposal to create six wall-to-wall
Integrated Development Plan 2018/19 Feedback and Listening Session November Region C
 Integrated Development Plan 2018/19 Feedback and Listening Session November 2017 Region C Outline the City s strategies, outcomes and priorities towards development Purpose Give feedback on issues raised
Disperses Taxes. NATIONAL TREASURY National Revenue Fund
 SOCIAL CONTRACT Social Obligation & Social Benefit MUTUAL RELATIONSHIP Citizens Pays Taxes SARS Collects Taxes Engages Private Sector to Create Public Benefits from Tax Revenue Disperses Taxes NATIONAL
DISCUSSION PAPER ON THE DECOMMODIFICATION OF ELECTRICITY
 YCLSA 5 TH NATIONAL CONGRESS DISCUSSION PAPER ON THE DECOMMODIFICATION OF ELECTRICITY Contextual Background In South Africa, the government utility Eskom has a control on the generation and transmission
A robust and systematic review.
 Principal risks and uncertainties A robust and systematic review. The Board considers these to be the most significant risks faced by the Group that may impact the achievement of our six strategic drivers.
City Power Johannesburg (SOC) Ltd Updated Business Plan
 Ltd Updated Business Plan") City Power Business Plan 2014 2016 Draft 5.3 City Power Johannesburg (SOC) Ltd Updated Business Plan 2015 2017 Final Draft 5.3 Page 1 Sign Off: CEO/MD Name: Signature: Date: Sector ED Name:.... Signature:
City Power Business Plan 2014 2016 Draft 5.3 City Power Johannesburg (SOC) Ltd Updated Business Plan 2015 2017 Final Draft 5.3 Page 1 Sign Off: CEO/MD Name: Signature: Date: Sector ED Name:.... Signature:
Maximising the potential of Energy Efficiency and Demand Side Management in South Africa
 Maximising the potential of Energy Efficiency and Demand Side Management in South Africa By Vashna Singh, Eskom, Demand Side Management 27 October, 2008 Presentation Objectives No. Item 1 Global context
Business Plan
 Business Plan 2017-2018 rev. May 2017 MESSAGE FROM THE CEO As the Chief Executive Officer of PEC, I am pleased to present the 2017 2018 Business Plan, a tool that will enable the Cooperative to make informed
Revenue Enhancement Project Naledi Local Municipality. August 2016
 Revenue Enhancement Project Naledi Local Municipality August 2016 Revenue Enhancement Project - Naledi (Vryburg/ Stella in the Northwest Province) Two separate projects Vryburg Grant funded Stella RMS
Distribution Code Definitions
 Distribution Code Definitions Version 5 Approved September 2007 Comments to this document can be forwarded to: RSA Grid Code Secretariat Attention: Mr. Bernard Magoro Eskom, Transmission System Operator
South African National Energy Development Institute (SANEDI) Thembakazi Mali
 Thembakazi Mali") South African National Energy Development Institute (SANEDI) Thembakazi Mali www.sanedi.org.za SANEDI as an Agency of DoE with close ties to the Department of Science and Technology (DST), by virtue of
South African National Energy Development Institute (SANEDI) Thembakazi Mali www.sanedi.org.za SANEDI as an Agency of DoE with close ties to the Department of Science and Technology (DST), by virtue of
Eskom s energy flow diagram
 List of fact sheets Eskom s energy flow diagram Full list of stakeholder issues mapped to who raised them King III checklist noting exceptions or partial application Declaration in terms of Section 32
Advance Metering Infrastructure (AMI) in South Africa Eskom s Challenges and Lesson s Learnt
 in South Africa Eskom s Challenges and Lesson s Learnt") Advance Metering Infrastructure (AMI) in South Africa Eskom s Challenges and Lesson s Learnt By: Kennedy Subramoney 9 May 2012 7th ANNUAL METERING BILLING / CRM ASIA 2012 Bangkok (Thailand) Presentation
Advance Metering Infrastructure (AMI) in South Africa Eskom s Challenges and Lesson s Learnt By: Kennedy Subramoney 9 May 2012 7th ANNUAL METERING BILLING / CRM ASIA 2012 Bangkok (Thailand) Presentation
Tangible Benefits of Implementing Smart Metering Technology in City Power
 Tangible Benefits of Implementing Smart Metering Technology in City Power Mr Aubrey Mochela GM ICT City Power JOHANNESBURG South Africa Agenda Items 1 2 Energy Theft Broader Context City Power Situation
LEARNING NOTES METRO ENGAGEMENT ON ELECTRICITY AND ENERGY 28 AUGUST 2017 SALGA HOUSE, CAPE TOWN
 LEARNING NOTES METRO ENGAGEMENT ON ELECTRICITY AND ENERGY 28 AUGUST 2017 SALGA HOUSE, CAPE TOWN INTRODUCTION AND BACKGROUND The electricity distribution and generation sector is exposed to rapid change
Level 5 NVQ Diploma in Management and Leadership Complete
 Learner Achievement Portfolio Level 5 NVQ Diploma in Management and Leadership Complete Qualification Accreditation Number: 601/3550/5 Version AIQ004461 Active IQ wishes to emphasise that whilst every
Performance against Shareholder Compact 2014/2015
 54 UMGENI WATER AMANZI ANNUAL 1.0 PG 04-05 2.0 ORGANISATIONAL PG 06-15 3.0 CHAIRPERSON S PG 16-23 4.0 CHIEF EXECUTIVE S PG 24-31 5.0 CORPORATE GOVERNANCE PG 32-47 6.0 STAKEHOLDER UNDERSTANDING AND SUPPORT
Position Title: Finance Director
 Position Title: Finance Director SASRIA SOC LIMITED Sasria, a state-owned company, is the only short-term insurer in South Africa that provides affordable voluntary cover against special risks such as
STRATEGY, MATERIAL RISKS AND OPPORTUNITIES
 STRATEGY, MATERIAL RISKS AND OPPORTUNITIES Cashbuild has identified a number of strategic business imperatives based on identified risks and opportunities, aimed at maximising the profitability and sustainability
George Ferreira Ex-ED, Electricity and Energy Nelson Mandela Bay Municipality Port Elizabeth, South Africa
 George Ferreira Ex-ED, Electricity and Energy Nelson Mandela Bay Municipality Port Elizabeth, South Africa Overview The history of the NMBM - Pilot projects outcome - NMBM Financial trends What is a smart
Case Study EKURHULENI METROPOLITAN MUNICIPALITY PROJECT: MUNICIPALITY-DRIVEN ENERGY EFFICIENCY AND REFURBISHMENT
 Case Study EKURHULENI METROPOLITAN MUNICIPALITY PROJECT: MUNICIPALITY-DRIVEN ENERGY EFFICIENCY AND REFURBISHMENT Overview: The Ekurhuleni Metropolitan Municipality has a stepped tariff system. NERSA allowed
TasNetworks Transformation Roadmap 2025
 DRAFT TasNetworks Transformation Roadmap 2025 JUNE 2017 Trusted by our customers to deliver today and create a better tomorrow 2 TasNetworks Transformation Roadmap 2025 June 2017 Purpose We deliver electricity
GUIDELINES ON ELECTRICITY RESALE
 GUIDELINES ON ELECTRICITY RESALE Issued by The National Energy Regulator 526 Madiba Street Arcadia, Pretoria 0007 Contact Details: Tel: +27 (0)12 401 4600 Fax: +27 (0)12 401 4700 www.nersa.org.za Contents
Improving Resiliency OPERATIONAL OPTIMISATION
 11.0 Improving Resiliency 11.1 OPERATIONAL OPTIMISATION ISO 17025 Accredited Laboratory Services Assuring Water Quality Umgeni Water s Laboratory Services is a dynamic centre of excellence comprising four
Pricing and the tariff
 Pricing and the tariff A message from the chairman There are two major long-term causes of Eskom s financial woes. Firstly, South Africa has priced electricity below its full cost for many decades. Whereas
CIPS Pan African Conference
 CIPS Pan African Conference Procurement and Executive level alignment how procurement is becoming a strategic advisor to internal stakeholders The Eskom journey & experience May 2013 The strategic role
REQUEST FOR PROPOSALS - CITY OF TSHWANE SUSTAINABLE PUBLIC PROCUREMENT STRATEGY
 REQUEST FOR PROPOSALS - CITY OF TSHWANE SUSTAINABLE PUBLIC PROCUREMENT STRATEGY 1. ABOUT THE SACN The South African Cities Network (SACN) established in 2002, is a network of the largest municipalities
Position Title: Executive Manager: People Management
 Position Title: Executive Manager: People Management SASRIA SOC LIMITED Sasria, a state-owned company, is the only short-term insurer in South Africa that provides affordable voluntary cover against special
INTERNAL AUDIT PLAN AND CHARTER 2018/19
 INTERNAL AUDIT PLAN AND CHARTER 208/9 PURPOSE OF REPORT. To present the proposed 208/9 audit plan and charter to the Audit Committee for consideration and approval..2 The Internal Audit Plan for 208/9
Counties Power Limited
 Counties Power Limited Electricity Distribution Business Pricing Methodology Disclosure 1 April 2018 to 31 March 2019 Pursuant to Electricity Information Disclosure Information for compliance with Part
Independent Power Producer procurement Improving integration with municipal distributors
 25 th AMEU Technical Convention 4-7 October 2015 Independent Power Producer procurement Improving integration with municipal distributors Dr Clinton Carter-Brown IPP Office A partnership between: Department
1 July Guideline for Municipal Competency Levels: Head of Supply Chain and Supply Chain Senior Managers
 1 July 2007 Guideline for Municipal Competency Levels: Head of Supply Chain and Supply Chain Senior Managers Municipal Regulations on Minimum Competency Levels issued in terms of the Local Government:
EUR 2,5 billion. 360 MW financed. of commitments. since 2003
 AFD and South Africa LESOTHO Durban Cyril le Tourneur d Ison 43 projects EUR 2,5 billion 360 MW financed of commitments of renewable energy in 15 years since 2003 financed since 2003 Present in South Africa
Residential Heat Pump Rebate Programme
 Residential Heat Pump Rebate Programme Information session 18 February 2011 Agenda Item Residential heat pump rebate programme Opening Technology and welcome Who Andrew Etzinger Conditions of participation
STATEMENT ON RISK MANAGEMENT AND INTERNAL CONTROL
 Governance Digi.Com Berhad Annual Report 2017 73 STATEMENT ON RISK MANAGEMENT AND INTERNAL CONTROL IN ACCORDANCE WITH PARAGRAPH 15.26 (b) OF THE MAIN MARKET LISTING REQUIREMENTS OF BURSA MALAYSIA SECURITIES
Overview of HR Matters at the Post Office
 Overview of HR Matters at the Post Office During the year under review, the main focus at the Human Capital Management unit was on fostering capabilities that will enable the organisation to deliver on
RISK MANAGEMENT. Risk. response
 OUR MATERIAL RISKS RISK MANAGEMENT Enterprise Management and Compliance is a formal response to address corporate risk that may hamper the achievement of Cashbuild s strategic objectives. It is a structured
Universal Service and Access Agency of South Africa ANNUAL PERFORMANCE PLAN 2012/13
 Universal Service and Access Agency of South Africa ANNUAL PERFORMANCE PLAN 2012/13 1 Table of Contents PART A 3 1.1 Situational Analysis 4 1.2 Revisions to Legislative and Other Mandates 5 1.3 Overview
IRM s Professional Standards in Risk Management PART 1 Consultation: Functional Standards
 IRM s Professional Standards in Risk PART 1 Consultation: Functional Standards Setting standards Building capability Championing learning and development Raising the risk profession s profile Supporting
ELECTRICITY DISTRIBUTION INDUSTRY (EDI) RESTRUCTURING : 11August 2005
 RESTRUCTURING : 11August 2005") ELECTRICITY DISTRIBUTION INDUSTRY (EDI) RESTRUCTURING - 1 - : 11August 2005 PURPOSE 1. To update Council on the latest information in respect of the Electricity Distribution Industry Restructuring; 2.
ELECTRICITY DISTRIBUTION INDUSTRY (EDI) RESTRUCTURING - 1 - : 11August 2005 PURPOSE 1. To update Council on the latest information in respect of the Electricity Distribution Industry Restructuring; 2.
Presentation to Stakeholders
 Presentation to Stakeholders 7 th November 2017 Provide bulk water and sanitation services to improve quality of life and enhance sustainable economic development Chief Executive s Report Once again, excellent
Ms. Dorothy Mabuza Divisional head: Water Quality and Revenue Management Ekurhuleni Metropolitan Municipality South Africa
 Ms. Dorothy Mabuza Divisional head: Water Quality and Revenue Management Ekurhuleni Metropolitan Municipality South Africa THE EVOLUTION OF WATER METERING TECHNOLOGY AND THE SELECTION PROCESS Contents
GOVERNMENT PRINTING WORKS
 GOVERNMENT PRINTING WORKS PRESENTATION TO THE PORTFOLIO COMMITTEE OF HOME AFFAIRS 1. STRATEGIC PLAN 2015 2020 2. ANNUAL PERFORMANCE PLAN AND BUDGET FOR 2015/16 24 March 2015 THE STRATEGIC PLAN OF GPW AND
BRIEFING BY ENTITIES ON 2015/16 STRATEGIC AND ANNUAL PERFORMANCE PLANS 2015/16 PORTFOLIO COMMITTEE ON TRANSPORT 2ND TERM PROGRAMME
 BRIEFING BY ENTITIES ON 2015/16 STRATEGIC AND ANNUAL PERFORMANCE PLANS 2015/16 PORTFOLIO COMMITTEE ON TRANSPORT 2ND TERM PROGRAMME 14 April 2015 TABLE OF CONTENT ATNS MANDATE ATNS STRATEGY ANNUAL PERFORMANCE
Deon Louw Deputy Director: Electro Technical Services Overstrand Municipality South Africa
 Deon Louw Deputy Director: Electro Technical Services Overstrand Municipality South Africa MAINTENANCE AS A UTILITY IMPERATIVE ELECTRICITY DISTRIBUTION INDUSTRY (EDI) SOUTH AFRICA Presentation Content
Business Case and Proposal
 Business Case and Proposal Formation of an Internal Audit Service for Cambridge City Council, Huntingdonshire District Council and South Cambridgeshire District Council 1.0 Executive Summary 1.1 Cambridge
Service Business Plan
 Service Business Plan Service Name Information Technology Service Type Internal Service Owner Name Christine Swenor Budget Year 2017 Service Owner Title Service Description Director of IT Services An internal
USAASA & USAF 2018/19 Annual Performance Plans Presentation to Portfolio Committee on Telecommunications and Postal Services
 USAASA & USAF 2018/19 Annual Performance Plans Presentation to Portfolio Committee on Telecommunications and Postal Services Universal Access and Service to ICT for All 24 April 2018 Table of Contents
State Information Technology Agency. 2008/9 Annual Report Presentation to Portfolio Committee of Police
 State Information Technology Agency 2008/9 Annual Report Presentation to Portfolio Committee of Police Agenda Strategic Objectives : Achievements Key Integrated Service Provision Programs Human Capital
ANNEXURE 4 DRAFT REVISED CONSUMPTIVE TARIFFS, RATES AND BASIC CHARGES FOR ELECTRICITY SERVICES, WATER SERVICES AND WASTE MANAGEMENT SERVICES
 ANNEXURE 4 DRAFT REVISED CONSUMPTIVE TARIFFS, RATES AND BASIC CHARGES FOR ELECTRICITY SERVICES, WATER SERVICES AND WASTE MANAGEMENT SERVICES 2018/19 Budget (March 2018) REVISED CONSUMPTIVE TARIFFS, RATES
ANNUAL PERFORMANCE PLAN
 CELEBRATING 130 YEARS est. 1888 Government Printing Works ANNUAL PERFORMANCE PLAN 2018/2019 State Mandated Security Printer Government Printing Works ANNUAL PERFORMANCE PLAN 2018/2019 GPW ANNUAL PERFORMANCE
CGMA Competency Framework
 CGMA Competency Framework Technical skills CGMA Competency Framework 1 Technical skills : This requires a basic understanding of the business structures, operations and financial performance, and includes
business, government and civil society. It is also providing energy at rapidly decreasing cost to the consumer.
 Speech by the Minister of Energy, Hon Jeff Radebe, MP at the Renewable Energy Independent Power Producer Programme (REIPPPP) Bid Windows 3.5 and 4 Contractual Close signing ceremony 4 April 2018 I would
Raj kumar Rastogi TATA Power Delhi Distribution Limited CII Meet 02-Nov 2012
 Raj kumar Rastogi TATA Power Delhi Distribution Limited CII Meet 02-Nov 2012 Contents: Overview Smart Grid Drivers Associated Challenges, Risks and Barriers Smart Grid Initial & Future Phase 11/6/2012
TOPIC Aubrey Mochela GM:ICT and Project Manager Load Limiting City Power (CoJ MoE) South Africa
 South Africa") TOPIC Aubrey Mochela GM:ICT and Project Manager Load Limiting City Power (CoJ MoE) South Africa Place your company logo here NB: Your company s logo is only permitted on the first slide! Smart Meter Key
TOPIC Aubrey Mochela GM:ICT and Project Manager Load Limiting City Power (CoJ MoE) South Africa Place your company logo here NB: Your company s logo is only permitted on the first slide! Smart Meter Key
Copyright 2017, Ontario Energy Association
 ENERGY PLATFORM Copyright 2017, Ontario Energy Association KEY OBJECTIVES The purpose of this document is to provide elected officials and key decision makers from the three main political parties with
The Electricity System Operator Who we are and what we do September 2018 CONFICONFIDNEITA
 The Electricity System Operator Who we are and what we do September 2018 CONFICONFIDNEITA Who we are As the Electricity System Operator (ESO), we operate the National Electricity Transmission System in
GAUTRAIN: SUCCESSFUL IMPLEMENTATION OF SOCIO ECONOMIC DEVELOPMENT OBJECTIVES ABSTRACT
 GAUTRAIN: SUCCESSFUL IMPLEMENTATION OF SOCIO ECONOMIC DEVELOPMENT OBJECTIVES 1 CAREL VAN DER MERWE, 2 ELZER (JACK) VAN DER MERWE, 3 OLAUS AW VAN ZYL, 4 GEORGE NEGOTA 1 Executive Director, BKS (Pty) Ltd
Risk Appetite Statement
 Risk Appetite Statement May 2018 Risk Appetite Statement Contents 1. Mission, Vision, Values and Beliefs... 3 2. Introduction... 3 3. Overall Risk Appetite... 4 4. Risk Framework... 4 5. Key Risk Appetite
Jemena Electricity Networks (Vic) Ltd
 Ltd") Jemena Electricity Networks (Vic) Ltd 2016-20 Electricity Distribution Price Review Regulatory Proposal Attachment 7-9 JEN cost allocation methodology Public 30 April 2015 Jemena Electricity Networks
Jemena Electricity Networks (Vic) Ltd 2016-20 Electricity Distribution Price Review Regulatory Proposal Attachment 7-9 JEN cost allocation methodology Public 30 April 2015 Jemena Electricity Networks
Ontario Energy Board Business Plan
 Ontario Energy Board 2009-12 Business Plan Ontario Energy Board P.O. Box 2319 2300 Yonge Street 27th Floor Toronto ON M4P 1E4 Telephone: (416) 481-1967 Facsimile: (416) 440-7656 Toll-free: 1 888 632-6273
Enterprise Asset Management. Enterprise Asset Management 1
 Enterprise Asset Management 1 Introduction Managing assets effectively is critical to the success of organisations that depend on complex physical assets to deliver services. Increasingly, operators and
SUSTAINABLE GROWTH STRATEGY FINANCIAL SUSTAINABILITY STRATEGIC PARTNERSHIPS BUSINESS INTELLIGENCE
 2015-2020 Summary of 5 year SUSTAINABLE GROWTH STRATEGY B-BBEE LEVEL 1 CONTRIBUTOR ISO 9001 14001 20001 OHSAS 18001 CONTEXTUAL BACKGROUND CONTEXTUAL BACKGROUND The Coega Development Corporation (CDC) has
2015/2020 STRATEGIC PLAN, 2016/17 ANNUAL PERFORMANCE PLAN (APP) AND 2016/18 BUDGET. April 2016
 AND 2016/18 BUDGET. April 2016") DEPARTMENT OF PUBLIC SERVICE AND ADMINISTRATION (DPSA) 2015/2020 STRATEGIC PLAN, 2016/17 ANNUAL PERFORMANCE PLAN (APP) AND 2016/18 BUDGET April 2016 PRESENTATION OUTLINE 1. Introduction 2. Alignment of
DEPARTMENT OF PUBLIC SERVICE AND ADMINISTRATION (DPSA) 2015/2020 STRATEGIC PLAN, 2016/17 ANNUAL PERFORMANCE PLAN (APP) AND 2016/18 BUDGET April 2016 PRESENTATION OUTLINE 1. Introduction 2. Alignment of
Value for Money Strategy
 Value for Money Strategy 2013-15 1 Version: 3 Ref: 1009 Lead Officer: Chief Executive Issue Date: July 2013 Approved by: Strategic Board Approval Date: July 2013 Supersedes: Version 2 Review Date: July
RISK APPETITE IN PUBLIC SECTOR ORGANIZATION
 RISK APPETITE IN PUBLIC SECTOR ORGANIZATION IRM SOUTH AFRICA REGIONAL GROUP MEETING DE BEERS;CROWN MINES 11 FEBRUARY 2014 THE EXPERIENCE OF EMBEDDING A CULTURE OF MANAGING RISK IN THE GAUTENG DEPARTMENT
SHARED SERVICES - ASSET MANAGEMENT
 Filed: September 0, 00 EB-00-0 Exhibit C Tab Page of 0 0 SHARED SERVICES - ASSET MANAGEMENT.0 OVERVIEW The Transmission and Distribution businesses are operated using the Asset Management model, which
WfMC BPM Excellence 2013 Winner Copyright Bizagi. All rights reserved.
 WfMC BPM Excellence 2013 Winner Copyright 2002-2015 Bizagi. All rights reserved. Wf MCBPM Ex cel l ence201 3Wi nner 2 With nearly 1m cases and 28m activities performed in a month supporting $4bn financials
CORPORATE SOCIAL INVESTMENT POLICY
 CORPORATE SOCIAL INVESTMENT POLICY For more about African Chemicals, visit: www.africhemicals.com Page 2 of 10 Table of Contents 1. PREAMBLE... 4 2. SUSTAINABLE DEVELOPMENT AS THE BIGGER PICTURE... 4 3.
EXHIBIT GG. DATE FILED: February 9, :29 PM FILING ID: 9B5E9BDEA737B CASE NUMBER: 2016CV144
 DATE FILED: February 9, 2017 4:29 PM FILING ID: 9B5E9BDEA737B CASE NUMBER: 2016CV144 DRAFT 2008 ENERGY POLICY CITY COUNCIL MEETING JANUARY 6, 2009 1 1 Electric Energy Business Environment
Scorecard - Toronto Hydro-Electric System Limited
 Scorecard - Toronto Hydro-Electric System Limited 9/23/2015 Performance Outcomes Performance Categories Measures 2010 2011 2012 2013 2014 Trend Industry Distributor Target Customer Focus Services are provided
GROWTI-POINT PROPERTIES. Transformation Strategy Growthpoint Properties
 GROWTI-POINT PROPERTIES Transformation Strategy Growthpoint Properties..... Table of Contents 1. Preamble... 3 2. Why a Transformation Strategy?... 3 3. Our Approach to Transformation... 4 4. Our noteworthy
An Effective Convergence of Analytics and Geography
 An Effective Convergence of Analytics and Geography Gain Competitive Advantage Using Smarter Analytics Tony Boobier BEng CEng FICE FCILA FCIM MICPS Insurance Leader IBM Business Analytics EMEA Agenda 1
APPLICATION OF KING III CORPORATE GOVERNANCE PRINCIPLES 2016
 APPLICATION OF KING III CORPORATE GOVERNANCE PRINCIPLES 2016 This table is a useful reference to each of the King III principles and how, in broad terms, they have been applied by the Group. KING III ETHICAL
The Institute of Directors of South Africa ( IoDSA ) is the convener of the King Committee and the custodian of the King reports and practice notes.
 is the convener of the King Committee and the custodian of the King reports and practice notes.") ANDULELA INVESTMENT HOLDINGS LIMITED CORPORATE GOVERNANCE Corporate Governance Overview December 2016 The Board of Directors is committed to the implementation of good corporate governance within the group
ANDULELA INVESTMENT HOLDINGS LIMITED CORPORATE GOVERNANCE Corporate Governance Overview December 2016 The Board of Directors is committed to the implementation of good corporate governance within the group
FINANCE DEPARTMENT DIRECTOR
 FINANCE DEPARTMENT DIRECTOR Controller Financial Operations Analyst Deputy Treasurer Utility Accounts Procurement & Risk Services Accounting & Reporting Customer Service Purchasing Accounts Payable Collections
RISK MANAGEMENT REPORT
 RISK MANAGEMENT REPORT A RCL FOODS RISK MANAGEMENT REPORT 2016 RISK MANAGEMENT REPORT FRAMEWORK Risk management is considered by the Board to be a key business discipline, designed to balance risk and
NSW DIGITAL GOVERNMENT STRATEGY. digital nsw DRIVING WHOLE OF GOVERNMENT DIGITAL TRANSFORMATION DESIGNING IN OUR NSW DIGITAL FUTURE
 NSW DIGITAL GOVERNMENT STRATEGY digital nsw DRIVING WHOLE OF GOVERNMENT DIGITAL TRANSFORMATION DESIGNING IN OUR NSW DIGITAL FUTURE CONTENTS 1 MINISTER S FOREWORD 2 TRANSFORMATION IMPERATIVE 3 ROAD MAP
RESOLVING THE BILLING CRISIS
 RESOLVING THE BILLING CRISIS 1 Agenda 1. Welcome & Introduction 2. Public Finance Policy 3. Evolution of Public Finance Policy 4. Problem Definition 5. City Power & Joburg Water Issues 6. Property Unit
CGMA Competency Framework
 CGMA Competency Framework Technical Skills CGMA Competency Framework 8 Technical Skills : This requires a basic understanding of the business structures, operations and financial performance, and includes
1 July Guideline for Municipal Competency Levels: Accounting Officers
 1 July 2007 Guideline for Municipal Competency Levels: Accounting Officers issued in terms of the Local Government: Municipal Finance Management Act, 2003 Introduction This guideline is one of a series
Document History. Originator Section Update Details. Version Date Revision Class
 Document History Version Date Revision Class Originator Section Update Details 1.0 09/03/2014 N/A Adrian Searle N/A Initial version (ED1 March 2014 resubmission) Contents 1 Executive summary 3 2 Business
Strategic Plan:
 Strategic Plan: 2014-2018 Contents Contents... 2 Introduction... 2 Sunnyhaven: who we are and where we come from... 3 Sunnyhaven: the world we work in... 4 Sunnyhaven: our purpose, vision, values and priorities...
1H18 results and strategic progress update
 1 AUGUST 2018 1H18 results and strategic progress update Half year ended 30 June 2018 1 Introduction Chris Weston CEO 2 Agenda Headlines 1H18 results review Strategic priorities Financial performance drivers
Q CONFERENCE CALL. Prepared remarks from: David L. Dunkel, Chairman and CEO Joseph J. Liberatore, President David M.
 Q1 2017 CONFERENCE CALL Prepared remarks from: David L. Dunkel, Chairman and CEO Joseph J. Liberatore, President David M. Kelly, CFO Disclaimer Certain of the above statements contained in this press release,
SUMMARY Table 1 presents the proposed 2010 Smart Grid costs for Operations and Information Technology. Operations Projects 3,
 EB-00-0 Exhibit G Tab Schedule Page of SMART GRID PLAN SUMMARY Table presents the proposed 00 Smart Grid costs for Operations and Information Technology. Table : 00 Smart Grid Projects Smart Grid Projects
ATTACHMENT 2. Everyone Matters 2018/ /22
 ATTACHMENT 2 Everyone Matters Statement Draft Corporate of Plan Corporate 2018/19 2021/22 Intent 2018/19 2021/22 Table of Contents 1. Introduction... 1 2. Purposes... 2 3. Environment... 4 4. Performance...
PRESENTATION TO PORTFOLIO COMMITTEE ON TELECOMMUNICATIONS AND POSTAL SERVICES
 PRESENTATION TO PORTFOLIO COMMITTEE ON TELECOMMUNICATIONS AND POSTAL SERVICES ORGANISATION: USAASA & USAF PRESENTATION ON PERFORMANCE INFORMATION PERIOD OF REPORTING: Q 1 & Q 2 As at 30 September 2017
1. How can Ofgem ensure that sharper Cash Out incentives from the Significant Code Review:
 1. How can Ofgem ensure that sharper Cash Out incentives from the Significant Code Review: encourage generators and suppliers to balance their own positions before gate closure, thus reducing the call
HOW AN INDUSTRIAL BASELINE SURVEY CAN INFORM LONG-TERM STRATEGIC PLANNING AND FACILITATE CREATION OF SUSTAINABLE ECONOMIC LINKAGES
 HOW AN INDUSTRIAL BASELINE SURVEY CAN INFORM LONG-TERM STRATEGIC PLANNING AND FACILITATE CREATION OF SUSTAINABLE ECONOMIC LINKAGES Framework Step: STEP 2 - Build an empirical basis to inform decision-making
COMPLIANCE MONITORING REPORT OF PHUMELELA LOCAL MUNICIPALITY
 COMPLIANCE MONITORING REPORT OF PHUMELELA LOCAL MUNICIPALITY Monitoring Date: 27 October 2015 All enquiries and correspondence to be directed to the Head of Department, unless indicated otherwise, by means
JOB DESCRIPTION FORM Job title: Executive Manager: Housing Management Division/Department: Housing Management Patterson Grade: Date Prepared:
 Overall Purpose of the Job: The Executive Manager will provide strategic direction and leadership to ensure that the multiple projects managed by JOSHCO successfully meet the expectations of customer whilst
A more detailed description of Transportation, and its programs and initiatives can be found at
 Business Plan 2018 21 Transportation Accountability Statement This business plan was prepared under my direction, taking into consideration our government s policy decisions as of March 7, 2018. original
Head of Kent & Essex Estate Main purpose of the role: management of the joint Essex Status:
 Job title: Head of Kent & Essex Estate Main purpose of the role: Services Grade: SPS 9 Lead and direct the strategic Role code: E40835 management of the joint Essex Status: Police Staff Police & Kent Police
TECHNICAL INDICATOR DESCRIPTIONS 2012/ /15
 TECHNICAL INDICATOR DESCRIPTIONS 2012/13 2014/15 INDEX Page 1. Executive Summary 1 2. Electricity Industry Regulation 3 3. Piped-Gas Industry Regulation 17 4. Petroleum Pipelines Industry Regulation 30