ANNUAL REPORT: PRTF PERFORMANCE INFORMATION SYSTEM PROJECT
|
|
|
- Steven Price
- 5 years ago
- Views:
Transcription
1 School of Social Welfare, University of Kansas Twente Hall, 1545 Lilac Lane, Lawrence, KS Tel: ANNUAL REPORT: PRTF PERFORMANCE INFORMATION SYSTEM PROJECT FY This report provides an overview of the Psychiatric Residential Treatment Facility (PRTF) Performance Information System Project Team s activity from July 1, 2013 to June 30, This overview discusses the work of the project team and presents detailed findings of the survey research undertaken by the project team. This report identifies next steps for the project to promote the continued use of the PRTF Results Oriented Management (ROM) system based on current stakeholder requirements and on findings from project research.


2 PRTF Performance Information System Project THE PROJECT TEAM STEVE KAPP, MSW, Ph.D. PROFESSOR & PRINCIPAL INVESTIGATOR JERI L. DAMMAN, MSc GRADUATE RESEARCH ASSISTANT JORDAN L. RYAN, MSW STUDENT ASSISTANT Tel Fax Tel Fax Tel Fax Contact Information School of Social Welfare Twente Hall, 1545 Lilac Lane, Lawrence, KS Tel: Page 1
3 Table of Contents Report Structure 3 Part One: Overview of Project Activity Executive Summary 5 Introduction 8 Project History 10 FY Activity Review 13 Next Steps 24 Part Two: Research Report: The Achievements and Challenges in Using the PRTF ROM System Executive Summary 27 Introduction 30 Literature Review 31 Methodology 38 Findings 41 Discussion 57 Conclusion 63 References References 68 Appendix Appendix 1 66 Appendix 2 67 Page 2
4 Report Structure The FY annual report is presented in two parts. The first part is an overview of the project activity undertaken during the financial year. The second part is a more detailed report on research findings from the project s survey research undertaken on the achievements and challenges in using the PRTF ROM System. Page 3
5 Page 4 Part One: Overview of Project Activity
6 Executive Summary This project supports the use and further development of the PRTF Results Oriented Management (ROM) System through system management, scale and system technical support, and data analysis. The web-based system holds a range of clinical and administrative data on youth and has been used by all PRTF facilities contracted with the state of Kansas since January 1, The project has been in place since 2007 and was initially responsible for developing PRTF outcomes and later the PRTF ROM System. Since that time, the project has been responsible for the ongoing maintenance and improvement of the system and for continued support to system users across PRTF facilities. More recently the project has focused on improving data completeness as facility implementation efforts continue in the context of staff turnover and PRTF market changes. The project s focus for FY has been on improving the quality of PRTF ROM System data by developing provider buy in to the system, enhancing the project team s knowledge on the barriers to data collection and data entry experienced by providers, engaging with providers to continue to develop solutions to these barriers, and developing a regular system of monitoring data completeness and accuracy. In addition to the data improvements, system improvements and data analysis remained an important focus. The project team s most substantial area of work was its efforts to improve system use and access. Most notably, survey-based research was undertaken to identify barriers to data collection and data entry experienced by facilities. Each facility participated in telephone interviews to obtain information in three distinct areas: the administration of the Ohio Scales, the data entry into the ROM system, and the facility-wide implementation of the ROM system. Full findings are provided in Part Two of the FY Annual Report. The process of surveying PRTF facilities to better Page 5
7 understand how service providers are using the ROM system and what barriers exist was a valuable exercise for the project and the wider stakeholder group. Survey findings and key themes were the topic of an all-day PRTF Working Retreat organized and facilitated by the project team on March 27, This retreat gave providers the opportunity to come together to discuss issues, identify solution to common challenges, and to learn about current best practice across facilities. Provider feedback about the survey research and the working retreat has been overwhelmingly positive and a high level of buy-in across facilities is evident. The project s technical improvements relate to data exporting, developing a PRTF home page, and improving the ease of data entry. Together, these improvements seek to improve the access to project-related information and to improve the efficiency of data entry. At the request of KDADS, the project team developed and introduced monthly data completeness reports. These reports provide information on completeness of data for a range of key domains at both admission and discharge as well as a total mean percentage for data completeness for each facility. Reports are distributed to KDADS and facilities each month. Reports from July 2013 are available. The project team has maintained a high level of provider support and engagement throughout FY This has included regular presentations at PRTF stakeholder meetings, ongoing support to facilities in their use of the Ohio Scales and the ROM system, and research assistance on individual projects of interest to the wider PRTF community. This year the project team has focused on data analysis that strengthened provider buy-in and provided exemplars of how data could be used to evidence effectiveness. Data analysis pertaining to the service effectiveness of facilities both individually and collectively were examined with attention to how information could be presented by facilities to their own stakeholders. Page 6
8 The work of the project team was also shared nationally at the 27 th Annual Children s Mental Health Research and Policy Conference in Tampa, FL in March The project team had the opportunity to share findings from the survey in the context of our partnership approach to developing and implementing the statewide database. The project team s efforts in FY resulted in substantial success in addressing data quality improvements including achieving greater provider buy-in; enhancing project knowledge of the barriers to data collection and entry; engaging providers to continue to develop solutions and identify best practices; and, developing processes for monitoring data completeness and accuracy. The focus for FY will be on working with facilities to improve their data quality and use the ROM system data to inform practice. Page 7
9 Introduction The PRTF Results Oriented Management (ROM) system is a web-based system for facilities to enter youth placement-related data. The ROM system holds data on Kansas youth receiving services in PRTFs and who were admitted after January 1, All PRTF facilities providing services under contract with the state of Kansas use the PRTF System. Facilities enter a range of clinical and administrative data on youth at admission, while in placement and at discharge. Data includes: youth demographics; PRTF access details such as referral, acceptance, and admission status; treatment process issues such as serious occurrences and the hopefulness and satisfaction of the youth and parent; client status and outcomes data including problem severity and functioning at admission and discharge and the level of care of placement at discharge. The Ohio Youth Problem, Functioning, and Satisfaction Scales, typically referred to as the Ohio Scales, are used as the primary source of outcome-related data. This set of scales include three instruments to gather multiple perspectives and are completed by the youth, parent, and worker at admission and again at discharge (Ogles, Melendez, Davis, & Lunnen, 1999; Ogles, Melendez, David, & Lunnen, 2000). All three scales include measures for problem severity (rating degree of behavioral problems in past 30 days) and for youth functioning (such as interpersonal relationships, recreation, self-direction, motivation). The youth and parent scales include additional domains of hopefulness (about self/future and parenting) and satisfaction (with and inclusion in behavioral health services).the Ohio Scales provide cutoff scores to establish level of problem Page 8
10 severity and functioning and clinical significance. Change scores can also be calculated with cutoffs for clinically significant change. The PRTF ROM System provides a comprehensive array of reports to enable facilities to access their information for monitoring and evaluative purposes. This centralized system also includes a benchmarking capability in which a facility can compare their data statewide and against a statewide average. Some of the most popular reports include a census summary and change score reports for each of the four Ohio Scale domains (problem severity, functioning, hopefulness, and satisfaction). This project supports the use and development of the PRTF ROM System. The primary rationale for developing the ROM system was to monitor the performance of psychiatric residential treatment facilities across the state of Kansas. Project objectives include: (1) Managing the operations of the ROM system, (2) Providing technical support, (3) Conducting quarterly and annual data analyses, (4) Developing new reports and system upgrades, and (5) Providing training to PRTF providers on utilizing and managing the data in the ROM system. Part One of this report reviews the FY work of the project in the context of the project s wider history and defines the project s future direction of travel for FY This section of the annual report begins with an overview of the project s history, followed by a review of the project s activity for the year, and concludes with next steps. The project activity for the year is organized by improvements relating system use and access, technical improvements, monitoring data quality, provider support and engagement, and data analysis. Next steps for FY will continue to target improvements to data quality and ROM system use to inform practice. Page 9
11 Project History DEVELOPING OUTCOMES In 2007, the Office of Child Welfare and Children s Mental Health at the University of Kansas contracted with the Mental Health Office at the Department of Social Rehabilitation Services (SRS) on the statewide performance information system development project. The main purpose of this project was to implement outcome measurements across the psychiatric residential treatment facilities (PRTFs) serving Kansas children and youth. Following a program logic model (PML) framework, the researchers developed and implemented procedures to identify information needs related to program outcomes of PRTFs. Staff members at each of the state s seventeen PRTFs were interviewed about each of their programs and a model was presented and revised based on their input. Based on the results of these interviews, the researchers developed an overall PRTF program model and identified information needs of stakeholders related to outcome measurement. Based on the stakeholder interviews, and benchmarking of other states information systems, three outcome domains were proposed to be measured for psychiatric residential treatment for Kansas children and youth: (a) access, (b) process, and (c) client status outcome. The access domain measures the accessibility and availability of service for clients and their caregivers as well as the timeliness of follow-up care after discharge. The process domain measures the effectiveness of agency practices, including family involvement in client treatment and overall satisfaction with services. The client status outcome domain measures clinical improvement in the areas of functioning and symptom reduction and program outcomes such as successful treatment completion and placement at discharge. The stakeholders indicated a need for standardized clinical outcome measurements for use in monitoring client outcomes. After an extensive review of existing clinical outcome measures for children and youth with behavioral and emotional problems the Page 10
12 researchers recommended the Ohio Youth Problem, Functioning, and Satisfaction Scales (the Ohio Scales) as a uniform clinical instrument for measuring outcomes for clients and their families served by PRTFs in Kansas. DEVELOPING THE PRTF ROM SYSTEM (FY , FY ) After a six-month pilot study with six facilities (Florence Crittenton, Marillac, New Hope, Spofford, Ozanam, St. Francis, and Youthville), the Kansas PRTF Information System was officially implemented. In order to make the collection of outcome data more efficient, the researchers worked with software experts to develop a web-based system, The Kansas PRTF Results Oriented Management (ROM) system ( With the PRTF ROM System, facilities are able to enter their data into an online database and get up-to-date reports on performance indicators, including the Ohio Scales. The researchers provided in-person and webbased training to the PRTFs on using the ROM system and ongoing technical assistance. We also facilitated a meeting between the software developer and interested PRTFs to develop an automated data export system to simplify the data entry process. Unfortunately, the facilities lacked the necessary resources needed to develop an automated data export system. During this time we conducted a user survey to gain feedback from the providers on their use of the ROM system. The survey was completed by 25 out of 70 users and provided useful information on the functionality and usefulness of the ROM system. ANALYZING SYSTEM DATA (FY , FY ) The researchers implemented the first data analysis plan to provide descriptive profiles as well as multivariate analyses to examine the relationship between client profiles, key processes, and clinical and program outcomes. This analysis included data collected between January 2010 and May A total of 827 youth were discharged during this time period. The results of our analyses indicated that children and youth were making significant clinical gains in psychiatric residential Page 11
13 treatment facilities, were completing treatment goals, and being successfully discharged from care. Further, these analyses revealed that family involvement, hopefulness, and satisfaction with services contributed to improvement in both clinical and program outcomes. These findings were consistent with the literature on best practices for children and youth in residential treatment. The analysis also revealed that certain client characteristics, such as age and ethnicity, influenced both program and clinical outcomes. For example, non-white youth were less likely to achieve positive clinical outcomes and remained in facilities an average of days longer. The findings of the analyses were written into a final report and shared with the PRTF stakeholders. The researchers conducted a second outcome analysis on data collected between July 2011 and July A total of 389 youth were discharged during this time period. Similar to the previous year s results, the findings demonstrated that youth were making significant clinical gains in treatment. A majority of youth remained in care for 90 days or less, achieved their treatment goals, and were placed in a less-restrictive placement at discharge. This analysis identified youth and parent hopefulness as the strongest predictors of improvement on both clinical outcomes. Family involvement, such as the parent having a voice in treatment, was also a critical predictor of improvement on the two clinical outcomes. Lastly, length of stay significantly influenced the two program outcomes. For example, the findings indicated that youth who have longer lengths of stay are more likely to have a planned discharge and a less restrictive placement at discharge. PROMOTING DATA AND SYSTEM IMPROVEMENTS (FY ) Data analysis indicated relatively high levels of missing data in the PRTF ROM System and inconsistent levels and quality of data across facilities. The original composition of PRTF facilities had also changed with staff turnover and the closure of some facilities. These issues led the project to shift its focus to strengthening relationships with PRTF stakeholders to promote system utilization. Training and technical improvements were the primary focus along with increasing the Page 12
14 awareness of facilities about the quality of their data. Comprehensive training facilitated by the project team was made available to all facilities to improve provider knowledge on how to enter data and generate reports. An on-line training resource on using the Ohio Scales was also developed by the project team ( ). Technical improvements were guided by an Advisory Board that included provider representation. Efforts were also made to introduce a data exporting option for facilities where duplicate data entry was an issue. The work of the project was successful in strengthening engagement with facilities and gaining their support of the system. While PRTF stakeholders recognized the benefits of improving the data quality and making better use of the data, it become apparent that identifying and overcoming barriers to data collection, data entry, and implementation was needed. The project team identified these issues as their focus for FY FY Activity Review The focus for was on improving the quality of PRTF ROM System data by developing provider buy in to the system, enhancing the project team s knowledge on the barriers to data collection and data entry experienced by providers, engaging with providers to continue to develop solutions to these barriers, and developing a regular system of monitoring data completeness and accuracy. In addition to the data improvements, system improvements and data analysis remained an important focus. This section provides an overview of this activity. IMPROVEMENTS: USE AND ACCESS The project team achieved substantial progress in the areas of system use and access in order to achieve more complete data. A high level of stakeholder support for the project and the system was evident with a strong commitment by facilities to make targeted data improvements. Page 13
15 Through the project s work, facility staff developed a more thorough understanding of the barriers to data collection and data entry and with system implementation more generally and can use this information to improve internal processes and procedures. These improvements were a direct result of the project team s survey research and the project s working retreat at which the team shared the results from the survey with facilities. PRTF ROM System Telephone Survey. The major activity undertaken by the project team was survey-based research to identify barriers to data collection and data entry experienced by facilities. Through this research work, the project team also sought to develop knowledge in how the system was currently being used and to understand what facilities were already doing to improve the quality of their data in the PRTF ROM System. The project team developed three surveys, each focusing on a specific area: the administration of the Ohio Scales; the data entry into the ROM system; and the facility-wide implementation of the ROM system (Appendix 1, Figures 1, 2, and 3). These three surveys allowed for multiple perspectives and a more comprehensive level of information. PRTF facilities were informed of the project s plans for the survey at the July 2013 PRTF Stakeholder meeting. In July and August, the instruments were piloted with PRTF facilities, providers were involved in identifying staff to participate in the telephone survey, and interviews were scheduled by the project team. The majority of interviews took place in September and October 2013 with some interviews taking place in November and December After all telephone surveys were completed, the project team analyzed the data to identify key findings and themes. These findings were presented to stakeholders at the PRTF Working Retreat on March 27, The process of surveying all PRTF facilities to better understand how service providers are using the ROM system and what barriers are present was a valuable exercise for the project and the Page 14
16 wider stakeholder group. The majority of the barriers were common implementation challenges with wide variation across facilities in terms of how successfully they have implemented the Ohio Scales and the ROM System. The project team received substantial positive feedback from facilities for taking time to explore their use of the ROM system, which helped to refocus their attention on the ROM system and identify areas that required improvement in their facility. In addition to areas requiring attention, facilities were also able to reflect on their areas of strength and what they have done that has worked well. Facilities have shown a strong willingness to share their experiences in order to help other facilities improve data completeness. The project team will continue to support this collaborative approach in its ongoing work to improve system data. PRTF ROM System Retreat. After the survey was conducted, the initial plan was to develop a report and present findings at a quarterly PRTF stakeholder meeting. However, some concerns existed. Firstly, findings might not be disseminated to all facility staff members who might benefit from the information. Secondly, staff may not take the time to use the presentation of findings as an opportunity to plan practice improvements. Finally, the project team was also concerned that a single presentation would limit the detail provided and the scope for group discussion. The project team, in consultation with national scholars, discussed various methods of presenting findings to PRTF facilities. Following consultation, the project team proposed a one-day event structured in the form of a retreat (Appendix 1, Figure 4). Senior managers and facility staff who participated in the telephone interviews were invited to attend the retreat. This provided a better opportunity to discuss some of the findings in more depth in an effort to generate the practice change required. The purpose of the retreat was to share research findings focusing on key issues and trends by survey type (senior management, Ohio scales, data entry) and to share best practices identified through the survey based on provider views of what has worked well. The project team also wanted to give providers the chance to share their vision identified through the survey regarding how they would like to use the system in future. Coming together also gave stakeholders the opportunity to Page 15
17 identify solutions to key issues through large and small group discussions and develop a collective plan going forward. The ultimate goal was to focus on the agreement of each facility to commit to improving the quality and usefulness of system data. The morning session focused on key findings that explored key topics such as 1) The potential for Ohio Scales to be used to inform clinical treatment, 2) The improvement of internal processes across facilities, and 3) The use of system information and the challenges in achieving an information-led approach. The session included presentations by the project team and roundtable discussions among providers. The morning session also included a discussion on what the PRTF ROM System categorizes as serious occurrences as these data entry processes and data collection priorities appear to be less well established across facilities. The midday session involved a presentation by the project team on data analysis on the overall effectiveness of PRTF services. The afternoon session was provider-led with staff members from five PRTF facilities presenting on best practice examples as identified by the project team. These presentations related to the key topics of the retreat: clinical use of the Ohio Scales, effective processes, and using system information to inform clinical treatment. Presenters were staff from Marillac, Kids TLC, TFI Pathways, St. Francis and Spofford. The retreat concluded with a small and large group discussion on going forward. Participants of the retreat agreed that a task force should be formed to progress work on areas identified through the survey and the retreat in order to improve data completeness and system use. Provider feedback on the retreat was overwhelmingly positive. Participants reported that they felt like they had positive, achievable goals to bring back to their facilities. The full retreat presentation appears in Appendix 1, Figure 5. Page 16
18 IMPROVEMENTS: TECHNICAL Technical improvements in FY relate to data exporting, developing a PRTF home page, and improving the ease of data entry. The project introduced a data exporting solution with minimal success. While a number of facilities expressed an interest in learning about what data exporting could offer, few felt that its benefits outweighed resource costs (e.g. staff time for the initial data mapping stage and ongoing staff uploading time). Two facilities indicated that they wished to pursue data exporting but one of these facilities indicated that this was a long-term goal. The other facility began initial work on data mapping but this work was postponed due to competing priorities of the facility s technical support staff. The project will continue to support those facilities that plan to pursue this as a solution to improve data completeness. In addition to data exporting, the project targeted system improvements that would benefit data entry given the focus on improving data completeness in the system. Among these improvements, system developers are resolving issues to improve the flow and efficiency of data entry. These improvements remain in the test phase at the time of this report but are scheduled for release prior to the end of the fiscal year. In FY , an electronic version of Ohio Scales training was made available to facilities via the PRTF ROM website. The project team sought to extend the access to this training by creating an open access public website. The home page of the PRTF ROM System will also be revised to reflect the content of this public site. The intent in developing this public site is to improve access to material for PRTF staff members who do not possess a username and password to the PRTF site. The development of this site means that there is potential to share performance-related information with the public should stakeholders wish to pursue this in future. Page 17
19 MONITORING DATA QUALITY In August 2013 KDADS requested that a monthly data completeness report be developed to assist them in monitoring data completeness and associated improvements for each PRTF facility. KDADS requested the project team to develop the report and to submit this monthly. It was agreed that both KDADS and PRTF facilities would receive the report information to promote transparency and to assist facilities in their data improvement efforts. The team explored various data options given the imprecise nature of reports on data completeness. For example, some domains will have a higher priority than others so a facility could have less complete data but their data could be of more value. Also, there are challenges in presenting data completeness in simple terms that recognize differences in the number of youth entered. For instance, a facility with one admission and all data entered would show 100% data completeness, whereas a facility with 30 admissions and small gaps in data entry would have a much lower percentage. In addition to the difficulties in expressing data completeness accurately, another challenge for the project team was the lack of an efficient way to calculate the percentage of complete data by facility. The team ultimately proposed a manually-generated report to enable the presentation of data completeness by key domains. Reports on data completeness were made available using data from July 1, 2013 and sent to KDADS. Facilities were also ed the information on their data completeness each month. Data completeness reports (Appendix 1, Figure 6) provide the percentages of complete data and both admission and discharge. The data evaluated for completeness includes: Demographics, Social Security Number, Medicaid ID, Admissions and Discharge Date, Page 18
20 Treatment Completion and Primary Residence Youth Problem Severity and Functioning Scales, Parent Problem Severity and Functioning Scales, Worker Problem Severity and Functioning Scales, Youth Hopefulness and Satisfaction Scales, Parent Hopefulness and Satisfaction Scales. Using Excel and SPSS system data is extracted and the project team hand-calculate data completeness percentages for each domain at admission and at discharge. Using these domain percentages, a mean percentage is calculated for all the admissions domains for each individual PRTF facility. Feedback from facilities has been positive and providers have indicated that the reports provide them with the necessary details so they can address any data completeness issues regularly. The project team hope to introduce a system-generated data completeness report in future to improve efficiency and to ensure this information is more accessible to facilities. PROVIDER SUPPORT & ENGAGEMENT The project team has maintained a high level of provider support and engagement throughout FY in the form of regular presentations at PRTF stakeholder meetings; ongoing support to facilities in their use of the Ohio Scales and the ROM system; and, research assistance on individual projects of interest to the wider PRTF community. PRTF Stakeholder Meeting Presentations. The team s project updates were regular agenda items at the PRTF Stakeholder meetings with the project team presenting at the meeting in July 2013, October 2013, January 2014, and April Included among these presentations were: Page 19
21 Sharing FY advisory board actions and recommendations for approval -July 2013 ( Appendix 1, Figure 7) Providing each facility with their own missing data report based on missing data analysis from FY Reports included total number of youth entered in the system, trend summaries, percent of Ohio Scales missing from system and annual trends in data completeness, and a facility-specific analysis on data quality (July 2013) Presenting Data analysis on why good data matters (July 2013) and how service effectiveness can best be measured/presented -October 2013(Appendix 1, Figure 8) Presenting state-wide data reports on data completion and outcomes (Ohio Scales change scores, home-like placement at discharge, successful treatment completion), census (total in care, total discharged, average length of stay). (July 2013, October 2013) Facilitating a discussion with providers on what PRTF ROM System measures are most important (October 2013); and facility priorities for data (October 2013); and, working retreat follow-up -April 2014(Appendix 1, Figure 10) Project Updates including: system developments, KDADS data completeness reports, and survey research project -January 2014(Appendix 1, Figure 9) Ongoing Provider Support. The Project team continued to provide ongoing telephone and support to facilities to support their use of the Ohio Scales and the PRTF ROM System. As the year progressed and facilities become more attentive to data improvement, support provided by the project increased. Facilities generally find this form of support helpful and appreciate the hands-on problem solving available. Individualized Analysis and Support. In addition to the general technical support available to facilities, the project team has been available to support facilities in better understanding the data to support service improvements. The project team offered its assistance to one facility this year Page 20
22 on the issue of multiple placement youth a topic that has been previously recognized as an area in which stakeholders required a more in-depth understanding. The facility was interested in better understanding the pathways to re-admission such as the length of time from admission to readmission and whether youth were placed in other PRTFs as part of their treatment pathway. The facility was also interested in better understanding how these youth experienced change. For example, were changes in Ohio Scale scores fluctuating with improvements at discharge and subsequent relapse or was the change experienced by these youth more incremental, making slower progress with each new admission? The facility s access to the ROM system limited their ability to view information on placements with other facilities, so the project team agreed to assist. The facility provided details of known youth with multiple placements and the project team constructed a report with the necessary, anonymized, information. While this was of some value, the level of missing Ohio Scales information did limit the analysis usefulness. DATA ANALYSIS Although the project team had a greater focus on data improvement rather than data analysis, some data analysis was undertaken that strengthened provider buy-in and provided exemplars of how data could be used to evidence effectiveness. In addition to data analysis to promote data quality and use, analysis on multiple placement youth and regular data completeness reports contributed to the project team s work during FY The project analyzed data from a single facility to show facilities how data can be used to evidence service effectiveness (Appendix 1, Figure 7). A series of questions related to service effectiveness were addressed with data graphics. The first question was How effective is treatment? Facilities were presented with graphs indicating the percent of youth with good functioning at admission and then a higher percent of youth with good functioning at discharge. Page 21
23 The percent of youth with problem severity below clinical levels at admission and again at discharge was also presented as evidence that facilities could use to establish service effectiveness. Information was also presented on the degree to which positive and reliable change occurs in problem severity and youth functioning from admission to discharge as another way to address service effectiveness. Facilities were also presented with a potential response to whether a facility s effectiveness was improving over time. Levels of problem severity change for 2010, 2011, and 2012 was presented indicating increases in positive and positive reliable change and decreases in negative and negative reliable change over time. This analysis was later extended to include data from all facilities rather than a single facility (Appendix 1, Figure 5). The project team analyzed data to address the following questions: 1. What level of problems and functioning do youth have coming into the facilities? a. Has this changed over time? b. Does this differ by facility? 2. What level of change is occurring by discharge and is this meaningful? Results indicated youth with severe and extreme level of problems comprised the highest group of youth admitted to PRTFs compared with youth with no, mild, or moderate levels of problems. These groups were also increasing from year to year. Similar patterns occurred in the area of youth functioning; youth who had severe or extreme functioning difficulties were the majority and this group increased from year to year. Analysis was also conducted to establish if differences in problem severity and youth functioning at admission differed across facilities. All facilities typically had more youth with higher levels of problems and youth with lower levels of functioning. Due to the differences across Page 22
24 facilities in recorded admissions, more in-depth analysis would be required to establish the level of difference. With regard to the final question pertaining to the level of change achieved by the time of discharge and whether this is meaningful, all facilities indicated a level of mean change that was reliable and positive with minimal difference across facilities. This change related to both problem severity and youth functioning. Data analysis will continue to support provider s efforts to make best use of the ROM System data in order to become information-led and outcome-focused. Alongside this work, the project intends to use data analysis to better understand the various characteristics of youth and their PRTF placement that influence treatment success. NATIONAL ACTIVITY: DISSIMENATING FINDINGS In fall 2014, the project team s proposal to present at the 27th Annual Children s Mental Health Research and Policy Conference in Tampa, FL in March 2014 was accepted (Appendix 1, Figure 11). The presentation addressed the PRTF provider survey, its findings and project efforts towards a partnership approach to developing and implementing the PRTF ROM System. This provided the project team with the opportunity to share the work that the state of Kansas is doing regarding work towards more effective and meaningful relationships with child and adolescent mental health facilities. Survey results were shared that highlight the unique challenges of each facility and which impacted their ability to use the system effectively (see ). In addition to the diverse needs and drivers of each facility, the presentation also identified similarities that existed. The concluding discussion of the presentation was that findings from the study suggest that both addressing individual and collective needs of facilities should be met, when limited attention had been given to addressing both in organizational partnerships. Study findings Page 23
25 also suggest that by recognizing these individual needs, opportunities arise for other, more targeted collaborations including: more focused small-group partnerships among providers with common challenges and more opportunities for individual providers to share best practice. Overall the presentation was very well received and a thoughtful question and answer session took place following the formal presentation. Next Steps The project team s efforts in FY resulted in substantial success in addressing data quality improvements. These successes include: further developing provider buy in ; enhancing project knowledge of the barriers to data collection and entry; engaging providers to continue to develop solutions; and developing regular systems for monitoring data completeness and accuracy. Through the survey research on barriers to data collection and entry the project team has not only identified challenges but also best practices to enhance data quality improvements. This work has helped to shape the project s future direction of travel that continues its focus on successful implementation of the PRTF ROM System across facilities. The focus for FY will be on working with facilities to improve their data quality and use of the ROM System data to inform practice. The project team will facilitate a Task Force group responsible for overseeing a range of developments targeting technical and operational improvements to promote an outcome-focused and information-led approach by facilities. Among these areas to be addressed are: serious occurrences, outcomes measures, critical items, data completeness definitions, reports review, adaptation of scales for youth with intellectual disabilities, and oversight responsibilities for data completeness and system usage. The project team will lead the implementation of task force recommendations that will include: system changes, Page 24
26 support/training to facilities, scale adaptation, and process and procedural changes. Further, the project team will continue to undertake a range of data analysis activities to develop provider knowledge on how the system can be used and to address practice or process-related issues identified by stakeholders. 2014/15 Project Objectives are: (1) Introduce technical and practical improvements to promote a user friendly system that generates information that is needed; (2) Provide ROM system access, training, and support to PRTF facility staff as required; (3) Provide guidance and support to facilities, individually and in groups, to resolve strategic implementation challenges; (4) Monitor data quality and ROM system usage by facilities and providing training or support (5) Engage with facilities collaboratively to promote an information led approach across facilities (6) Conduct regular statistical analysis of ROM system data to address issues, to inform future use of the system, and to share outcomes and performance related information with facilities. These objectives will ensure a more comprehensive and sophisticated use of the PRTF ROM System as data quality is improved and facilities become more adept at using ROM system data. This collaborative project will achieve the high level goal of ensuring PRTF facilities become more outcome led in their work with youth in need of PRTF services. Page 25
27 Part Two: Research Report: The Achievements and Challenges in Using the PRTF ROM System Page 26
28 Executive Summary This study examined the barriers to data collection and data entry that contribute to missing data in the PRTF ROM System and the ways in which facilities use, and would like to use, system data in future. The project team also sought to identify best practice across facilities in their use of the PRTF ROM System. The project team used three project-developed surveys on: the administration of the Ohio Scales (data collection); the entering of data in to the ROM system (data entry); and, the implementation of the Ohio Scales and the PRTF ROM System at a facility level (implementation). These surveys were administered to PRTF staff with oversight responsibility for each of these three areas through a telephone interview conducted by two project team members. In total twenty-nine staff members from twelve facilities participated in the telephone interviews. These facilities represented all relevant PRTFs contracted with the state of Kansas. Findings from the survey on Ohio Scales administration indicate that facilities would benefit from greater attention to using the Ohio Scales to inform clinical treatment and that, across facilities, this practice was variable. Process issues relating to who completes the scale, how many staff are involved in completing the scales, and staff performance monitoring may contribute to a disconnection between scale completion and assessment, treatment planning, and review. Findings from the data entry survey highlight the need for improved processes and robust policies and procedures. Formal policies and procedures were limited although many facilities reported that unwritten policies that required completion of the Ohio Scales and data entry. This survey also highlighted the need to ensure effective coordination between staff responsible for data collection and data entry. Page 27
29 The implementation survey highlighted the need for further support to facilities to promote their use of the system information. While there was a high level of interest in the system information, facilities indicated that there were challenges in how to make best use of the data. Facilities typically wanted to use the information for quality improvement purposes, to evidence their effectiveness; and/or to provide alternative or complementary data to their medical records system. Respondents across all three sets of surveys were asked to identify what has worked well and what has been the most significant barrier. With regard to what has worked well, staff from all facilities were able to identify steps that had been taken to improve practice but most felt that more was needed. Changes to process, accountability, or staff buy-in were among the most common areas that staff felt had been effective. Among the barriers to completion of the Ohio Scales, staff identified poor communication, multiple assessments, and completing priorities as the greatest obstacles. Staff responsible for data entry most often felt that failing to get the Ohio Scales completed was the most common reason for data not being entered into the system. Findings from the implementation survey also identified data completion and entry as barriers to full implementation. Additionally, implementation issues such as staff awareness about the PRTF ROM System, adequate oversight and monitoring, and effective internal coordination had an impact on a facility s implementation of the PRTF ROM System. These findings suggest that greater attention needs to be given to: (1) using the Ohio Scales for clinical purpose, (2) ensuring effective organizational processes, and (3) attention to advancing n information-led approach. Further each facility is unique in how the Ohio Scales and the PRTF ROM System has been implemented resulting in significant variation in the facilities use of the Ohio Scales information and use of the PRTF ROM System data. Most facilities have some Page 28
30 use of the scales and or system but few have advanced to using both of these effectively. At the time of the survey, there were some facilities that were not making adequate use of either the scales or the system although the project team is aware of recent efforts among some facilities to indicate that this is changing. This study highlights the complexity and challenges associated with implementing an outcome-based instrument and IT solution intended to guide both clinical treatment and wider service improvements. Completing all of the required data and using it to best effect requires the involvement of admissions coordinators, case managers, therapists, data entry staff, supervisors, and administrators not to mention parents and youth at both admission and discharge. Despite these challenges, facilities evidence a strong commitment to become more information led in order to evidence their service effectiveness and to ensure their service continues to meet changing demands. Page 29
31 Introduction Part Two is a research report on the survey research conducted by the project team in FY This introduction addresses the purpose of the study. A review of relevant literature pertaining to system implementation in human service settings will then be presented. The study s methodology will be addressed followed by the study findings. Part Two of this annual report will conclude with a discussion of the findings and related next steps. Supporting materials can be found in Appendix 2. The goal of the survey was to enhance program knowledge about the barriers to data collection and data entry that would contribute to missing data in the PRTF ROM System. In addition to this primary goal, secondary goals were to gain insight into how system data was currently being used by facilities and how facility staff hoped to use this information in future. Further, the project team used the surveys as an opportunity to identify best practice in the facilities use of the ROM system. Since the introduction of the PRTF ROM System across facilities in January 2010, the project team identified variation across PRTFs in how the system was used by facilities. Further, changes were being identified in how the system was being used among facilities with some facility s use of the system increasing over time while other s use decreased, fluctuated, or remained consistent. Discussions with PRTF facilities indicated an awareness of data entry responsibilities and, for some facilities, that improvements were needed but this was not reflected in complete system data. During FY , analysis of data entered into the system was completed by the project for each facility to provide the team with a more detailed understanding of the quality of data across PRTFs. This information was shared with each facility to assist them in their data improvement efforts. While this information was informative, the project team felt a better understanding among Page 30
32 stakeholders would be beneficial about what improvements were needed and what was preventing facilities from making improvements. The research projected needed to address both the Ohio Scales and the PRTF ROM System. Further, the team felt that telephone interviews would provide a rich level of detail. Literature Review Various bodies of literature were reviewed including mental health, public administration, child welfare, and information systems management. All of these fields addressed issues of system implementation to drive performance evaluation or improvement efforts but the child mental health and child welfare literature are most relevant to the PRTF ROM System project, with each making their own important contribution. Children s mental health literature provides information on the current status of evaluation in children s mental health and outcome-informed practice. This literature also addresses current views in the field about how outcome-related information should inform practice. In child welfare, the trend to promote greater use of national data has led to improved technical assistance on how to use data more effectively. Together, this literature base provides insight into why the PRTF ROM System s outcomes are of importance at both a facility- and state-level, how these outcomes should guide current and future service delivery, and what facilities can do to begin to make better use of the PRTF ROM System data. CHILD MENTAL HEALTH S APPROACH TO OUTCOME MEASUREMENT Collecting and using outcome data to inform service delivery has come to be a basic tenet in children s mental health but has yet to be dispersed into the mainstream. Despite high levels of need for mental health services nationally, limited evidence is available on how best to measure outcomes and service effectiveness in child mental health (McMorrow & Howell, 2010). Further, Page 31
33 there have been no national evaluations of state mental health systems for children and while some national data is available for comparative purposes (McMorrow & Howell, 2010), it would be insufficient to guide service improvements and treatment at a local level. As such, outcome measurement at present is largely reliant on organization-specific data that may not be sufficiently robust to establish service effectiveness or outcome achievement. These broad challenges in promoting outcome-driven practice in child mental health are even more complex when distinguishing by service type such as psychiatric residential treatment facilities (PRTFs). PRTFs provide an important component in the child mental health service continuum but establishing overall service effectiveness is challenging (Brown, Barrett, Ireys, Allen, & Blau, 2011; Pavkov, Negash, Lourie, & Hug, 2010) due to variations in service type (Butler & McPherson, 2007), youth characteristics, and treatment approaches. Some efforts have been made to introduce a level of standardization in outcome-informed approaches by developing specific outcome monitoring models or methods, including the PRTF ROM System (Brown et al., 2010; Kapp, Hahn, & Rand, 2011; Wall et al., 2005). This literature review aims to identify current trends in developing these approaches to identify how best to resolve common barriers and to identify best practices that promote full implementation and data use. National System Implementation Efforts. A national picture is beginning to be developed about state systems to establish service effectiveness and inform service improvements. A study by the National Center for Children in Poverty (Cooper et al., 2008) examined various aspects of children s mental health policy, including state s use of outcome based management systems and information technology. Most states support and promote the use of data for the purposes of continuous improvement although 15 states described their use as rudimentary with no functional outcomes data available. The vast majority of states (41-45) had special initiatives in place to improve data/outcomes management, to establish system-wide outcomes and indicators, and to have access to state data for planning purposes. Thirty-one states reported initiatives to improve Page 32
34 electronic data information to inform clinical decision-making. Only two states (including Kansas) reported having an advanced IT infrastructure. There was variability in how states were developing IT infrastructure, which included: designing a system and developing data, using children s data warehouse that included cross-system data, and outcome management systems to inform evidencebased practice (EBP) implementation. States were asked to describe their level of IT and outcomefocused decision making using ratings of rudimentary, intermediate, or advanced. Kansas was the only state to rate its status as advanced in both of these areas with 19 other states describing a combination of intermediate and advanced status. These results suggest that Kansas is at the forefront of developing the IT infrastructure and an outcome-informed approach but should be cognizant of the work in other states to connect this work with EBP implementation and crosssystem decision making. IMPLEMENTATION BARRIERS AND SUCCESSES IN CHILD MENTAL HEALTH Child mental health literature has yet to address the extent to which organizations have introduced an electronic system of collecting and analyzing outcome-based data and even less attention is given to large-scale implementation (e.g. state level). However, the research by the National Center for Children in Poverty included a number of sub-studies to develop knowledge in this area. One of these includes a case study of Michigan s Level of Functioning Project (Banghart & Cooper, 2010), a system similar to that in Kansas but mandated for all children with severe emotional disturbance (SED) and receiving public mental health services. Consistent with Kansas use of the Ohio Scales, Michigan s Level of Functioning (LOF) project uses a standardized instrument, the Child and Adolescent Functional Assessment Scale (CAFAS), intended to inform decision making at both a clinical and administrative level. Although this case study did not address barriers in as much depth as the PRTF ROM System survey, the LOF study did examine the major barriers experienced by counties. Provider investment in the use of Page 33
35 the instrument was identified as a common barrier with providers needing to have a sufficient level of information on the purpose of the tool and how to use it to best effect as part of treatment and decision making. The study also indicated that the instrument provided a common language across facilities that could be used as a communication tool with families but, despite this, the majority of practitioners were not sharing it with families and relied on a more traditional therapeutic approach (Banghart & Cooper, 2010). In addition to instrument barriers, the study also highlighted some broader implementation barriers such as the need for provider incentive, recognizing the resources involved with instrument and system use and recognizing that data should be used to promote learning and improved outcomes rather than for punitive purpose (see Moore, 2002, p. 255 for a description on results-oriented vs. blame-oriented cultures). Hodges and Wotring (2012, p. 138) also address the Level of Functioning Project in Michigan through a case example. Building on the broader literature base on implementing outcome-related systems that identifies the culture of the organization, available technology, leadership buy-in, and the involvement of staff at all levels, the authors identify additional factors necessary for successful implementation. Firstly, the authors note that implementation needs to establish a clear connection between the use of the system and the agency s mission. This may require a change in both the organizational culture and mission statement from a focus on merely providing services to a focus on continuous efforts to improve and individualize services provided. This approach relies on a clear path from collecting the data to using it as part of a creative process aimed at outcome improvement (Hodges & Wotring, 2012, p. 139) and reflective of a learning culture across the organization. Secondly, the authors build on the premise that technology must exist to support data collection by stressing the importance of making this technology accessible to enter data, to review trends in client progress, to easily access outcome-related reports, and to provide aggregate info to Page 34
36 management. The authors suggest that ensuring the information is accessible increases the likelihood that practitioners incorporate this information into their therapeutic approach. Finally, a process of embedding [an outcome-based information management system] into the organizational fabric (Hodges & Wotring, 2012, p. 140) and relates to both staff attitudes/perceptions about the use of the system and their tasks associated with the use of the system. The authors indicate that this should involve a range of promotion, training, and mentoring activities to help staff members develop an understanding of the value of the system and contribute to any necessary adjustments to practice and protocol. TRANSITIONING FROM SYSTEM USE TO DATA USE Kapp and Anderson (2010), in the context of program evaluation, state that time is often spent thinking about planning and implementation of the new system or model while undervaluing the need to build a structure to support the use of the information. The authors recognize that creating a specific context in which evaluation findings are utilized is complex. Although the PRTR ROM System context differs from that of program evaluation, similarities exist in using data to what is working and to inform how current approaches may need to change. This also provides a helpful reminder for facilities to consider how they prioritize data vs. information, particularly given the current emphasis on improving data quality. With the PRTF ROM System project achieving improved use of the Ohio Scales and the ROM system for data entry, facilities are more attentive to the need to use the data more strategically for clinical and administrative purposes. This is reflective of the trend in child welfare where greater acknowledgement is being given to the need for improved competency in data use as data sets become larger and more complex. The National Resource Center for Child Welfare Data and Technology (NRCCWDT: published Framework for Managing with Data that is a resource tool for agencies to implement and sustain change when introducing a new system, and to utilize data to Page 35
37 improve outcomes (National Resource Center for Child Welfare Data & Technology, 2013a, 2013b). While the NRCCWDT tool does not represent the same structure and context as the PRTF ROM System, there is some useful information on how to increase the use of data. The NRCCWDT information highlights the need to be attentive to area such as: how often the system and data is used across the organization, who is the primary contact for system/data-related queries, and what type of training is needed to promote data use. The tool presents a five-stage process to move towards greater data utilization. FUTURE DIRECTIONS Of the limited information on system implementation that exists, most focuses on a future direction of travel that strengthens quality assurance and service improvement efforts. This purpose is strongly embedded in the PRTF ROM System project and will continue to guide the project s future direction of travel. In addition to these primary areas, the literature offers some additional areas that may be of interest to stakeholder in the future. These relate to outcome-based information systems being used to inform the development of evidence-based practice (EBP) and to strengthen a family-driven approach as reflected in the Systems of Care initiative. Stronger links could be made with efforts to inform evidence-based practice across the state. Information collected from the system could be used to establish effective service types that may benefit from wider development. In Michigan, state-wide data identified that a particular group of youth benefitted from a particular form of practice, which was subsequently expanded state-wide (NCCP Michigan, Michigan full report, p. 18) The PRTF ROM System data provides a rich source of information for families as consumers both in terms of the effectiveness of the services they are receiving and the quality of the service more generally. While other factors such as managed care and contractual arrangements may limit Page 36
38 the consumer choice available to families in selecting the service provider, a family-centered approach means that families should have access to such information. Service effectiveness and quality assurance are essential but the value of state-wide data has the potential to be used to even greater effect. The Michigan study indicate that state-wide data on population that were served well and less well in child mental health helped to identify trends based on geographical differences such as areas with higher areas of poverty, violence and trauma, or refugee populations. A future direction of travel is for PRTF ROM System data to inform child mental health commissioning arrangements with a focus on the under-served or specific populations. A review of the literature suggests that more work is needed across child mental health services to develop an evidence-base of service effectiveness and its role in promoting positive outcomes for the children and families it serves. Outcome-based systems of data collection are an essential mechanism for achieving this but their potential is substantially limited when data is restricted to an agency level both in terms of the ability to compare data across facilities and the opportunity for cross-service collaboration. The literature also indicates that there are innumerable challenges when implementing an electronic outcomes system like the PRTF ROM system and that even with proper planning and thoughtful implementation, it takes time to see the system fully utilized. And, finally, current literature suggests that the PRTF ROM System has the potential to benefit other initiatives in child mental health beyond outcome-informed practice through its ability to inform the delivery of evidence-based and family-centered practice. Page 37
39 Methodology The project team developed three surveys based on their knowledge of the ROM system, organizational process, quality improvement, and change management. One survey related to the administration of the Ohio Scales (data collection). Another survey addressed issues relating to entering data into the ROM system (Ohio Scales scores and other required data). The third survey addressed how senior managers have implemented the ROM system in their facility. The team felt that it was important to gather multiple perspectives from facilities in order to ensure that the knowledge gained was comprehensive and detailed. The survey for staff with oversight responsibility for the completion of the Ohio Scales explores who (i.e. therapists, case managers, admissions staff) and how many staff play a role in completing the youth, parent, and worker scales at both admission and discharge. Other survey domains include: scale completion oversight; the frequency of youth/parent/worker-related and organizational barriers; priority of scale completion in relation to other work priorities; staff perceptions of scales; clinical use of the scales; and alternative methods of accessing client outcome data. Survey questions either require participants to choose from a pre-determined list of options or from a five-point Likert scale (never a problem to always a problem). The survey includes some open-ended questions that aim to gather information on what facilities have done that has worked well, what they perceive as the biggest issue, and what could be done to achieve the further improvement. The survey for staff with oversight responsibility for data entry of required PRTF ROM System data is similar to that of the Ohio Scales in that process, priority, and oversight is addressed in addition to the open-ended questions described. Barriers relating to process, Page 38
40 system, and the organization are explored as well as responsibilities for generating reports and frequency in which reports are requested. The survey for management staff with oversight responsibility for ROM system implementation also addresses priority, organizational barriers, and staff perceptions. Openended questions consistent with the other surveys are also included. Further to these areas, the survey also explores the presence of internal policies and targets for completion; staff knowledge and use of the system based on roles; actual and desired use of system data; and agency s goal in using the ROM system. Together these three surveys provide a comprehensive understanding of how facilities have implemented the PRTF ROM System to date. Following the development of the surveys, the project team initiated a pilot phase. All facilities were contacted to seek volunteers to pilot each survey. Three PRTF staff members (each from a different facility) were identified from a group of volunteers to participate in a telephone interview. The three surveys were then revised to improve the clarity of some questions. All facilities had been previously informed of the project team s planned research project. Following survey development, all facilities were again contacted to provide further information and to request permission to contact staff with oversight responsibility for each of the three areas: data collection, data entry, facility-wide implementation. These staff were then contacted and information on the project was provided and appointments for a telephone interview to complete the survey were scheduled. PRTF staff members scheduled for interviews were ed a copy of the survey at the time of scheduling to allow time to consider their responses in advance. Telephone interviews were completed between September and December Interviews were conducted by two members of the project team with in-depth knowledge of the project and the facilities. Project team members conducted the telephone interviews by asking the survey questions and completing the survey form by hand at the time of the interview. Open Page 39
41 ended questions were recorded by hand or entered directly into word processing software. Interviews typically lasted 45 minutes. All relevant facilities contracted with the state of Kansas participated in the study. One facility did not take part but their circumstances were unique in that, although under contract, the facility had few Kansas residents in placement (approximately 1-2 placements per year). As such, it was agreed by the project team that their involvement was not required given that their use of the PRTF ROM System would be less established and quite different from other facilities who routinely manage placements with Kansas youth. Among the twelve facilities involved in the study, 29 staff participated in the telephone survey. Although three surveys were completed for each facility, some facilities had staff complete more than one survey. This was due to a staff member often having oversight responsibility for more than one area (e.g. completion of the Ohio Scales and facility-wide implementation). The project team entered survey data into statistical and analytical software after all interviews were completed. Quantitative results were entered into the SPSS and, given the small sample size, only descriptive results are provided. Qualitative data from the open ended questions was entered into Atlas Ti and coded according to themes based on each question. Findings This section provides an overview of research findings. These key findings relate to the issues, trends, and best practices identified by the project team. This section presents main findings but results from all survey questions are provided in Appendix 2, Figures 5, 6 and 7. Page 40
42 The first part of this findings section is organized by survey type with the findings from the survey on administering the Ohio Scales presented first, followed by findings from the Data Entry Survey, and finally the Implementation Survey. The second part of this findings section addresses qualitative findings on barriers and effective solutions. These findings are based on a set of open-ended questions in all three surveys. THE OHIO SCALES SURVEY The key finding in the Ohio Scales Survey was that the potential for using the Ohio Scales to inform clinical treatment is not being fully realized. Results of the survey showed that, even within agencies that are successfully completing the Ohio Scales, most facilities have yet to fully use the scales to inform clinical treatment. Varying Roles & Multiple Staff. The survey found that more than one person is often involved in administering and completing the Ohio Scales and that this responsibility is spread across different staff groups. When asked about administering the scales for youth at admission, 3 out of 12 respondents said that an admissions staff member administered the scales, 3 out of 12 said that a case manager/case coordinator administered the scales, and 5 out of 12 stated that licensed clinical or mental health professionals administered the scales to youth at admission (Appendix 2, Figure 1) Scale completion at discharge showed more consistency. Seven out of twelve facilities said that licensed clinical or mental health professionals completed youth and parent forms at discharge, while 4 out of 12 said a case manager/case coordinator completed the scales. High Numbers of Staff with Responsibility. In addition to more than one staff member having responsibility for the three instruments pertaining to a single youth, the number of staff Page 41
43 with responsibility for administering the Ohio Scales was relatively high. Five agencies have only 1-3 staff responsible for the parent and youth form but 4 facilities had 7-9 staff and one facility had staff (Appendix 2, Figure 4). The worker scales involved fewer staff but one facility had 7-9 staff and another had over 13 staff with this responsibility. Two facilities were not completing the worker scales at the time of the survey. This responsibility spread across a number of staff has the potential for inconsistencies to arise both in terms of scale administration and for the scale s clinical use. Limited Clinical Use of the Scales. The Ohio Scales survey asked respondents about how their facility uses the Ohio Scales in clinical practice. Respondents were given six examples and asked to rate the frequency of their use from Never to Always using a five-point Likert scale. The six examples of clinical use were: (1) identifying trends in the characteristics of youth, (2) identifying treatment trends within the facility, (3) identifying trends in individual caseloads, (4) reporting individual treatment progress at discharge, (5) monitoring individual treatment progress, and (6) individual assessment and treatment planning (Appendix 2, Figure 3). Examples 1-3 involve a more sophisticated uses of the scales and the majority of facilities (86%) reported Never using the scales in this way. Examples 4-6 involve more standard uses of the scales and the expectation would be that most facilities commonly use the scales in this way. With regard to example six (individual assessment and treatment planning), most facilities reported doing this to some extent. Of the 12 facilities surveyed, 5 used it for this purpose often ; 3 used it sometimes ; and 4 reported that they never used the Ohio Scales for assessment and treatment planning. In the case of examples four and five (regular monitoring and reporting progress at discharge), fewer facilities reported using it regularly with 50% reporting that it is never used for either of these purposes (Appendix 2, Figure 3). Page 42
44 Staff Performance Monitoring. Oversight of Ohio Scale administration and completion processes was an area requiring attention for many facilities. Respondents were asked to specify the ways in which staff performance was monitored using the following options: 1) formal staff appraisal, 2) occasional review of ROM system data or case file by supervisor, 3) regular review of ROM system data or case file by supervisor, and 4) regular supervision discussion. Most facilities did not address Ohio Scales administration as part of regular supervision discussions (Appendix 2, Figure 7). The most common form of staff performance monitoring across facilities was the occasional review of system data. Challenges in Completing the Youth, Parent, or Worker Scales. Current data completeness suggests that facilities experience greater challenges in obtaining completed scales at discharge. Some variation across facilities exists with some providers having lower rates of youth, parent, or worker forms at discharge. Surveys asked participants to explain the additional challenges they experienced at discharge for youth, parent, and worker. In the case of the Youth Scales at discharge, among the 12 facilities interviewed, seven facilities reported that the lower rate of completeness is often due to the youth being discharged in an unplanned way. Four facilities did not feel as though additional reasons existed at discharge to justify lower rates of completeness. Although facilities reported that youth being discharged unexpectedly also presented a barrier to the completion of the parent form, other issues presented as common themes. Respondents presented a range of issues but central to these issues was the difficulty in getting the adult to return the completed form. Some felt that this was most often an issue when case managers completed the parent form. One facility reported that youth may not have the necessary adult present at discharge and be collected by the transportation department or a family member. Where families live at distance, parents may not be present and forms are sent out but not returned. Page 43
45 Some facilities felt birth parents were more responsive and that, when present, the forms are completed. In general, facilities did not identify particular issues at discharge that resulted in lower rates of worker scales being completed. However, of the twelve facilities, three were not completing the worker form. Two of these facilities did not require that staff use it at present and one facility required it but had not had capacity although this has now been addressed. One facility identified a particular issue that related to the Ohio Scales being a lower priority with the competing demands present at discharge, noting that they are eventually completed but not in a timely manner. DATA ENTRY SURVEY Results from the data entry survey indicate the need for improved processes and more robust policies and procedures. It is important to note that these issues pertain to both data collection (administering the Ohio Scales) and data entry (entering the data in to the system). Clear Policies & Procedures. Processes across facilities ranged from the formal to less formal. Formal policies and procedures were generally lacking with 55% of facilities reporting that there was no policy in place for entering data into the ROM system. Most facilities reported that they needed more formal policies and procedures in place to more effectively manage both data collection and entry. However, respondents often indicated that there was an unwritten expectation that data entry was mandatory. Staff Performance Monitoring. Oversight of data entry was similar to that of the Ohio Scales administration with facilities most commonly reporting an occasional review of ROM system data as their primary form of staff performance monitoring (6 out of 10). Seven out of ten facilities did not address ROM System data entry as part of their regular supervision discussion (Appendix 2, Figure 6). Page 44
46 Data Collection to Data Entry Process. A key theme arising from the telephone surveys with facility staff responsible for the ROM System data entry function was the coordination between the group of staff completing the Ohio Scales and the staff member/s responsible for data entry. A number of respondents indicated that when scales were received, they were entered into the system and that any issues with missing data were due to the scales not being completed rather than not being entered. Some data entry staff adopted an oversight role whereby they would monitor admissions and discharges and chase outstanding paperwork, while others felt that it was not their responsibility to babysit staff. IMPLEMENTATION SURVEY The most notable finding from the Implementation Survey was that, across facilities, there was a high level of interest in the system information but challenges in how to make best use of the data. The survey showed that although some facilities were using ROM system data, no facilities were using this information as fully as possible. Only three out of twelve implementation survey participants reported that they often or always used system data to support clinical work by monitoring a youth s treatment progress. This level of use was also reflected in the responses from the Ohio Scales Survey. Use of the reports is limited and variable. When reports are used, it is most often to monitor agency capacity. 50% of facilities reported that they sometimes or often use reports for this purpose. 50% of facilities also reported that they sometimes often or always use reports to monitor the facility s performance or quality of service. Some facilities report that they also use ROM system data to evidence performance to governing bodies and to benchmark performance (Appendix 2, Figure 7). Although some are using information from the system, Page 45
47 many are not. Most providers indicate that they are never or rarely using the system data but would like to do this much more in the future. Agency s Goal in Using the PRTF ROM System. Staff completing the implementation survey were asked to describe their agency s goal in using the PRTF ROM System. Across the twelve facilities, responses were consistent with three common themes emerging: quality improvement, evidence effectiveness, and to provide alternative or complementary data to their medical records system. Improving the quality of services was the most common and facilities spoke of this improved quality both in relation to facility services generally and in relation to clinical practice specifically. To measure progress in treatment for clients to try to look at any kinds of trends to improve our overall performance both our individual and program performance (Facility E) Overall it is to be used for performance improvement and outcomes measurement (Facility D) Facilities also frequently described the goal of evidencing their effectiveness. If we had all the numbers in the right place it would tell us how the kids are doing and whether this PRTF placement was positive for them. We would then be able to demonstrate that our facility is beneficial and could share that information with others such as funders and the state. (Facility I) In general facilities recognized that this goal has not yet been realized and that the system was not yet being used for this purpose. Right now we re primarily using it to track the client s changes and achieving treatment goals. I think our goal however is to overall utilize it for what it s really capable of. We under-utilize Page 46
48 it there is so much more on this page (the survey page) that we could be doing. We need to help staff better understand the reasoning behind it and how to use it effectively. (Facility H) Although most facilities used an electronic medical record system, the PRTF ROM System was considered to be a useful addition or alternative. The medical records we use is not a good reporting system. In the ROM System we can get data in an appropriate format. (Facility P) I would like to be able to use it supplementally with our internal system it s nice to be able to check against or provide it in a different format. (Facility F) Two facilities described their interest in achieving collective benefit across state-wide PRTF facilities by using the data to identify macro-level impacts on service effectiveness and to guide the future development of PRTFs more generally. We would like to be able to contribute to an accurate statewide understanding of PRTF data. We would like to access and compare our information against others and draw some benchmarks and information on what PRTFS should be expected to do. (Facility F) I would also like to use the system to understand the impact of Medicaid changes. Looking at our services then and now. We need the system to tell the global story. How do the kids from 2010 differ from those we re seeing now? Length of stay between 2010 and now. Current placement at discharge then and now. How many of these kids are coming right back into the system or worse. Trying to determine the impact of shorter length of stays when they have to be so bad in the beginning to even get in. Is it good to have these short stays? (Facility P) WHAT HAS WORKED WELL Twenty-nine staff across the twelve facilities (2.5 staff per facility) were asked what their facility had done to improve the use of the Ohio Scales or the PRTF ROM System. Staff from all Page 47
49 facilities felt that their PRTF had taken steps to improve practice but staff from most facilities believed that more was needed. Changes were typically associated with process, accountability, or buy-in. Process. Staff members described efforts to change process or to further embed PRTF ROM System activity in the wider process. Process changes generally related to changes in the staff responsible for completing the Ohio Scales or data entry or to phase out other paperwork to minimize the impact on staff. Process changes - staff responsibilities. Changes in staff responsibilities were generally in response to previously identified issues. In one facility, responsibility for administering the parent form shifted from the admissions coordinator to the therapist to address the issue of parent forms not being returned. Another facility improved their process by having their admissions staff enter the youth into the system and to administer the parent scales to ensure that all youth admitted were entered into the system. In another, the facility noticed improved consistency in data entry after they transferred this responsibility from the case managers to two mental health workers on the night shift. Another facility shifted responsibility for the Ohio Scale s worker form from care workers to a much small group of milieu staff and noted a substantial increase in their return rate. Changes in staff responsibility appeared to be more successful when responsibility was shifting to a smaller, more concentrated group of staff. Process changes - paperwork. Some facilities noted that their facility noticed improvements when other paperwork was phased out to ease the administrative burden of staff, which included other assessments or internal data. Embedding system in existing process. Other facilities discussed improvements in the context of efforts to embed the Ohio Scales and PRTF ROM System into wider agency processes. Three facilities noted improvements resulting from the Ohio Scales being included in admission and Page 48
50 discharge packets and checklists. Another facility incorporated the Ohio Scales data collection and ROM system data entry into their working protocols. Accountability. A number of facilities provided examples of increased accountability when describing current practices that worked. One facility spoke of improvements after designating data entry responsibility to an individual staff member to ensure consistency. Another facility felt that the close physical proximity of staff was important to ensure information was passed along and the data entered. Some facilities felt that having the individual with data entry responsibility also responsible for tracking the completion of the Ohio Scales and ensuring entry into the system was important. The staff who enter the data now know that someone has been discharged and know that they need to go looking for the information. Staff are also better about getting the information to the person entering the data. (Facility P) Some facilities used this technique aggressively and report very positive results. Data entry staff monitor through the use of a spreadsheet that tracks who has been admitted into the facilities, Ohio Scales completion, and discharge information. If we discharge at 3pm, they at 5pm saying that the paperwork is missing (Facility N) Another facility assigned this oversight role to one case manager who was in charge of making sure the scales were completed and entered into the system. Other facilities spoke of clear and no-exception policies that required the completion of the Ohio Scales. Although these policies were often unwritten, some facilities felt this sent a clear message to staff and families that they were mandatory and proactive efforts should be made to ensure completion Page 49
51 We don t let people leave until they complete the form. If it s a social worker and you need to send it off, let them know it s a mandatory part of the paperwork. (Facility P) We do a better job of catching people to do scales while they are in the facility (Facility E) Two facilities felt that introducing a formal audit process helped. One facility included the Ohio Scales in their regular chart audits. Another facility found it helpful to include Ohio Scale information in grants because it required them to report on progress and to use the system more actively. And, another facility discussed PRTF ROM System generated reports at regular management meetings. We look at the reports and everyone sees the empty fields, which are highlighted. There s probably a nicer way to say it but it s public shaming and it works. The people who go to those meetings have leadership meetings on site so the people who need to know are there. It then goes through supervision and staff meetings with heightened oversight. (Facility H) Some facilities felt that a heightened or continued focus on the PRTF ROM System was a practice that worked well. One facility gave the PRTF ROM System a performance improvement designation. Another facility incorporated the Ohio Scale domains into their internal reports. Other facilities have less formal and structured methods for prioritization: We try to revisit it. We do see it as mandatory so even though it sometimes gets lost, we revisit it and try to remind ourselves that it s a priority. (Facility P) Staff Buy-In. Of all of the responses from staff about what has worked well, staff buy-in was mentioned most frequently although this was not necessarily a prerequisite for complete data. This buy-in related most to therapists and case workers understanding the value of the Ohio Scales. Page 50
52 I think the more the therapists and the case workers knew about it rather than oh you re circling numbers for someone else when we could show them reports and results -that made a ton of difference. Being able to show our [facility s] data. (Facility H) This isn t for the ROM but we are really using the Ohio Scales. We administer them every 30 days and look at them every 2 weeks. We show progress to parents (or deficiencies). Staff use them when they talk about how the kids are behaving on the unit. We use it to guide our treatment planning. (Facility F) Facilities felt that buy-in not only promoted the use of the Ohio Scales but also contributed to staff taking a greater interest in the data generated from the system. I do know that it s helped for people like [our QA manager] to get the staff information on where we re sitting have our holds for the month or the year gone up or down. (Facility F) We have a comprehensive communication plan about how we roll that information out to those folks. We have a big chart on the wall that shows Ohio Scales completion (we were at 4% now we re at 80%). Some people we tell them something and they never hear it again. We want them to see how their work is going. (Facility F) Other facilities described staff buy-in that was less about the clinical value or the scales or the system data but more about managing the implementation of the system effectively: Our initial plan was to replace some of our own internal data so that was an easy sell going into it. That it would replace and not add on. That went over well and that helped make the case. (Facility E) Some facilities described the role of training in promoting staff buy-in. This included both internal and external training, geared toward different staff members. Page 51
53 The KU training where we learned about the system was really helpful. I was blown away by what the reporting could do for us and was kicking myself that I hadn t been using this in the past. (Facility H) We have done a number of major QA improvements involving education of clinical and direct care staff. The purpose of the Ohio Scales, how to use it, and where to find it. (Facility F) BARRIERS Respondents were asked to identify the biggest issues in their agency that Ohio Scales completion, data entry, or PRTF ROM System implementation respectively. Barriers to Ohio Scales Completion. Among staff involved with Ohio Scales completion, issues such as poor communication, multiple assessments, and competing priorities were identified as the greatest obstacles. Communication related to staff s understanding of the purpose and value of the system and being privy to ongoing system-related information. One facility noted: [Data entry] enter the information into the system but we re not aware of the information in the system. We just give her the information she asks for. [Senior management] go to the quarterly meeting to see what s important and it doesn t get fed back to us. [Senior management] hear how it can be used, [data entry] get the info and can run the reports, I collect the information but none of us sit down and talk. Even the [KU] project is compartmentalized the surveys, the trainings that you do. It s nice because it respects everyone s time but still does everything in compartments. (Facility P) A staff member from another facility reported a similar issue Page 52
54 People don t have access to it or know how it works. We don t really know what it looks like. We re just not required to. [Head office] do all of that. They don t share the information they put into the system with us. (Facility N) Other facilities noted issues of time and conflicting tasks. A staff member from one facility felt that this related to staff s ability to take the proactive steps necessary to ensure forms were completed by parents and youth. This is more of a human resource issue than running at maximum capacity. This is more of an issue at discharge. We send a form out and don t get it back and we don t have the resources to spend trying to get it. Even at admission, we might not see it s missing until they re out the door and we can t take the time to follow it up. (Facility H) Some facilities felt that multiple assessment hindered Ohio Scales completion. One facility used the Ohio Scales for youth twelve and over and indicated that the Ohio Scales could be missed if there is a younger group of children on the unit. Sometimes the mix of kids on a unit we ve decided that we re going to complete the scales on kids 12 and up. For kids 11 and younger, we complete the CBCL. You have a team responsible for completing the Ohio Scales and for completing the CBCL. (Facility F) Another facility indicated that multiple assessments presented a challenge because of a staff preference towards other instruments. We have multiple assessments that are used on a more frequent basis that use much of the same information either through a trauma lens or as a CAFS. The CAFAS we ve used for a longer period and are more familiar with it. (Facility O) Barriers to Data Entry. Staff members involved with data entry were asked about the biggest barrier to ROM system data entry. Most responses related to the completion of the Ohio Page 53
55 Scales rather than issues pertaining directly to data entry. Five facilities felt that the problem was parents not completing the form and four felt the problem was workers not completing the form. While most facilities viewed Ohio Scales completion as the biggest issue, some data entry-related facilities were mentioned. Two agencies viewed excessive workloads and insufficient clerical staff as the biggest issue. Another facility felt that entering into two separate systems was problematic. Barriers to PRTF ROM System Implementation. Facilities were asked about the biggest issue they faced with successfully implementing the PRTF ROM system in their agency. Most responses identified issues that pertained to Ohio Scales completion or data entry. Ohio Scale issues such as unplanned discharges, uncooperative parents, or parents and workers not completing forms were mentioned. With regard to data entry, limited capacity and time was most often mentioned. Where facilities did address broader implementation issues, these generally related to issues with staff not being sufficiently informed about the system and inadequate oversight or monitoring. One facility described poor coordination within the agency as being their biggest issue. Five facilities discussed the problem of oversight and monitoring. Some facilities noted that monitoring the use of the Ohio Scales or data entry into the system was not done or done inconsistently and needed to be formalized. We need to make sure therapists complete the scales. We need to develop more formal ways to track completion at both time points. (Facility Q) What we haven t been doing well is the oversight and the regular monitoring of things. I think our folks are clear about what is expected of them but other things get in the way so our expectations fall short (Facility E) Page 54
56 Another facility recognized the importance of monitoring both the data collection and data entry functions. Part of it is getting the data so we can put stuff in and then the other part is having someone physically there to put the information in the system. (Facility F) When discussing monitoring, this involved both better management oversight and more effective monitoring systems to support the work of staff. A staff member from one facility, who also was responsible for the data entry function, highlighted the need for more effective monitoring systems: Not having the information in front of me getting it from those that complete the information or gather it. It can be confusing I m getting the forms at admission but not discharge or at discharge but not admission so it is difficult to figure out what is and is not being completed and where the forms are. It is also confusing to try to figure out when this information is needed. We have kids from Nebraska and Iowa and the information isn t needed for these kids. Getting social security care and medical numbers can be problematic. The biggest thing is just getting the information so that it can be entered. Sometimes the kids leave before they can get the forms completed or other things are happening with the kid at the same time. (Facility O) Changing and competing management priorities were mentioned as barriers to successful PRTF ROM system implementation. One facility felt this impacted on effective implementation: Definitely time and staff. Both capacity and actual number of staff are both issues. There is an ebb and flow with enrollment. That impacts on the workflow process so that makes a difference as well. I have to kick start things, then it gets put off for a few months, and motivation is lost. We re trying to make things more sustainable. (Facility F) Page 55
57 One facility commented how changing priorities impacted on the project s evolution: Taking time to think of next steps with project Not having time to use or look at data. There are massive changes in PRTFs and the state and we re always in crisis It s hard to focus on the project (Facility G) FURTHER IMPROVEMENTS All staff involved in the survey were asked what they felt the agency could do to improve data completeness in the system. Responses to this question typically addressed areas already covered with greater monitoring and oversight being the most frequently mentioned (7/26 interviews). Improving staff buy-in and involvement in the project and introducing formal protocols and procedures for data collection and data entry were next in frequency (4/26). The other steps identified by staff varied widely and included: using the data to establish a link to practice, entering data, implementing data exporting, finishing another major project, implementing the worker scale, having more staff or time, incentivizing parents to complete forms or promoting completion of the parent form among staff, establishing clearer roles and responsibilities, entering serious occurrences, and training staff internally. data levels. Responses to this question highlights the range of tasks facilities feel are in order to improve Page 56
58 Discussion This section discusses the survey findings in the context of issues, trends, and current best practice. As these issues, trends, and practices are inter-related, this discussion will be structured using the primary themes: 1. Using the Ohio Scales for clinical purpose; 2. Effective organizational processes, and; 3. Advancing an information-led approach. Before exploring these key themes, the issue of serious occurrences will be addressed followed by a brief overview of facility performance as it relates to use of the Ohio Scales and PRTF ROM System. SERIOUS OCCURRENCES DATA With the focus on challenges to completing the Ohio Scales and entering scale data, a limitation to this exploratory research is the limited attention given to the issue of serious occurrences data. Serious occurrences data provides an important component to understanding service quality and process and remains a valued element of PRTF ROM System data. The survey did not address serious occurrences data specifically but, through the telephone interviews, some facilities discussed serious occurrences in relation to their processes, strengths, or challenges. Serious occurrences discussions did not take place with each facility but, where these did occur it was evident that process issues existed. Firstly, the process for collecting and entering serious occurrence information was usually different from that of the Ohio Scales information and was less well established. Secondly, discussions with some facilities also indicated that data Page 57
59 collection and entry of serious occurrence information as defined in the PRTF ROM System was not a relatively high priority. Thirdly, other facilities indicated that problems would occur if serious occurrences were entered into the ROM system in line with current expectations such as substantial increases in data entry volume or with excessive duplication of information in electronic medical records systems. At present, there is no way to establish the completeness of serious occurrences data by facility. Based on information from the telephone surveys and the priority facilities are placing on other domains (e.g. Ohio Scales) when improving their data completeness, it is likely that serious occurrences in the PRTF ROM System are being underreported. Further work with facilities is needed to establish the value of and commitment to serious occurrences data in the system and expectations with regard to data completeness. FACILITIES USE OF THE SCALES AND SYSTEM The PRTF project expectations are that facilities use the Ohio Scales as part of their work with youth in placement rather than completing the scales as an administrative process. Further, the project is based on the premise that the facilities are the intended beneficiaries of the ROM system with information being generated to inform service delivery. Figure 8 in Appendix 2 plots each facility in terms of their use of the Ohio Scales and PRTF ROM System based on information obtained from the surveys. As this figure indicates, these project expectations have yet to be fully realized as few facilities are making adequate use of both the scales and the system. Quadrant one Figure 8 reflects the PRTF project team s ultimate goal of using the Ohio Scales and the system. Quadrant four reflects the least preferred position whereby a facility is neither using the scales or the system as intended. Quadrant two and three reflect positions whereby either scales or the system are being used but not both. Seven facilities use the scales or the system but not both. This suggests that some degree of formal implementation has been Page 58
60 effective but further work is needed. Four facilities were not using the scales or the system as intended suggesting that insufficient implementation of both the scales and system has occurred. One facility is using both the scales and system to inform clinical practice and service improvement efforts. USING THE OHIO SCALES FOR CLINICAL PURPOSE Survey findings indicate that, while some facilities used the Ohio Scales to inform clinical practice, many did not or did so to a very limited extent. This finding was somewhat surprising given the primary use of the scales is to inform assessment, treatment planning and decisionmaking both individually and collectively. Organizational process and staff buy-in were consistent issues that contributed to a disconnection between completion of the Ohio Scales and using information to inform clinical treatment. Process for Administering the Ohio Scales. Processes for completing the Ohio Scales influenced how the scales were used for treatment purposes. Initial assumptions were that, as reflected in the Ohio Scales guidance (Ogles et al., 1999; Ogles et al., 2000), a single therapeutic staff member was responsible for administering the youth and parent scales and for completing the worker scale at both admission and discharge. Survey results indicate that this is often not the case. The set of instruments were often completed by different staff members at both admission and discharge. Further, rather than therapeutic staff these staff often held roles that pertained to case management or admissions functions. Administering the Scales & Using the Scales in Treatment. Many respondents felt that such arrangements worked well both in terms of being more efficient and of providing the most accurate account of the youth s behavior and functioning. While these are indeed important benefits, facilities need to be certain that these multiple perspectives are funneled into assessment and treatment planning, particularly if the therapist is not directly involved in scale completion. Page 59
61 Consistency in Administering the Ohio Scales. Further, there needs to be consistency in scale completion from admission to discharge. While a single worker may not have the best knowledge of the youth at both of these time points, the consistency is important when calculating the degree of change the youth has achieved from admission to discharge. This issue of consistency also applies to the parent and youth scale. The youth and, in most circumstances, the parent will be the same from admission to discharge. However, if the youth and parent scales are administered by different workers at these time points, this may impact on how the forms are completed such as directions and support given to parents and youth. Benefits of an Ohio Scales Champion. In addition to scale administration processes, facilities that had an Ohio Scales champion seemed to make better use of the scales for clinical treatment purposes. Limited staff buy-in and a general lack of understanding about how to administer and interpret the scales was evident. Most staff viewed the Ohio Scales positively but had insufficient knowledge relating to how the scales could be used to inform clinical practice. A champion of the Ohio Scales was one that understood how to use the scales and their value and engaged with staff to develop their use and knowledge of the Ohio Scales. Some examples included in-house training, team discussions about how to use the scales, regular review of youth scores in supervision, involving staff in reviewing aggregate scores to better understand treatment effectiveness broadly. Many facilities used the scales in basic ways such as calculating a change score, reviewing change on certain items, or identifying differences among the parent and youth scores. All facilities would benefit from developing their use of Ohio Scales individual and aggregate data. As part of this, staff will need to understand what the PRTF ROM System is and how it holds Ohio Scales data that can be used to understand treatment effectiveness more broadly and when compared to other facilities and a state average. Page 60
62 EFECTIVE ORGANIZATIONAL PROCESSES Process & Managerial Oversight. Most facilities felt that improved processes were needed in their facility. While survey participants understood that problems in data collection and entry existed, they were not always clear about the cause of these problems due to limited process and managerial oversight. Most facilities lack formal policies and procedures relating to the Ohio Scales and PRTF ROM System although most indicated that an unwritten policy existed. Where process issues were identified, these often related to policies being inconsistent (no clear way of doing things) or ineffective (process clear but does not ensure the task is finalized). Processes from Collecting to Using the Information. It is important to note that effective organizational processes need to address completing the scales, entering the data into the system, and using the information. This study highlighted that good levels of data in the system did not necessarily reflect a good use of the data - the ultimate goal of the PRTF project. Therefore, data completeness is only a partial measure of effective processes and the project should be equally attentive to how facilities are beginning to make use of the data. Connection between Oversight & Using Information. In addition to issues of effective process, variation existed in the processes in place across facilities. Differences in organizational structure is likely to contribute to this wide variation with some facilities operating as a single agency and others as a branch to a larger treatment facility. Regardless of these structural differences, those facilities with strong oversight and quality assurance processes seemed to be more effective in managing the dual tasks of maintaining the system and using its information. Variations in Implementation. The PRTF project focused on the development of the system and technical support to facilities. With hindsight, greater emphasis on organizational implementation may have been useful to promote a more consistent approach to implementation and a shared learning environment. Discussions with facilities indicate wide variation in how the Page 61
63 use of the scales and system were implemented ranging from a formal launch to an incremental introduction. Further, issues such as turnover and competing priorities have meant that some implementation efforts have lost momentum or stalled. It is likely that more work needs to be done to regenerate efforts to achieve successful implementation of the scales and system. ADVANCING AN INFORMATION-LED APPROACH Using information to inform decision making within an organization is not a new concept and is a basic skill of most organizational administrators. Technological advancements, however, mean that levels of information are increasing and becoming more complex. Organizational staff may be unsure about what to do with all of the information available, what questions they should ask, where they start, and how best to obtain answers. The notion that administrators may not intuitively have these skills and require guidance on how to begin to become more information-led is increasingly becoming recognized (National Resource Center for Child Welfare Data & Technology, 2014). Strategy for Developing the Use of System Information. Across PRTF facilities, most have yet to use the PRTF ROM System information consistently. While data quality may contribute to the limited use of the data, it was clear that facilities need to develop their knowledge and skills in how to use the information to best effect. Most facilities wanted to use the information in a range of ways but few were actually doing so at present. Facilities need to have a clear strategy for increasing their use of system data to gradually develop their skill in using the information. Having a clear strategy will help facilities to better identify the questions they need answered and how information may help them to do this. These strategies should aim to promote more frequent use of the system information, more sophisticated uses of the information over time, and develop clear links with service improvement activity. If facilities have clear strategies in place for developing their use of system information, the project team could tailor its support accordingly. Page 62
64 Conclusion The project team sought to identify barriers to data collection and data entry that were experienced by facilities, to develop knowledge in how the system was currently being used, and to understand what facilities were already doing to improve the quality of their data in the PRTF ROM System. This study highlights the complexity and challenges associated with implementing an outcome-based instrument and IT solution intended to guide both clinical treatment and wider service improvements. Completing all of the required data and using it to best effect requires the involvement of admissions coordinators, case managers, therapists, data entry staff, supervisors, and administrators not to mention parents and youth at both admission and discharge. Despite these challenges, facilities evidence a strong commitment to become more information led in order to evidence their service effectiveness and to ensure their service continues to meet changing demands. The need to use the Ohio Scales for clinical purpose, to have effective organizational processes are in place, and to advance an information-led approach are all needed to achieve full and effective implementation of the PRTF ROM System. This will take time and the project team will need to be more attentive to organizational change required. Improvements to data completeness serves as only a partial indicator and equal attention will need to be given to how the Ohio Scales and the ROM System data are being used to inform clinical practice and service improvements. Each facility is unique in the strengths they possess and the challenges they face with completing the Ohio Scales, entering data into the PRTF ROM System, and using the information. These differences provide a wealth of information that can be collectively used to achieve statewide utilization of the system as originally intended. Facility staff members have indicated a Page 63
65 strong willingness to share their experiences with others in order to improve system data. All stakeholders should endeavor to make best use of this partnership approach given that all facilities have some room for improvement and the use of the ROM system represents unchartered territory for most stakeholders. The PRTF ROM System serves an important function in increasing the knowledge base relating to outcome achievement in PRTF services and what works well. System implementation is a slow and challenging process but results indicate a high level of commitment among service providers as the value of the system is generally understood. This indicates promise for the future in not only achieving an outcome-informed approach through full system use but also achieving a leadership role in system implementation in child mental health nationally. Page 64
66 Page 65 Appendix One & Two
67 Appendix One: Contents Figure 1: Survey Data Entry Oversight Figure 2: Survey Ohio Scales Oversight Figure 3: Survey Implementation Oversight Figure 4: PRTF Retreat Agenda Figure 5: PRTF Retreat Presentation Slides Figure 6: KDADS Monthly Data Completeness Report Figure 7: Stakeholder Meeting July 10, 2013 presentation slides Figure 8: Stakeholder Meeting October 9, 2013 presentation slides Figure 9: Stakeholder Meeting January 8, 2014 presentation slides Figure 10: Stakeholder Meeting April 9, 2014 presentation slides Figure 11: Presentation slides from 27th Annual Children s Mental Health Research and Policy Conference in Tampa, FL Page 66
68 Appendix Two: Contents Contents Figure 1: Chart: Who Completes Ohio Scales at Admission? Figure 2: Chart: Who Completes Ohio Scales at Discharge? Figure 3: Chart: How Often Do Clinical Staff Use the Ohio Scales for the Following Reasons? Figure 4: Chart: How Many Staff Currently Responsible for Administering Ohio Scales to Parents and Youth? Figure 5: The Ohio Scales Survey Frequency Report Figure 6: Data Entry Survey Frequency Report Figure 7: Implementation Survey Frequency Report Figure 8: Facility Overview: Four Quadrants Chart Page 67
69 References Banghart, P., & Cooper, J., L. (2010). Unclaimed children revisited: Focusing on outcomes - a case sutdy of the michigan level of functioning project. Columbia University: National Center for Children in Poverty, Mailman School of Public Health. Retrieved from Brown, J.D., Barrett, K., Ireys, H.T., Allen, K., & Blau, G. (2011). Outcomes monitoring after discharge from residential treatment facilities for children and youth. Residential Treatment For Children & Youth, 28(4), doi: / x Brown, J.D., Barrett, K., Ireys, H.T., Allen, K., Pires, S.A., & Blau, G. (2010). Family-driven youth-guided practices in residential treatment: Findings from a national survey of residential treatment facilities. Residential Treatment For Children & Youth, 27(3), doi: / x Butler, L.S., & McPherson, P.M. (2007). Is residential treatment misunderstood? Journal of Child & Family Studies, 16(4), doi: /s Cooper, J., L., Aratani, Y., Knitzer, J., Douglas-Hall, A., Masi, R., Banghart, P., & Dababnah, S. (2008). Unclaimed children revisted: The status of children's mental health policy in the united states. Hodges, K., & Wotring, J. (2012). Outcomes management: Incorporating and sustaining processes critical to using outcome data to guide practice improvement. Journal of Behavioral Health Services & Research, 39(2), doi: /s y Kapp, S.A., & Anderson, G.R. (2010). Agency-based program evaluations: Lesson from practice. Thousand Oaks, CA: Sage. Page 68
70 Kapp, S.A., Hahn, S.A., & Rand, A. (2011). Building a performance information system for statewide residential treatment services. Residential Treatment For Children & Youth, 28(1), doi: / x McMorrow, S., & Howell, E. (2010, July 2010). State mental health system for children: A review of the literature and available data sources. Washington, DC: Urban Institute. Retrieved from Moore, T. (2002). Results-oriented management: Using data to improve programs and services to achieve outcomes in child welfare. Paper presented at the Promoting Wellbeing and Monitoring Outcomes for Vulnerable Children Conference. National Resource Center for Child Welfare Data & Technology. (2013a). Managing with data: Considerations for measuring change and success. National Resource Center for Child Welfare Data & Technology. (2013b). Managing with data: Making - and sustaining - change. National Resource Center for Child Welfare Data & Technology. (2014). Managing with data framework. Retrieved from Ogles, B., Melendez, G., Davis, D., & Lunnen, K. (1999). The ohio youth problems, functioning, and satisfaction scales (short form): Users manual. Columbus, OH: Ohio Department of Mental Health, Office of Program Evaluation and Research. Ogles, B.M., Melendez, G., David, D.C., & Lunnen, K.M. (2000). The ohio youth problem, functioning, and satisfaction scales: Technical manual. Athens, OH: Ohio University. Pavkov, T.W., Negash, S., Lourie, I.S., & Hug, R.W. (2010). Critical failures in a regional network of residential treatment facilities. American Journal of Orthopsychiatry, 80(2), doi: /j x Page 69
71 Wall, J.R., Busch, M., Koch, S.M., Alexander, G., Minnich, H., & Jackson-Walker, S. (2005). Accountability in child welfare services: Developing a statewide outcome evaluation program. Psychological Services, 2(1), doi: / Page 70
72 Appendix 1 Contents Figure 1: Survey Data Entry Oversight Figure 2: Survey Ohio Scales Oversight Figure 3: Survey Implementation Oversight Figure 4: PRTF Retreat Agenda Figure 5: PRTF Retreat Presentation Slides Figure 6: KDADS Monthly Data Completeness Report Figure 7: Stakeholder Meeting July 10, 2013 presentation slides Figure 8: Stakeholder Meeting October 9, 2013 presentation slides Figure 9: Stakeholder Meeting January 8, 2014 presentation slides Figure 10: Stakeholder Meeting April 9, 2014 presentation slides Figure 11: Presentation slides from 27th Annual Children s Mental Health Research and Policy Conference in Tampa, FL

73 Survey Data Entry Oversight
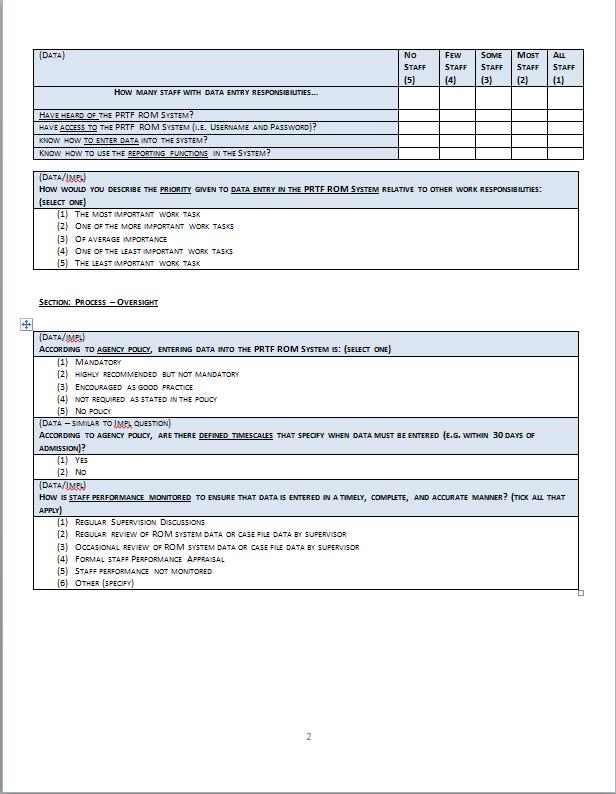
74

75
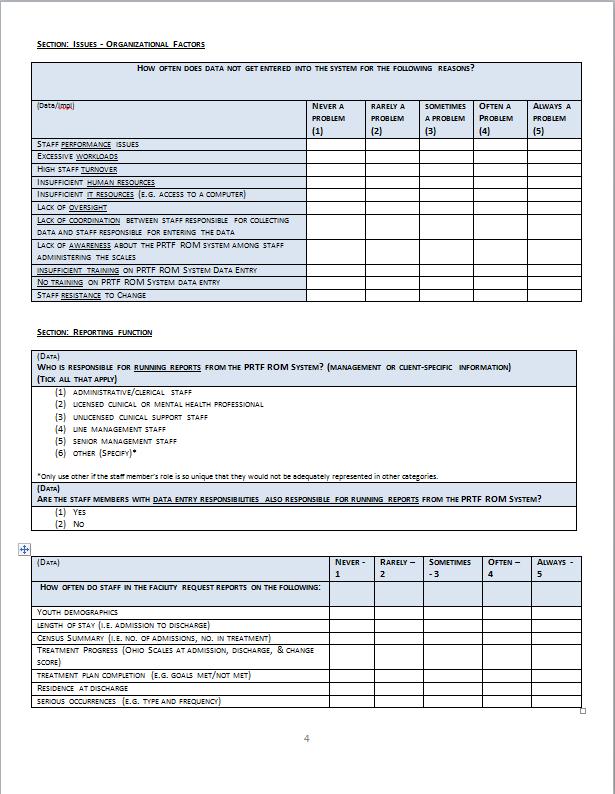
76
77
78
79 Figure 2: Survey Ohio Scales Oversight

80

81
82

83

84
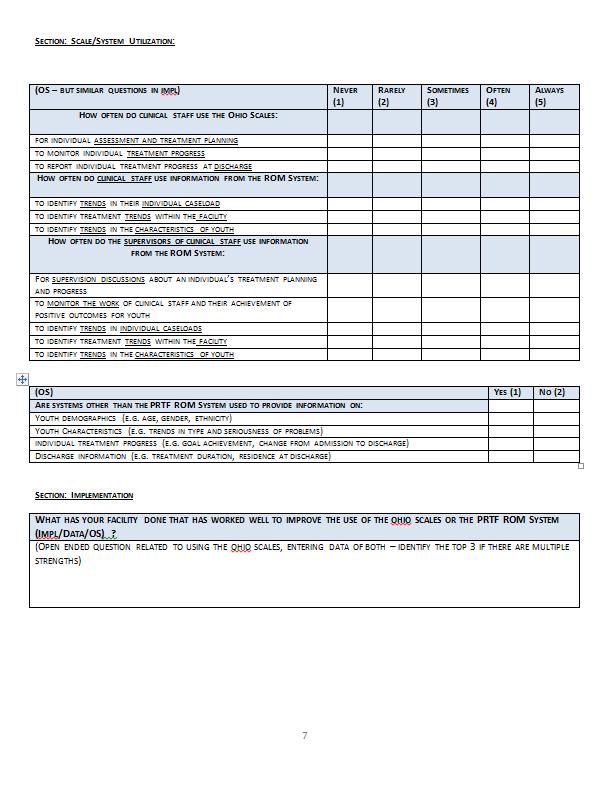
85

86

87 Figure 3: Survey Implementation Oversight
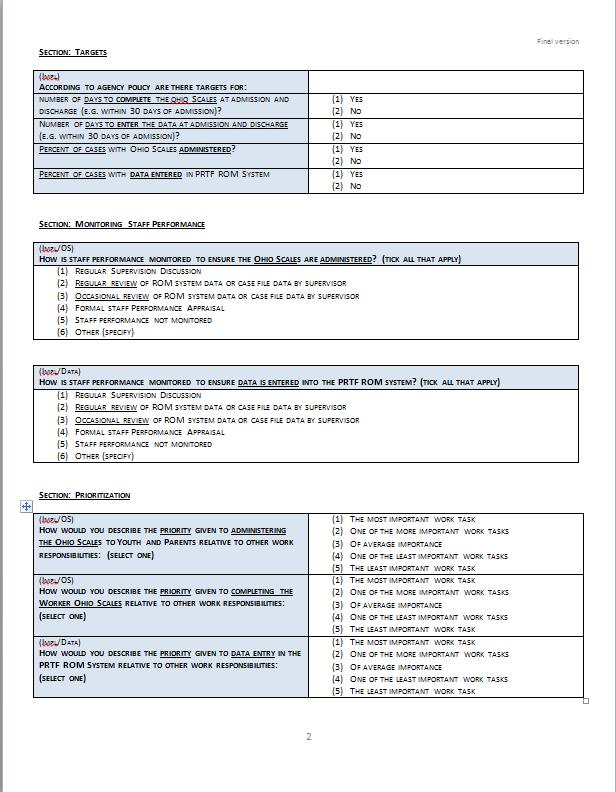
88

89

90
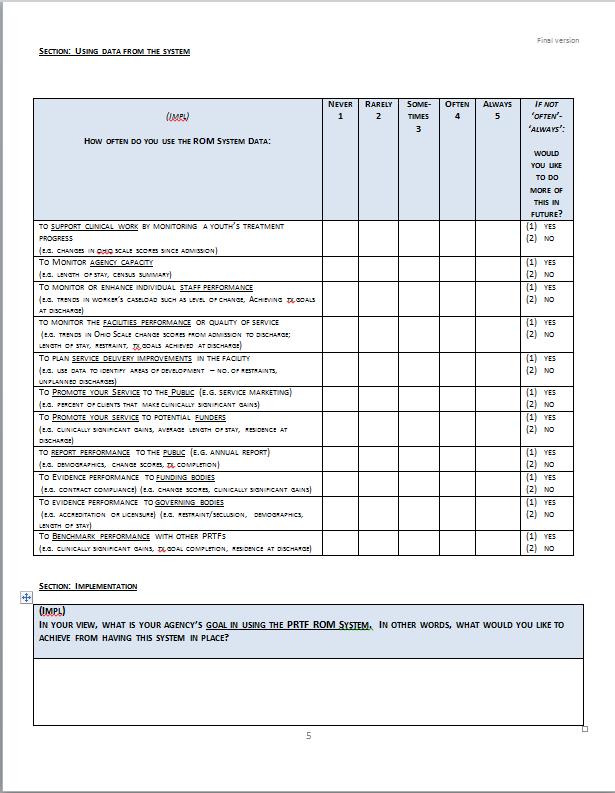
91
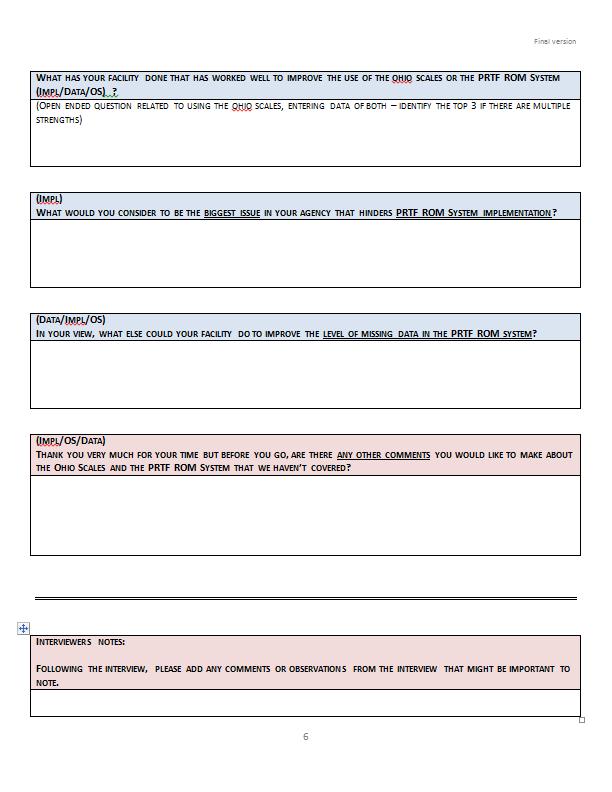
92

93 Figure 4: PRTF Retreat Agenda

94
95
96 Figure 5: PRTF Retreat Presentation Slides
97 PRTF ROM System: Going Forward March 27, 2014 University of Kansas School of Social Welfare

98

99 PRTF ROM SYSTEM: THEN & NOW
100 2007 Statewide Information System Development Project To implement outcome measurement across Psychiatric Residential Treatment Facilities in Kansas
101 WHY PRTF OUTCOME MEASURES? Resi vs. community tx debate Re-conceptualized as short-term tx model Limited focus on outcomes (systematic measure & research) Increased accountability Increased demand for best practices 5
102 STAKEHOLDER CONCERNS (2007) Outcome data collection varied Follow up data difficult to collect Wanted to track performance and outcomes over time Wanted to share and compare data with other agencies Wanted variations in client population recognized Differing views on final desired outcomes e.g. symptom reduction, functional improvement, increased self-efficacy Wanted information on recidivism
103 OUTCOME DOMAINS & INDICATORS Domain 1: Access Access to services Availability of services Follow up care Domain 2: Process Youth/caregiver participation in treatment Treatment plan completion Serious occurrence Use of restraint and seclusion Length of stay Domain 3: Client Status Outcomes Client satisfaction with services Improvement in clients functioning and symptom reduction Restrictiveness of living environment Return to PRTF
104 CURRENT CLIMATE Evolving role of PRTFs Shorter stays More acute and complex problems Clear and realistic outcome achievement Consolidation of PRTF Market Funding and resource constraints Managed care How can PRTF ROM System information Influence these evolving practices?
105 PURPOSE OF THE DAY: TO RE-ESTABLISH A JOINT DIRECTION OF TRAVEL Share best practices Share perceptions on future use of system Share findings Vision & Strategy for Going Forward Identify solutions to key challenges
106

107 OVERVIEW OF DAY 10:00-10:40 10:40-11:20 11:20-12:00 12:00-12:40 12:40-2:35 2:35-3:40 3:40-4:00 Welcome & Introductions Survey Findings Serious Occurrences Lunch Presentation Best Practice Examples Round Table Discussion Going Forward 11

108 HOUSE KEEPING
109


110 PRTF TELEPHONE SURVEY: KEY FINDINGS
111 CURRENT ISSUES Data Value Limited Outcome analysis Facility Variation Scale & System Use Data Accuracy Collective trends & issues Efforts to Improve Incomplete cases Incomplete data 15
112 THE STUDY Statewide, 12 Facilities (29 staff) 3 Surveys: Data Entry, Ohio Scales, Implementation Phone (45 min) 5-pt Likert & Open-ended Barriers to data collection and/or data entry What Works? Process, Perceptions, Issues, Use, Goals, Future 16
113 KEY THEMES Using the Ohio Scales for Clinical Purpose Effective Organizational Processes Advancing and Information-led Approach
114 KEY FINDING: OHIO SCALES The potential to inform clinical treatment is not being fully realized.
115 WHY? More than one person is often involved in administering and completing a set of Ohio Scales Scales may be completed but do not necessarily inform treatment Staff buy-in an issue & lack of understanding Clinical value of Ohio Scales Benefits of system of data Using the scales for clinical purpose good levels of system data
116 6 WHO COMPLETES OHIO SCALES AT ADMISSION? Licensed Clinical or Mental Health Professional Admissions/Intake Professional PRTF Case Manager/Case Coordinator Could Not Complete 1 0 Youth Parent Worker
117 8 WHO COMPLETES OHIO SCALES AT DISCHARGE? Licensed Clinical or Mental Health Professional Admissions/Intake Professional PRTF Case Manager/Case Coordinator Could not complete 0 Youth form Parent form Worker form


118 HOW MANY STAFF CURRENTLY RESPONSIBLE FOR ADMINISTERING OHIO SCALES TO PARENTS AND YOUTH 1-3 staff 4-6 staff 7-9 staff staff
119 STAFF MEMBERS RESPONSIBLE FOR COMPLETING WORKER SECTION OF THE OHIO SCALES 1-3 staff 4-6 staff 7-9 staff 13+ staff Not completed by facility
120 HOW OFTEN DO CLINICAL STAFF USE THE OHIO SCALES FOR THE FOLLOWING REASONS: Identify trends in the characteristics of youth Identify treatment trends within the facility Identify trends in their individual caseload Report individual treatment progress at discharge Never Rarely Sometimes Often Always Monitor individual treatment progress Individual assessment and treatment planning
121 VIEWS? Does it matter who completes the scales? (treatment planning) Does it matter how many people complete it for a single youth?
122 KEY FINDING: PROCESS Most facilities felt that improved processes were needed
123 EFFECTIVE ORGANIZATIONAL PROCESSES Varied implementation Varied processes (collecting and entering data) Most needed greater oversight (process & managerial) Most needed formal policies/procedures
124 Is staff performance monitored to ensure Ohio Scales are administered by...? Formal staff performance appraisal Occasional review of ROM system data or case file data by supervisor Regular review of ROM system data or case file data by supervisor Regular supervision discussion No Yes
125 Is staff performance monitored to ensure data is entered into the PRTF ROM system by...? Formal staff performance appraisal Occasional review of ROM system data or case file data by supervisor Regular review of ROM system data or case file data by supervisor Regular supervision discussions No Yes
126 VARIATION ACROSS FACILITIES We need more formal ways to track completion. If we discharge at 3pm, they at 5pm saying that the paperwork is missing. We look at reports and everyone sees the empty fields it s public shaming and it works. We try to revisit it. We do see it as mandatory so even though it sometimes gets lost, we try to remind ourselves that it s a priority. We have a comprehensive communication plan. We have a big chart on the wall that shows Ohio Scales completion. We were at 4% and now we re at 80%. (Provider W) 30
127 KEY FINDING: INFORMATION USE Across facilities, there was a high level of interest in the system information but challenges in how to make best use of it.
128 ADVANCING AN INFORMATION-LED APPROACH No facilities used info to maximum potential Use of reports varied never, basic, improving All wanted to use info better in future
129 ROM System Goals: Three main areas 1. Quality improvement 2. Evidence effectiveness 3. Provide alternative/complementary data to EMR Right now we re primarily using it to track the clients changes and achieving tx goals. I think our goal however is to overall utilize it for what it s really capable of. We under-utilize it there some much more on this page (the survey page) that we could be doing. We need to help staff better understand the reasoning behind it and how to use it effectively.
130 34
131

132 SERIOUS OCCURRENCES

133 SERIOUS OCCURRENCES DEFINED (ADVISORY BOARD, 2013) Injury : Client injury caused by self Injury: Client injury caused by accident Injury: Client injury caused by restraint Injury: Client injury cause by peer Aggression: Physical aggression by client without injury to others Aggression: Physical aggression by client causing injury to others Suicide attempt Restraint Event Seclusion or Safe room
134 SERIOUS OCCURRENCES ISSUES Processes differ and even less well established Less priority in data improvement efforts Potential for higher levels of EMR duplication Potential for high levels of data entry
135 ROUNDTABLE DISCUSSION What are the costs and benefits of having serious occurrences information in the ROM system? If you had full access to serious occurrences data, how might you be able to use it? 20 minutes to discuss Be prepared to feedback key points

136 ROUNDTABLE FEEDBACK
137

138 LUNCH
139 QUESTIONS 1. What level of problems and functioning do youth have coming into the facilities? Has this changed over time? Does this differ by facility? 2. What level of change is occurring by discharge and is this meaningful?
140 WHAT LEVEL OF PROBLEMS DO YOUTH HAVE AT ADMISSION AND IS THIS CHANGING OVER TIME?
141 PROBLEM SEVERITY AT ADMISSION 30.00% 25.00% 20.00% 15.00% Youth admitted Sept 2012 to Feb 2012 Youth admitted Sept 2012 to Feb 2013 Youth admitted Sept 2013 to Feb % 5.00% 0.00% No Problems Mild Problems Moderate Problems Severe Problems Extreme Problems
142 WHAT LEVEL OF FUNCTIONING DO YOUTH HAVE AT ADMISSION AND IS THIS CHANGING OVER TIME?
143 YOUTH FUNCTIONING AT ADMISSION 30.00% 25.00% 20.00% 15.00% 10.00% Youth admitted Sept 2012 to Feb 2012 Youth admitted Sept 2012 to Feb 2013 Youth admitted Sept 2013 to Feb % 0.00% No functioning difficulties Mild functioning difficulties Moderate functioning difficulties Severe functioning difficulties Extreme functioning difficulties
144 ARE THERE DIFFERENCES ACROSS FACILITIES IN THE LEVEL OF PROBLEMS AT ADMISSION?
145 Problem Severity at Admission by Facility (Jan 2012-March 2014) no problems mild problems moderate problems severe problems extreme problems
146 ARE THERE DIFFERENCES ACROSS FACILITIES IN THE LEVEL OF FUNCTIONING AT ADMISSION?
147 100 Youth Functioning at Admission by Facility (Jan 2012 to March 2014) no functioning difficulties mild funct diff moderate funct diff severe funct diff extreme funct diff
148 WHAT LEVEL OF CHANGE OCCURS BY THE TIME YOUTH ARE DISCHARGED? DOES THIS DIFFER BY FACILITY?

149 MEAN PROBLEM SEVERITY CHANGE BY FACILITY
150 MEAN YOUTH FUNCTIONING CHANGE BY FACILITY
151 IT LOOKS LIKE CHANGE IS HAPPENING BUT HOW DO WE KNOW THIS IS MEANINGFUL CHANGE?


152 PROBLEM SEVERITY LEVELS BELOW CLINICAL SIGNIFICANCE AT DISCHARGE Problems not at a clinical level Clinical level of problems
153 YOUTH FUNCTIONING ABOVE CLINICAL LEVELS OF SIGNIFICANCE AT DISCHARGE (PARENT RATED) Good functioning Poor functioning
154

155 PROVIDER PRESENTATIONS
156 PRESENTATION & ROUNDTABLE DISCUSSION THEMES Using the Ohio Scales for Clinical Purpose Tables 4 & 5 Effective Organizational Processes Tables 1, 2, 3, 4 & 5 Advancing and Information-led Approach Tables 1 & 3
157 Using the Ohio Scales for Clinical Purpose Marillac Kids TLC
158 Effective Organizational Processes Pathways TFI Saint Francis

159 Advancing and Information-led Approach Spofford Kids TLC

160 QUESTIONS
161


162 ROUNDTABLE DISCUSSIONS


163 SEE FOLDER FOR GUIDANCE
164 ROUNDTABLE FEEDBACK Key Points how to improve the use of the scales and system going forward Improvements Facility or State Level? A minimum requirement or good practice (should or must do)? Feasible or resource implications?
165 CLOSING Steve Kapp, KU Carla Drescher, KDADS

166

167 Figure 6: KDADS Monthly Report Example

168 Figure 7: Stakeholder Meeting July 10, 2013
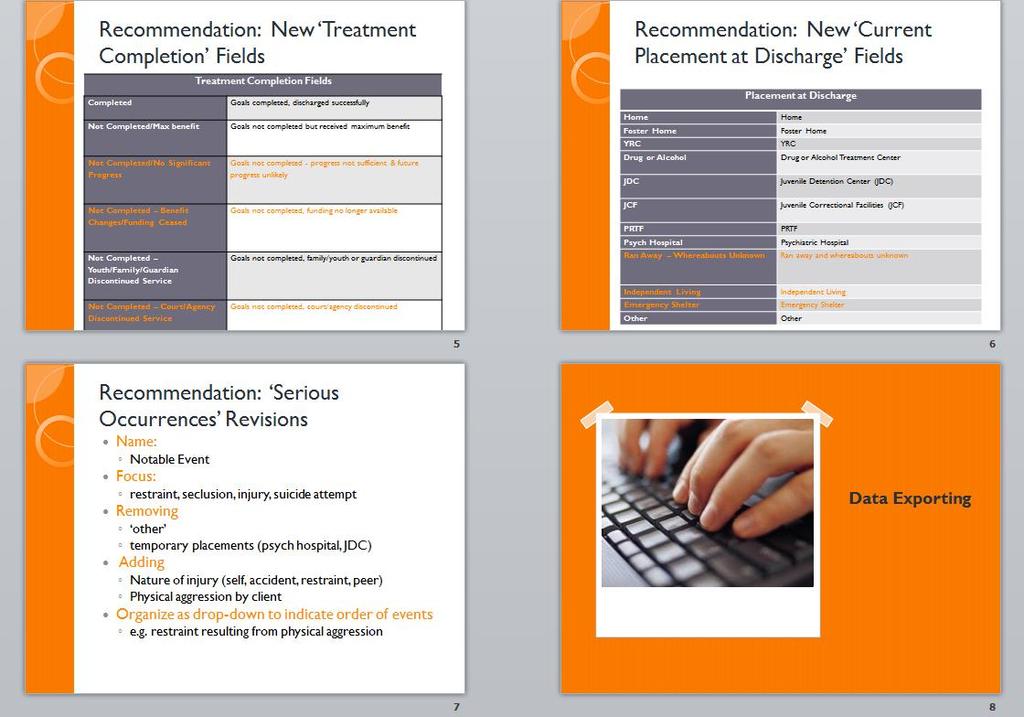
169

170

171

172

173

174

175


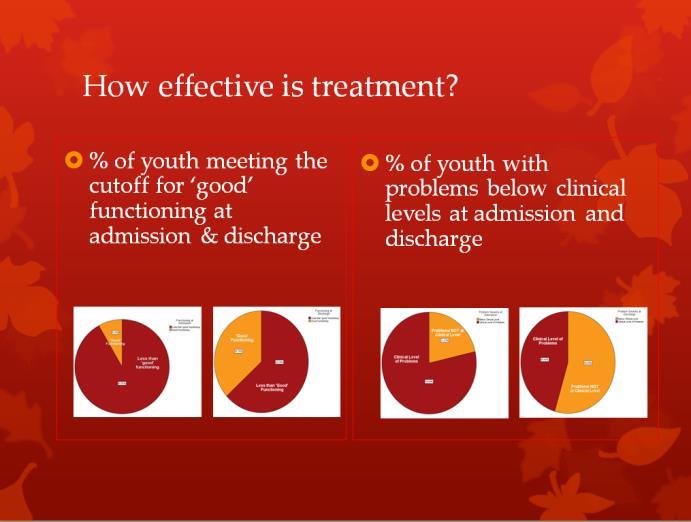

176 Figure 8: Stakeholder Meeting October 9, 2013


177


178


179 Figure 9: Stakeholder Meeting January 8, 2014

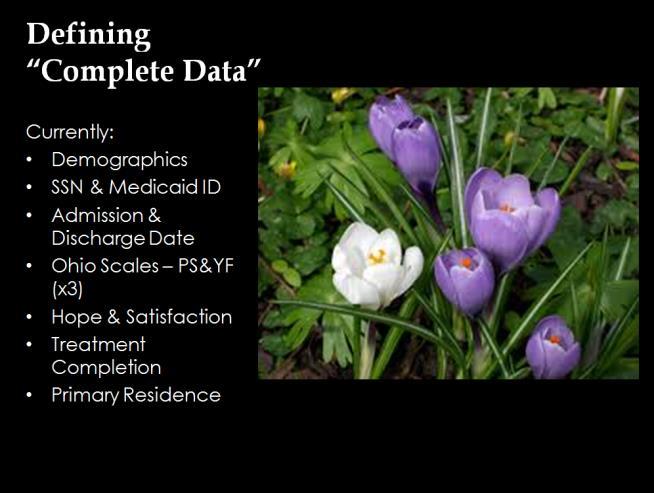

180 Figure 10: Stakeholder Meeting April 9, 2014
181 Figure 11: Presentation slides from 27th Annual Children s Mental Health Research and Policy Conference in Tampa, FL
182 Implementing a Psychiatric Residential Treatment Facility (PRTF) outcome-based information system in Kansas Steve Kapp, MSW, PhD Jeri Damman, MSc Jordan Ryan University of Kansas School of Social Welfare 1


183 Overview History Project Summary Historical partnership approach Current Challenges & Priorities Post-implementation issues Study Purpose, Methods & Findings An Implementation- Focused Partnership Our evolving partnership approach Future direction 2
184 Kansas PRTF ROM System Project (2007 to 2013)

185 The Project Goal (2007): To implement outcome measurement across Psychiatric Residential Treatment Facilities in Kansas Stakeholders: University of Kansas Kansas Department for Aging & Disability Services Contracted PRTFs CMHCs


186 Why PRTF Outcome Measures? Resi vs. community tx debate Re-conceptualized as short-term tx model Limited focus on outcomes (systematic measure & research) Increased accountability Increased demand for best practices

187 A Partnership Approach (17 facilities) Facility Interviews Focus Groups Logic Model Development Measure/Scale Review & Selection Pilot Scales System Development Pilot System


188 Kansas PRTF ROM System: A statewide web-based system Clinical Outcomes Client Characteristics & Demographics Program Outcomes Enhanced Knowledge of PRTF (single provider, statewide average, benchmarking)

 Admission &")

189 System Data Client Characteristics Clinical Outcomes Program Outcomes Age Race Gender Ohio Scales (youth, parent, worker) Admission & Discharge Length of Stay Serious Occurrences Goal Achievement Placement at Discharge
190 Keeping the dream alive
191 PRTF ROM System Project Ongoing Support (Technical) Quarterly Engagement with Facilities Our Current Role Data Analysis on Provider-identified Issues Training (System & Ohio Scales)
192 Issues Data Levels Stick or Carrot? Data Completeness Usefulness of Data Facility Variation We ll Do Better

193 Options
 3")


194 The Study Statewide, 12 Facilities (29 staff) 3 Surveys: Data Entry, Ohio Scales, Implementation Phone (45 min) 5-pt Likert & Open-ended Barriers to data collection and/or data entry What Works? Process, Perceptions, Issues, Use, Goals, Future
195 Key Findings Ohio Scales Limited use in informing clinical treatment Process Differences in how scales administered, few formal policies, limited oversight Information Use Interest in system information but challenges in moving forward with using information
196
197 Variation across facilities We need more formal ways to track completion. (Provider T) If we discharge at 3pm, they at 5pm saying that the paperwork is missing. (Provider M) We look at reports and everyone sees the empty fields it s public shaming and it works. (Provider B) We try to revisit it. We do see it as mandatory so even though it sometimes gets lost, we try to remind ourselves that it s a priority. (Provider K) Taking time to think of next steps having time to use or look at data we re always in crisis. (Provider D) We have a comprehensive communication plan. We have a big chart on the wall that shows Ohio Scales completion. We were at 4% and now we re at 80%. (Provider W)
198 Building on our earlier partnership work
199 Partnership: The next phase Developing a system Developing organizational practice Process, use of Scales/information Focusing on collective needs Using information for competitive edge Focusing on individual needs Using information for mutual benefit Capitalize on difference (subgroups, strengths, incremental goals) Mutually dependent, changing environment
200 Going Forward Clinical Use of Scales (Staff buy-in) What should the relationship be to other scales? What is the added value of the Ohio Scales? System buy-in or scale buy-in? Process What makes a good process? What do we mean by oversight? Using Information What is an information-led approach? What are the steps to get there?

201 A Mutually Beneficial Partnership Our use will be improved when we see that there is accuracy with everybody. We re among those who haven t so I m not judging but I am looking forward to that day when I can look at a report and say this is pretty accurate. That s really going to kick-start my use of the information and I will disseminate it to others here. (Provider W)
202 Appendix 2 Contents Figure 1: Chart: Who Completes Ohio Scales at Admission? Figure 2: Chart: Who Completes Ohio Scales at Discharge? Figure 3: Chart: How Often Do Clinical Staff Use the Ohio Scales for the Following Reasons? Figure 4: Chart: How Many Staff Currently Responsible for Administering Ohio Scales to Parents and Youth? Figure 5: The Ohio Scales Survey Frequency Report Figure 6: Data Entry Survey Frequency Report Figure 7: Implementation Survey Frequency Report Figure 8: Facility Overview: Four Quadrants Chart


203 Figure 1: Who Completes Ohio Scales at Admission? Figure 2: Who Completes Ohio Scales at Discharge?


204 Figure 3: How Often Do Clinical Staff Use the Ohio Scales for the Following Reasons? Figure 4: How Many Staff Currently Responsible for Administering Ohio Scales to Parents and Youth?