Inclusive Economies: States of India
|
|
|
- Evan Ross
- 5 years ago
- Views:
Transcription
1 Inclusive Economies: States of India Version: August 19, 2017 By Chris Benner with: Gabriela Giusta and Bidisha Chaudhuri
2 Outline Background & Evolution of the Inclusive Economies framework Sub-national case studies: Colombia, South Africa and India India: Overview of conceptual framework and preliminary results Discussion

3 Chris Benner, Director Manuel Pastor, Director Rooted in urban/economic geography and politicalecology, his research examines the relationships between technological change, urban and regional development, and structures of economic opportunity. His work focuses generally on economic issues, the environmental and social conditions facing low-income communities in urban areas, and social movements that try to change those realities. Gordon McGranahan, Research Fellow With a background in development economies, his work focuses on the politics, economics and practicalities of urbanization & economic productivity, social inclusion and environmental sustainability

4 5/equity-growth-and-community/
5 In this work, we learned 1. Inclusive economies are possible and can function better 2. What helps to make this happen in metropolitan areas of the United States is knowledge communities and cross-sectoral conversations 3. Data and indicator projects are not just about measuring change, they are tools to promote these conversation
6 First Phase: Inclusive Economies: Evolution of the theoretical framework Goal: to review the evolution of the inclusive economy concept, followed by an overview of the existing indicator initiatives that attempt to measure inclusive economies and related concepts.

7 Evolution of theory


8 Inclusive Economies Inclusive economies expand opportunities for more broadly shared prosperity, especially for those facing the greatest barriers to advancing their wellbeing. The Rockefeller Foundation defines an inclusive economy using five inter-related characteristics: equity, participation, growth, sustainability, and stability.


9 Landscape analysis More than 30 major indicator initiatives around the globe were reviewed to better understand related theories of change, and how concepts connected to inclusive economies are being measured. EUROPE 2020 A strategy for smart, sustainable and inclusive growth
10 Key insights from landscape analysis Processes and outcomes Initiatives often differentiate between indicators of outcome and of processes that create those outcomes. However, it is not always feasible or desirable to distinguish between processes and outcomes particularly since outcomes in one arena are often inputs in other processes. As a result, processes and outcomes can become a virtuous cycle towards inclusivity (or represent a vicious cycle towards greater exclusion). Indicator development The general picture shows volumes of scattered information being put forth by different organizations, with little consensus on what is most important to measure, and highly uneven efforts to integrate approaches. If we are to promote conversation around inclusive economies, we must develop a common language as well as shared metrics for tracking progress. Embedding indicators Some indicator initiatives are explicitly embedded in a theory of change in which indicators are chosen because they relate to clear understandings of how a more inclusive society can be created. The benefit of articulating indicators within an explicit theory of change is that it gives greater focus to the complex nature of the various social, economic, governmental and institutional processes, and feedback loops, that are involved in delivering social change.


11 Final Product First Phase The projects of this work includes a report that details the process of this investigation, an executive summary and a web-site that gives access to these documents to the general public
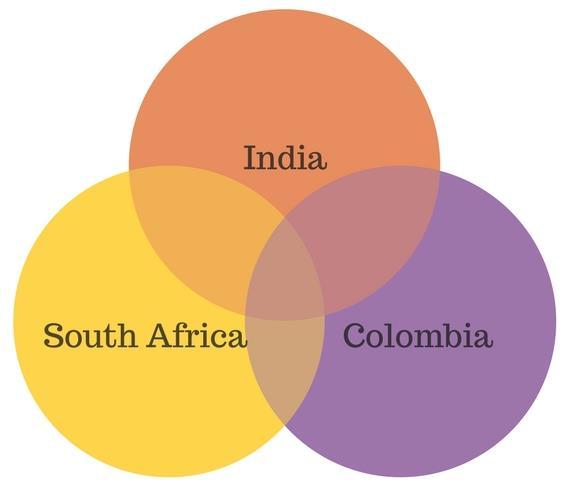
12 Second Phase Inclusive Economies: Sub-national case studies We apply the Inclusive Economies framework across three different contexts, both conceptually and geographically. The goal is to explore how the framework fits (or comes short) in measuring inclusivity around the globe.
13
14 Some Insights from: South Africa Key Inclusion issues: Overcoming Racial/Spatial Divides Relationship between Cities, Metros, Nation Rural/urban politics Process Indicator initiatives exist key goal is to improve them What is the value-added of this framework Colombia Key Inclusion Issues Legacy/Influence of Violence and Drug Trade Large internally displaced population Civil society supressed Process City driven data initiatives growing Trying to adapt framework to local context How to lift-up local community voices/perspectives?
15 Inclusive Economies: States of India To explore the diversity of experience in inclusion across the country, we focus our analysis on four representative rural states from different regions, namely Andhra Pradesh, Assam, Bihar and Rajasthan. In addition to these four states, we also include Kerala as a reference state because of its strong socioeconomic development history.
 were possible Indicators are for states, which combines urban and rural populations")
16 General Comments Aiming for maximum applicability at the sub-category level, with hopefully universally applicable concepts Specific indicators are highly dependent on the context, and are limited by data availability Most indicators also should be broken down by population subgroups (e.g. gender, race, caste, religion) were possible Indicators are for states, which combines urban and rural populations
17 Preliminary results We recommend indicators across the five broad dimensions indicated in the framework above, as well as indicators that are specific to rural development in India. Data on selected indicators are currently gathered by reliable government, private sector, or non-profit organizations.
18

19 A. Upward mobility for all Intergenerational education mobility. Intergenerational income mobility. Income mobility within a person s lifetime. B. Reduction of inequality Relative income poverty. Concentration of wealth at the top. Gender equity. C. Equal access to public goods & ecosystem services Access to safe water and sanitation. Access to commercial energy services. Access to education and health for children. Access to public transportation.
20 Percent C4. Net Enrollment Ratio in upper primary all population 80% Andhra Pradesh Assam Bihar Kerala Rajasthan 70% 60% 50% 40% 30% 20% 10% 0% Source: Planning Commission, Govt. of India.

21 Overall states level of inclusion for all indicators: Source: own calculations *Green values = greater inclusion. **Red values = less inclusion. ***Bolded indicators indicate that higher values mean less inclusion.
22 Equitable Andhra Pradesh Assam Bihar Kerala Rajasthan B1. Gini Coefficient (Rural) 2.00 C7c. Alleged human rights violation of women C5. Infant mortality rate (all population) B3. Percent of population in highest national wealth quintile B4. Reproductive Health: Maternal Mortality Ratio (Per 100,000 Live Births) C4. Net Enrollment Ratio in upper primary all population C1. Proportion households having toilet facility within the premises. C3. Households having electricity (%) C2. Access to safe drinking water in households (All population)
23

24 D. People are able to access and participate in markets as workers, consumers, and business owners Formal and informal employment. Household consumption. Business development. E. Market transparency and information symmetry Market regulation. Freedom of expression and association. Government power and corruption. F. Widespread technology Access to telecommunication devices. Access to internet.
25 Percent D1. Rate of Workforce Participation (2011) 70% Female (Rural) Male (Rural) Female (Urban) Male (Urban) All population 60% 50% 40% D. People are able to access and participate in markets 30% Formal and informal employment. 20% Business development. Level of household consumption. 10% E. Market transparency & information symmetry Market regulation. Freedom of expression and association. Government power and corruption. C. Widespread technology Access to telecommunication devices. Access to internet. 0% Andhra Pradesh Assam Bihar Kerala Rajasthan Source: Ministry of Statistics and Programme Implementation, Govt. of India.
26

27 G. Increasing good job and work opportunity Access to employment. Change in per capita income. Absolute measure of poverty. H. Improving material wellbeing Absolute level of per capita income. Nutrition and overall health. Household infrastructure. I. Economic transformation for the betterment of all Effectiveness of the labor force. Domestic investment in innovation. Competitiveness in the global information economy.
28 Rupee H1. Per Capita Net State Domestic Product (NSDP) at constant prices 60,000 Andhra Pradesh Assam Bihar Kerala Rajasthan 50,000 40,000 30,000 20,000 10, Source: Ministry of Statistics and Programme Implementation
29

30 J. Social and economic wellbeing is increasingly sustained over time Change over time in nutrition. Change over time in household infrastructure. Change over time in overall health. K. Greater investments in environmental health and reduced natural resource usage Consumption of clean energy. Water consumption and quality of water. Air pollution Natural resource conservation. L. Decisionmaking processes incorporate long-term costs Sustainable material production and consumption.
31 Percentage change J3. Change in life expectancy by sub-category (2002 to 2014) 14% Andhra Pradesh Assam Bihar Kerala Rajasthan 12% 10% 8% 6% 4% 2% 0% Females Males Rural Urban Source: Ministry of Home Affairs & Office of the Registrar General and Census Commissioner, India.
32

33 M. Public and private confidence in the future and ability to predict outcome of economic decisions Variability in GDP per capita. Sound government policies and regulations. N. Members of society are able to invest in their future Access to banking services. Protection of property rights. Political and civil unrest. O. Economic resilience to shocks and stresses Social security and government public programs. Export diversification. Liquidity of foreign direct investment. Emergency preparedness.
34 Standard deviation M1. Standard deviation of year-to-year GDP growth 0.07 Andhra Pradesh Assam Bihar Kerala Rajasthan Source: Ministry of Statistics and Programme Implementation
35 Rural/Agricultural Indicators Apart from measuring inclusion across all of the five broad categories of the inclusive economies framework, we also analyze patterns of inclusion in the context of rural development in India.

36 Indicators and Data Availability

37 Overall states level of inclusion for all indicators: Source: own calculations *Green values = greater inclusion. **Red values = less inclusion. ***Bolded indicators indicate that higher values mean less inclusion.
38 Discussion, Questions When you think about inclusion in India, what are important factors, and are they included in our sub-categories? What is missing? What are the lessons that people in other parts of the globe could and should learn from India s experience with inclusiveness?
39 Small Group Discussions Sustainability: How do you think the category and subcategories of sustainability shed new lights on issues of inclusiveness in rural economy? Stability: How do you think the category and sub-categories of stability shed new lights on issues inclusiveness in rural economy? Participation: How do you think the category and sub-categories of participation shed new lights on issues inclusiveness in rural economy? Actors and Processes: Who do you think are the main actors (state, civil society, market) in shaping inclusiveness in rural economy and what has been their relative importance?
40 Discussions around key questions 1. Empirical: How can this framework help us better understand causes and patterns of inequalities within & between different states in India? 2. Linkages: How do the different dimensions relate to each other, and to an inclusive economy? What trade-offs exist across dimensions? Are there ones that are more important than others? 3. Practice: How can measuring inclusiveness help promote a more inclusive economy? Who would use these indicators and how could they be used? 4. India Lessons: What are the lessons that people in other parts of the globe could and should learn from India s experience with inclusiveness? What unique challenges does India face? What successes have been achieved?
41 Final Discussion-Next Steps What value added emerges from this broad framework? Who could be the audience for this work? How does it relate to other efforts to understand inclusive economies across the globe? How can we best disseminate our learnings from this work to a broader audience? What would be useful final products? What processes for furthering discussions about inclusive economies would be useful to pursue?