SURVEY REPORT WORKFORCE PARTICIPATION MAY Page 1 of 35. Policy Adviser. Jonathan Russell
|
|
|
- Helena Casey
- 5 years ago
- Views:
Transcription

1 SURVEY REPORT WORKFORCE PARTICIPATION MAY 2011 Jonathan Russell Policy Adviser Consult Australia Level 6, 50 Clarence Street Sydney NSW 2000 P F E. Page 1 of 35 W.


2 CONTENTS Part 1: Part 2: Part 3: Part 4: Annex A: Annex B: Executive summary Introduction Background Objective of the survey Survey questions Respondents Survey results Career stream 1: Corporate leadership Career stream 2: Professional services staff Career stream 3: Corporate & support services staff Parental leave and attraction initiatives Results for small and medium sized firms Introduction Career stream 1: Corporate leadership Career stream 2: Professional services staff Career stream 3: Corporate & support services staff Comparison with other professional services Survey questions Page 2 of 35
3 PART 1 Executive Summary The Workforce Participation survey was conducted by Consult Australia to help assist member firms develop practices to promote the employment and retention of women. The survey represents data for 15,739 employees. The focus of the survey was on the differences between the level of participation of women and the makeup of the female and male workforces in terms of age, wage, seniority and voluntary turnover rates. The report indicates that there are noticeable differences between the level of participation of men and women in firms in the built and natural environment. 1.1 Headline results Pay inequity and the ratio of genders are the most obvious differentiators between men and women working at the same level of seniority in the same career stream. Below are the headline findings for the three surveyed career streams and parental leave and attraction initiatives: Career stream 1: Corporate leadership Eleven per cent of Board members are women. Thirty three per cent of Female Board members work part time. The percentage of women drops by half from 13 per cent to six per cent from 1 st Level to 3 rd level Manager. The survey results indicate that women are paid up to six per cent less than men. Women are usually three to four years younger than their male colleagues and have spent between three to four years less with their employer. Female First and Second level managers are three to six times more likely than men to work part time. Voluntary turnover rates for women are twice as high as for men at the 1 st and 2 nd Level managers, and more than four times as high for 3 rd Level managers. Career stream 2: Professional service providers The proportion of women is 29, 30 and 27 per cent for the three junior levels (average female ages 25-33), and drops to 16 and 11 per cent for the Senior and Principal levels (average female ages 38-44). Female Graduates earn two per cent more than men but between three and nine per cent less at the Associate/Junior, Proficient and Senior levels. Principal level women earn one per cent less than men at the same level. Women at the Senior and Proficient levels are an average of three to four younger than men at the same levels and have spent an average of just one year less time with their employer. Women are more likely to work part time and their rate of usage increases steadily over time. Just two to four percent of men work part time except for those at the Proficient level with an average age of 33 years, at which moment 11 per cent of men work part time. Turnover rates for men and women are very similar and reduce as seniority increases from about per cent for Graduates, down to per cent for Principal level staff. Career stream 3: Corporate & support services staff The gender balance for corporate and support services staff is much more even, with a 49 per cent women to 51 per cent men split at the Senior level and a relatively small percentage decrease for female participation (44 per cent) at the Principal level. Page 3 of 35
4 On average, the data suggests that men in this career stream earn 20 or 22 per cent more than women. This difference is far greater than that experienced in corporate leadership and professional services career streams. Women at the Principal level are an average of five years younger than their male colleagues and have been with their employer for an average of four fewer years. Women are more likely than men to work part time, but less likely than women in other career streams. Although the percentage of men who utilise part time working arrangements is low compared to women, at four to seven per cent it is a higher number than for men in other surveyed career streams. The level of turnover for women at the Senior level is two per cent lower than for men, but at the Principal level it is four per cent higher. Parental leave and attraction initiatives Forty five per cent of respondent firms offer more than the minimum parental leave provisions required by legislation. This figure increases to 73 per cent if only large firms (which employ 96 per cent of surveyed staff) are considered. Eighty two per cent of all firms provide flexible working arrangements, but none have quotas for the number of women in leadership positions. The survey also showed that parents who take parental leave are very likely to return to their employer at the end of the leave period. Fifty two per cent of respondent firms offer more than the minimum parental leave provisions required by legislation. This figure increases to 75 per cent if only large firms (which employ 96 per cent of surveyed staff) are considered. Page 4 of 35
5 PART 2 INTRODUCTION 2.1 Background When looking at the skills shortage in the built and natural environment a common question is, "why aren't more women involved?" At a meeting of the Consult Australia Skills Roundtable, it was agreed that statistics are needed to support new initiatives to attract and retain women to consulting firms. Members called for a survey to measure the extent to which women are represented in Consult Australia firms, with a focus on technical and managerial roles. 2.2 Objective of the survey The objective of the survey is to provide quantitative data to identify areas in the careers of female employees which may require greater attention to ensure that they are not lost by industry. The survey identifies differences in pay, turnover, age at seniority levels etc, thus indicating where further work should be directed. The survey has a focus on women in corporate leadership positions, those who provide professional services, and senior corporate & support services staff. Professional service providers in Consult Australia member firms are often engineers, scientists and technicians, but may also include, among others, project management consultants, surveyors, architects or economic advisors. Only the senior levels of the corporate & support services career stream were surveyed because the Consult Australia Skills Roundtable assumed that employment equity issues were less of an issue in this career stream. The survey results indicate that a broader analysis of the full corporate & support services career stream would improve the data. Although focussed on an acknowledged need to attract and retain more women to the industry, by virtue of being a comparison of the female and male workforces, the data also provide an opportunity to identify issues that may be of concern to the whole workforce. 2.3 Survey questions A copy of the full text for the survey questions is at Annex A. The survey was split into three sections and measured data for three different career streams at several levels of seniority. The three career streams and levels of seniority are described in Table 1 (see Table 2 for definitions): Table 1: Three career streams and their levels of seniority Career stream 1: Corporate leadership Career stream 2: Professional services Career stream 3: Corporate and support services Member of the Board Principal Principal Third level (or executive) Senior Senior manager Second level (or senior) Proficient manager First level manager Associate/ junior Graduate Section 1 - Basic statistics: For each level of seniority in each career stream, respondents provided the number of male and female permanent full time and permanent part time employees. Page 5 of 35
6 Respondents also provided their average age, average time in company and average annual full time equivalent pay package. Section 2 - Recruitment and retention: For each level of seniority in each career stream, respondents provided the number of male and female employees who, in the past 12 months, were recruited, resigned, or were dismissed. Section 3 - Parental leave and attraction initiatives: With regard to paid parental leave, respondents indicated if they provided the minimum required by legislation, or the minimum plus extra benefits. Those which provide extra benefits gave details. Respondents indicated how many employees in the past 12 months were expected to return from parental leave, and the number who were expected to return but did not. Finally, a range of initiatives to attract and retain female employees were presented to respondents who indicated those used by their firm. Table 2: Definitions for specialisations and levels of seniority Corporate Leadership Board Third Level (or Executive) Managers Second Level (or Senior) Managers First Level Managers Professional Services Principal Senior Proficient Associate/ Junior Graduate Those who sit on the board of management, are C-suite staff (CEO, CFO etc), act as business unit or regional managers, and operate at the first level of senior management. On the Board of Management. The most senior executive manager, determining strategic direction for the organisation. For example: C-Suite staff such as CEO, CFO, COO, or Senior Executive such as Senior Risk Manager. Nb: do not double-count Third level (or Executive) Managers if they are also a Board member. Provides business/technical leadership and strategic advice. For example: Business unit or Regional Manager (NSW Manager or Manager of Roads) or Division or Market Sector Director (Director of Infrastructure or Director of Human Resource). This level may overlap with level 5 Principal Engineers and Technicians and may represent a dual career ladder. For example: Project Team Leaders/Managers - leaders of projects within business or regional units. All professional service providers including such occupations as engineers, scientists, technicians, project management consultants, surveyors, architects or economic advisors. Reserved for those with skills and abilities of a high order. Will typically be recognised throughout their company as the final word in a specialised area and may be used as a national resource. A senior role that requires specialised abilities. Progression to this level may not be available to all. This is the full career position. Employees are no longer under close supervision or training and operate as, for example, a standard engineer or architect. A transition role where learning and acquisition of practical skills continues. The entry level position with few pre-requisites. Page 6 of 35
7 Corporate & Support Services Principal Senior Those who work in roles such as human resources, communications, IT support, in-house legal counsel or marketing. Reserved for those with skills and abilities of a high order. Will typically be recognised throughout their company as the final word in a specialised area and may be used as a national resource. A senior role that requires specialised abilities. Progression to this level may not be available to all. 2.4 Respondents The survey was open for two months over December 2010 and January 2011, and the survey results represent the participation of 15,739 permanent full time and part time employees in 22 member firms (13 Large, 5 medium & 4 small). The majority of employees represented in the survey (96 per cent) work in large firms. Box 1: Small, medium and large classification for the survey The Australian Bureau of Statistics standard definition of business size has been used in this survey: Small businesses: Medium businesses: Large businesses: employment of 1-19 persons employment of persons employment of 200 or more persons The collective survey results are shown graphically in this report and are not separated for small/medium and large firms. The differences between the small/medium and large firms are usually quite small and any significant variations are noted in the text. The headline differences are described in Part 3. Page 7 of 35
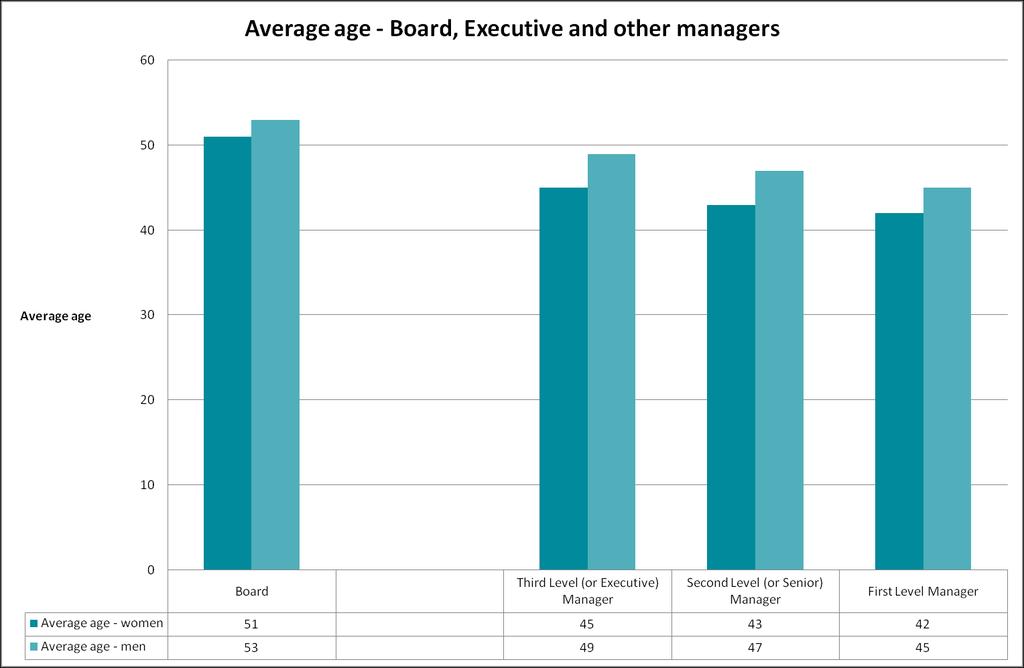
8 PART 3 SURVEY RESULTS 3.1 Career stream 1: Corporate leadership The figures below illustrate the survey results for 2,023 staff who are Members of the Board, Third level (or executive) managers, Second level (or senior) managers or First level managers. This represents 13 per cent of all staff captured by the survey. Although senior executives can become Board members, or in some companies the Board members and Executive Managers are the same people, progression to Board level is not always linear. Board members can be recruited from outside the industry and can follow a different career path to that of other senior managers. For this reason the survey results for Board members are treated differently to that of other senior managers. Headline results for Board members are: Eleven per cent of Board members are women. The data on pay packages for female Board members has not been included in the survey report. The low number of pay packages for the small number of women Board members that were disclosed means that the data set is not large enough to be of any use. Thirty three per cent of Female Board members work part time. Headline results for other senior managers are: The percentage of women drops by half from 13 per cent to six per cent from 1 st Level to 3 rd level Manager. The survey results indicate that women are paid up to six per cent less than men. Women are usually three to four years younger than their male colleagues and have spent between three to four years less with their employer. Female First and Second level managers are three to six times more likely than men to work part time. Voluntary turnover rates for women are twice as high as for men at the 1 st and 2 nd Level managers, and more than four times as high for 3 rd Level managers. Data analysis Board members Eleven per cent of Board members are female, which is higher than the ASX200 average of 8.3 per cent. 1 Although the overall percentage of women on Boards is low, the survey data shows that most large firms have at least one woman on their Board (or at an Executive Manager level). Women are an average of two years younger than men and have been with their employer for an average of four years less. Of greatest interest is the very high use of part time working arrangements for women (33 per cent), and men on the Board are more likely than Third or Second Level Managers to work part time. The data on pay differences between the genders has not been included due to the very small data source on wages. Until more pay data is made available, this aspect of the survey cannot be used meaningfully. 1 Australian Government, Equal Opportunity for Women in the Workplace Agency, A gender in the boardroom: executive summary, 2008, p12. Available at: p_census/egon%20zehnder/ez%20media%20kit%20materials/exec_summary_lr.pdf Page 8 of 35
9 Data analysis Other senior managers The relatively young average age of women in corporate leadership positions may indicate that although there are few women in senior management roles, their number is being increased with younger candidates who are only now beginning to reach positions of senior leadership. The pay difference between genders appears to be significant, especially at the lower end of executive leadership positions. The women are an average of three to four years younger than men at the same level and have been with their employer for a lesser amount of time, but at these very senior levels for people over 40 years of age one could expect pay to be based on ability to fulfil a role rather than the years of experience that a person brings to the role. That view can be tempered with acknowledgement that the average age of men is drawn higher due to a large number of very experienced men and the average age of women is drawn down due to a relatively large number of younger women who are just emerging into positions of senior leadership. Consult Australia member firms are encouraged to review their own data to determine if a real problem exists. Analysis of the rate of use of part time working arrangements, turnover rates and links to percentages of women in senior leadership follows: Thirteen per cent of female First Level Managers use part time working arrangements and stays at that level for Second Level Managers before dropping to zero for Third Level Managers. Corresponding voluntary turnover rates rise from 13 to 16 to 18 per cent. The percentage of women at these levels also drops by half from 13 per cent for First Level Managers, to nine per cent for Second Level Managers and six percent for Third Level Managers. For men, the use of part time work also drops with seniority (from four to two per cent), while turnover rates decrease from seven to four per cent and the proportion of men relative to women increases. Some explanations for this trend are that corporate leadership roles are less compatible with part time working arrangements, or that part time work inhibits opportunities for promotion. However, a myriad of factors are at play and the data is not comprehensive enough to draw specific conclusions. Industry members are encouraged to investigate the extent to which flexible working arrangements are available and if the management of those arrangements is having on impact on staff turnover and promotion. Page 9 of 35

10 Page 10 of 35

11 Page 11 of 35
12 Page 12 of 35

13 Page 13 of 35
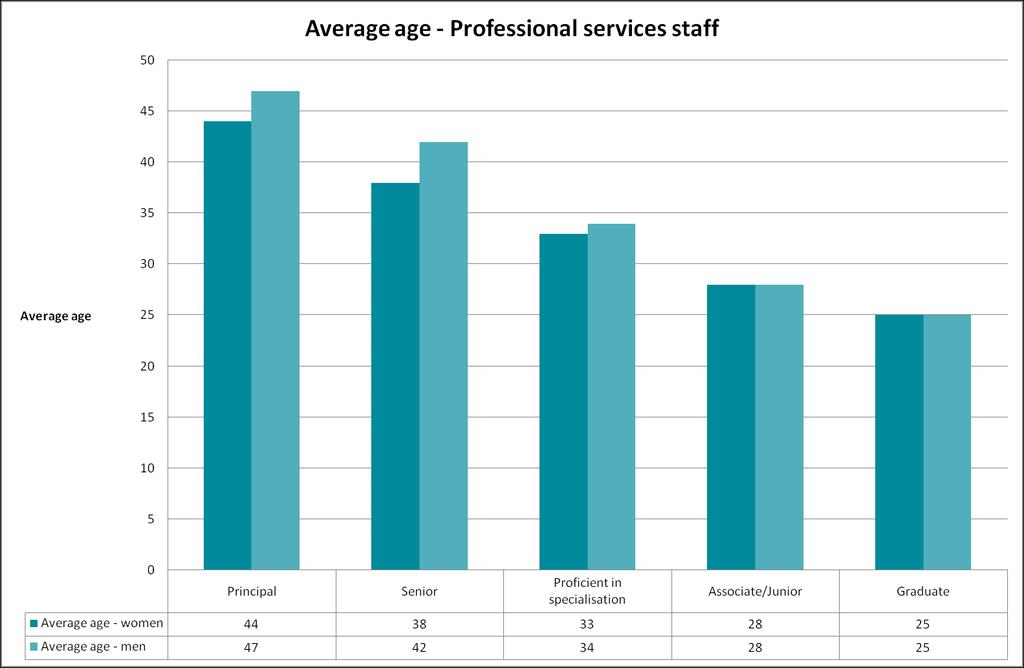
14 3.2 Career stream 2: Professional services staff The figures below illustrate the survey results for 12,850 professional services staff (this represents 82 per cent of all staff captured by the survey). In Consult Australia member firms, this usually means engineering professionals but will also refer to a smaller number of architects, economists and other professional service providers. Headline results are: The proportion of women is 29, 30 and 27 per cent for the three junior levels (average female ages 25-33), and drops to 16 and 11 per cent for the Senior and Principal levels (average female ages 38-44). Female Graduates earn two per cent more than men but between three and nine per cent less at the Associate/Junior, Proficient and Senior levels. Principal level women earn one per cent less than men at the same level. Women at the Senior and Proficient levels are an average of three to four younger than men at the same levels and have spent an average of just one year less time with their employer. Women are more likely to work part time and their rate of usage increases steadily over time. Just two to four percent of men work part time except for those at the Proficient level with an average age of 33 years, at which moment 11 per cent of men work part time. Turnover rates for men and women are very similar and reduce as seniority increases from about per cent for Graduates, down to per cent for Principal level staff. Data analysis - female workforce participation In Consult Australia member firms, it is assumed that the majority of professional services staff is engineers, scientists and related professionals and paraprofessionals. Since 2001, per cent of domestic graduates of Australian engineering and related technology bachelor degrees have been women. 2 This contrasts with the female workforce participation rate of per cent at the junior levels of professional services staff. The percentage of women drops markedly, however, to 16 per cent of all Senior level staff and drops even further to 11 per cent for Principal professional services staff. One contributor to this finding may be that women, as a significant constituency of the industry workforce, are relatively new and those that have made it to the more senior grades are still relatively young. The average ages of men and women are equal or one year apart for the three junior levels of seniority. Women at the Senior and Principal levels are an average of three or four years younger. Again, this may be because women are relatively new to the industry. Data on the use of part time working arrangements shows that women utilise it much more than men (starting at seven per cent of Graduates ), with a jump in use at the Proficient and Senior levels (to 19 and 25 per cent, respectively). That jump corresponds to average ages of years. Men are very unlikely to work part time, with levels usually at two to four per cent. There is a significant spike, however, for men working at the Proficient level with an average age of 34 years when 11 per cent of all men are working part time. The timing of the spike may correspond with the competing demands of child raring. The rate of usage of part time working arrangements for women continues to increase beyond the initial spike, and the rate for men drops rapidly by the time they reach the Senior levels. This also corresponds with a reduction in the proportion of women at those levels. Although it was earlier suggested that the drop in the proportion of women at the senior grades could be due to the 2 Andre Kaspura, The Engineering Profession: A Statistical Overview, 7th edition, 2010, Engineers Australia, p19. Available at: Page 14 of 35
15 relatively recent involvement of women in the industry, other reasons should be considered. One possibility is that utilisation of part time working arrangements prevent staff from being involved in opportunities that fully demonstrate their capabilities. Analysis of the results by a Consult Australia working group suggests that part time workers are often required to work on less interesting projects due to a perception that the project worker must be available to clients at all times. This has the effect of not providing opportunities for part time workers to shine. Turnover rates for women are either equal to or just one or two per cent higher than that experienced by men at all levels. Data analysis - differences in remuneration and progression Female Graduates earn an average of two per cent ($1,304) more than male Graduates. From the Associate/ junior levels, men earn more starting as a three per cent ($1,980) difference at the Associate level. It reaches a peak of nine per cent ($10,512) more for men at the Senior level. The survey results show, however, that men and women at the three junior grades are of a roughly equal average age and they have been with their employers for an equal average number of years. The pay differences for these staff are therefore significant and companies could take steps to determine the causes and ensure that pay packages are awarded equitably. The pay differences at the Senior and Principal grades could be caused by a wide set of factors, but do also warrant further examination because, though it could be argued that those with more experience might receive more, the men have, on average, only slightly more experience based on age and time in their firm. As previously noted, it may be that the average age of men in Senior and Principal grades is higher, based on historically low levels of women in the industry, thereby pushing up relative wages. Page 15 of 35

16 Page 16 of 35

17 Page 17 of 35

18 Page 18 of 35
19 Page 19 of 35
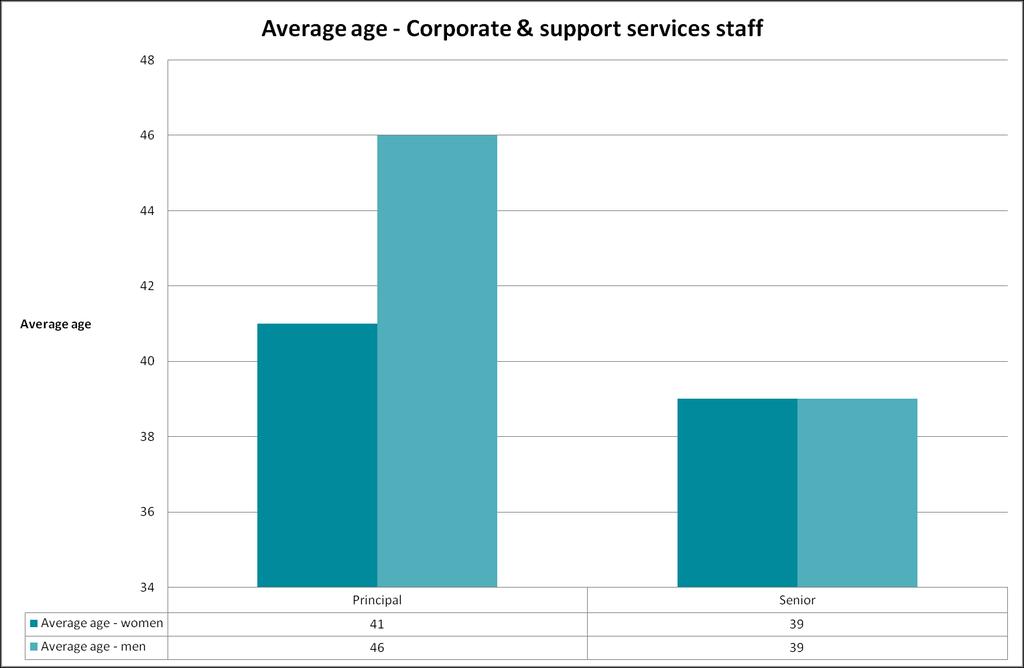
20 3.3 Career stream 3: Corporate and support services staff The figures below illustrate the survey results for 866 corporate and support services staff (this represents six per cent of all staff captured by the survey). In Consult Australia member firms, this usually includes human resources, communications, IT support, in-house legal counsel or marketing staff. In contrast to the survey for professional services staff, only the upper levels of Senior and Principal staff were surveyed. It should be noted that the many professions included in this section of the survey may have their own profession-specific issues with regard to the participation of men and women, differences in pay or promotion. Headline results are: The gender balance for corporate and support services staff is much more even, with a 49 per cent women to 51 per cent men split at the Senior level and a relatively small percentage decrease for female participation (44 per cent) at the Principal level. On average, the data suggests that men in this career stream earn 20 or 22 per cent more than women. This difference is far greater than that experienced in corporate leadership and professional services career streams. Women at the Principal level are an average of five years younger than their male colleagues and have been with their employer for an average of four fewer years. Women are more likely than men to work part time, but less likely than women in other career streams. Although the percentage of men who utilise part time working arrangements is low compared to women, at four to seven per cent it is a higher number than for men in other surveyed career streams. The level of turnover for women at the Senior level is two per cent lower than for men, but at the Principal level it is four per cent higher. Data analysis pay differences and part time working A popular hypothesis is that women in this career stream outnumber men and that there is less difference in the average full time equivalent pay packages, and that the use of part time working arrangements would be higher. This has been shown by the survey data to be unfounded, with the exception that men in this career stream are more likely than men in other surveyed careers to work part time. Women make up almost half of the workforce at the Senior grade but drop to 44 per cent at the Principal level. The data suggests that men earn significantly more than women at equal levels of seniority. On average, men at the Senior level earn 20 per cent ($23,172) more than women, and 22 per cent ($35,661) more at the Principal level. The average age and time in company differences at the Senior level are negligible. At the Principal level, women are an average of five years younger and have been with the employer for an average of four years less, but it would be difficult to attribute the 22 per cent pay difference to those factors. Women who work in corporate and support services are more likely than men to work part time, but they are less likely to use it than women at the same level of seniority in the professional services career stream. The average turnover rates for women are one per cent lower than that experienced by women at the same level of seniority in the professional services career stream. The survey data in this career stream is limited by the focus on Senior and Principal level staff and the relatively small numbers of staff involved in this career stream. The survey results are, however, noteworthy and Consult Australia members could make further investigations to measure the extent to which the survey results are reflected in their firms. Page 20 of 35

21 Page 21 of 35

22 Page 22 of 35


23 Page 23 of 35

24 Page 24 of 35
25 3.4 Parental leave and attraction initiatives Survey results for parental leave and attraction initiatives are not specific to career streams but represent the member firms general approach. Parental leave provisions Fifty two per cent of respondent firms offer more than the minimum parental leave provisions required by legislation. This figure increases to 75 per cent if only large firms (which employ 96 per cent of surveyed staff) are considered. Information on minimum parental leave and related entitlements is available from the Fair Work Ombudsman ( Information on the Commonwealth Paid Parental Leave scheme is available from the Family Assistance Office ( Consult Australia members may also refer to Practice Note 5.13: Commonwealth Paid Parental Leave Scheme ( The widespread use of generous paid parental leave provisions, especially by large firms, is positive. The following are examples of what is provided by respondent firms that provide more than the statutory minimum for parental leave. Paid leave is at the full normal rate of pay (unless otherwise indicated). Twelve weeks paid leave for the primary carer plus five days paid to partner. Twelve weeks paid leave for the primary carer for those with 12 months plus service. Twelve weeks paid maternity leave at 75 per cent of full time salary. Twelve weeks paid parental leave, at full salary plus a lump sum equal to four weeks of pay upon return from leave (paid after employee has returned and remained at work for 3 months). Also provide male staff (who are not primary carers) access to 10 days of accrued personal leave at the birth of their child. (This firm is looking at changing the structure of company policy to 'primary carer' and 'secondary carer' leave, as opposed to maternity and paternity leave.) Eight weeks paid parental leave. Up to eight weeks paid maternity leave. Six weeks maternity leave, two weeks paternity leave and additional weeks based on tenure; one week for every two years of service capped at four weeks. Six weeks paid leave for the primary care giver. Higher rates of pay than required by regulation. After one to two years of service: six weeks paid leave, with 50 per cent paid at the start and 50 per cent on return. More than two years of service: 12 weeks paid leave, with 50 per cent paid at the start and 50 per cent on return. Rates of return to work for parents on parental leave Eighty nine per cent of those employees who were expected to return from parental leave in the past year, did return to work. In small firms, 100 per cent of such employees returned to work as intended. Initiatives to attract and retain female employees Survey respondents were asked: Which of the following tools does your company use to attract and retain female employees? Page 25 of 35
26 a. Guaranteed interview for female job applicants (if essential criteria are met). b. At least one female on an interview shortlist (if a female who meets all essential criteria applies). c. Quotas for women in management positions. d. Development programs for women. e. Flexible working arrangements are provided. The results are presented in the below figure and illustrate some differences between the approaches of small/medium and large firms. For example, no large firms provide a guarantee that eligible female job applicants will receive an interview offer. By contrast, larger firms are more likely to have development programs for women. The introduction of quotas for the number of women in management roles is receiving more interest in the wider Australia industry, but no firms in this survey have introduced such measures. Page 26 of 35
27 PART 4 RESULTS VARIATIONS FOR SMALL AND MEDIUM SIZED FIRMS AGAINST LARGE FIRMS 4.1 Introduction The number of small and medium firm employees captured by the survey (560) is relatively small when compared to the numbers who work in large firms (15,179) but some trends are nevertheless evident. The following paragraphs highlight notable differences between the survey results for small and medium, and large firms. 4.2 Career stream 1: Corporate leadership The greatest difference between small/medium firms and large firms is in salary. For example, men s salaries in large firms are larger than those in small and medium firms by 20 per cent for 1 st level managers, up to almost 80per cent for third level managers. In small and medium firms, the percentage difference between men s and women s salaries is variable at one, two or 18 per cent. The data for female pay packages should be treated with caution due to a small number of women in corporate leadership positions included in the survey data. The average turnover for corporate leadership staff in small and medium firms is much lower than the average for large firms. The turnover rate of surveyed women in small and medium firms is zero, compared with per cent in large firms (and zero for large firm female Board members). The rate ranges from zero to three per cent for men (compared with five to 10 per cent in large firms). 4.3 Career stream 2: Professional services staff The percentage of women in small and medium firms ranges from per cent at the Graduate, Associate/Junior and Proficient grades. It drops to 13 per cent and zero for Senior and Principal. This is lower than is seen in large firms which have rates of per cent at the junior grades and 16 and 11 per cent at the senior grades. Salaries for professional services staff in small and medium firms are lower than for those in large firms, but by a much less dramatic rate than is experienced by corporate leadership staff. The difference between pay packages of men and women in small and medium firms is more pronounced in small and medium firms. The percentage more earned by men is as follows: Level of seniority: Sm/mdm% (large firm%) Graduate: 8% (-4%) Associate/Junior: 12% (1%) Proficient: 11% (5%) Senior: 21% (7%) Principal: na (6%) Both men and women in small and medium firms are an average of three to eight years younger at all levels of seniority when compared to their male/female peers in large firms. Similar to the results for all respondents, in small and medium firms women at the Senior level are an average of three years younger than their male colleagues. Part time working arrangements are utilised far less in small and medium firms. In large firms there is a spike in usage among men at the Proficient level, at an average age of 33 years, to 12 per cent. In small and medium firms zero per cent of men at that level of seniority utilise part time working arrangements. Differences in staff turnover between small and medium and large firms are mixed. Notable turnover figures for small and medium firms are: Page 27 of 35
28 Women at the Graduate level have a 33 per cent voluntary turnover rate, compared with 24 per cent in large firms. Men at the Senior level have a rate of 24 per cent, compared with 13 per cent in large firms. Men at the Principal level have a zero voluntary turnover rate, compared with 12 per cent in large firms. 4.4 Career stream 3: Corporate & support services staff Analysis of corporate and support services staff in small and medium firms is perhaps not a useful exercise due to the very low number of individuals involved (14 women and six men). Nevertheless, the survey suggests that Senior level staff in smaller firms are exclusively female, while their proportion drops to 40 per cent at the Principal level. The pay difference for women in smaller firms at the Principal level is very large, with men earning an average of 37 per cent ($54,000) more than women. These figures should be used with caution as none of the surveyed women worked in a company that employed a man in the same role and the difference in pay levels could be simply due to the remuneration offered by individual businesses. In contrast to the results for large firms corporate and support services staff, those in small and medium firms are very likely to work part time, with 40 per cent of Senior level staff and 25 per cent of Principal level staff doing so. Corresponding results in large firms are 12 per cent and 10 per cent. No men in small and medium firms work part time. In large firms, four per cent of male Senior staff and seven per cent of Principal male staff worked part time. There was no voluntary turnover of corporate and support services staff in the surveyed small and medium firms. In large firms, male voluntary turnover ranged from 15 per cent for men at the Senior level and 16 per cent at the Principal level. For women the figures are 13 and 11 per cent. Page 28 of 35
29 Annex A Comparison with other professional services A brief overview of key available statistics for the accountancy and legal professions illustrates some points of similarity and difference with the survey results for Consult Australia members. Statistics available for these professions show why they are often seen as leaders for attracting women to professions that had been male dominated, but there is evidence to suggest that there is still room for improvement on issues such as pay equality. Accountants The Australian Government s website, Job Outlook, 3 shows that the ratio of women to men in accountancy is very even with women making up 49.2 per cent of the overall workforce. It also shows that 12.1 per cent of the workforce is women working part time, and 4.8 per cent are part time working men. Over the past five years, the number of male accountants in the national workforce has grown by 4,100 whereas women have increased in number by 23,200. This is clearly an occupational group that is going through a major demographic shift, with the large numbers of women entering the workforce indicating that the ratio of women in leadership positions can be expected to change. Solicitors Data available from the Law Society of NSW 4 shows that in 1988 the proportion of female solicitors in NSW was 20.2 per cent. Since then, the ratio has increased by one to two percentage points each year so that women now represent 45.9 per cent of the workforce. The bulk of female solicitors in NSW are aged less than 49 years, whereas most men are aged 30 to 59 years. This reflects the fact that the marked increase in numbers of female university law graduates began about 20 years ago. Examination of results for full-time private practitioners by years since admission shows that male incomes are consistently higher than female incomes. For example, the estimated mean income of male solicitors admitted for less than one year is $62,100, compared to $57,100 for females. For those admitted for between one and five years the average income was $88,600 for males and $77,000 for females. At the upper end of experience, men with 30 or more years experience earn an average of $137,900, whilst women earn $106,600. In terms of part time working arrangements, the NSW Law Society survey indicates that 14.9 per cent of solicitors work part time. The gender ratio is similar to that seen in the Consult Australia survey, reflecting a bias towards women (20.7 per cent) being more likely to use flexible working arrangements than men (9.7 per cent). Part time work was more common among respondents over the age of 35, though it drops from 21.3 per cent for those in the age bracket to 19.2 per cent for those aged and 16.9 per cent for those aged over 50 years. 3 Accountants, Job Outlook. Available at: Profile of the Solicitors of NSW, Urbis, for the Law Society of NSW, January Available at: Page 29 of 35
30 Annex B Survey questions Below is a copy of the survey question text as it appeared on the Consult Australia website. Section 1 Basic Statistics Section 1 (Q1 Q11) is the first of three sections. It collects basic statistics of male and female staff operating at various levels of seniority in three distinct functional groups (corporate leadership, professional services staff, corporate & support services staff). You will be asked to provide numbers of permanent full time and permanent part time staff, plus their average ages, wages and time in your company. Section 1 (page 1 of 3): Corporate Leadership Corporate Leadership staff are those who sit on the board of management, are C-suite staff (CEO, CFO etc), act as business unit or regional managers, and operate at the first level of senior management. Q1. Members of the Board This series of questions relates to staff who sit on the Board of Management. a. Female - permanent full time b. Female - permanent part time c. Female - average age d. Female - average time in company e. Female - average FTE pay package f. Male - permanent full time g. Male - permanent part time h. Male - average age i. Male - average time in company j. Male - average FTE pay package Q2. Third Level (or Executive) Managers These are the most senior executive managers, determining strategic direction for the organisation. For example: C-Suite staff such as CEO, CFO, COO, or Senior Executives such as Senior Risk Manager. a. Female - permanent full time b. Female - permanent part time c. Female - average age d. Female - average time in company e. Female - average FTE pay package f. Male - permanent full time g. Male - permanent part time h. Male - average age i. Male - average time in company j. Male - average FTE pay package Q3. Second Level (or Senior) Managers Providers of business/technical leadership and strategic advice. For example: Business unit or Regional Manager (NSW Manager or Manager of Roads) or Division or Market Sector Director (Director of Infrastructure or Director of Human Resource). a. Female - permanent full time b. Female - permanent part time c. Female - average age d. Female - average time in company e. Female - average FTE pay package f. Male - permanent full time g. Male - permanent part time h. Male - average age i. Male - average time in company j. Male - average FTE pay package Page 30 of 35
31 Q4. First Level Managers This level of staff may overlap with Principal level staff in the Professional services or Corporate & Support Services functional groups, and may represent a dual career ladder. For example: Project Team Leaders/Managers leaders of projects within business or regional units. a. Female - permanent full time b. Female - permanent part time c. Female - average age d. Female - average time in company e. Female - average FTE pay package f. Male - permanent full time g. Male - permanent part time h. Male - average age i. Male - average time in company j. Male - average FTE pay package Section 1 (page 2 of 3): Professional Services Professional Services staff include all professional service providers including such occupations as engineers, scientists, technicians, project management consultants, surveyors, architects or economic advisors. Q5. Principal This level is reserved for those with the skills and abilities of a high order. They will typically be recognised throughout their company as the final word in a specialised area and may be used as a national resource. a. Female - permanent full time b. Female - permanent part time c. Female - average age d. Female - average time in company e. Female - average FTE pay package f. Male - permanent full time g. Male - permanent part time h. Male - average age i. Male - average time in company j. Male - average FTE pay package Q6. Senior Employees at this level have specialised abilities. Progression to this level may not be available to all. a. Female - permanent full time b. Female - permanent part time c. Female - average age d. Female - average time in company e. Female - average FTE pay package f. Male - permanent full time g. Male - permanent part time h. Male - average age i. Male - average time in company j. Male - average FTE pay package Q7. Proficient This is the full career position. Employees are no longer under close supervision or training and operate as, for example, a standard engineer or architect. a. Female - permanent full time b. Female - permanent part time c. Female - average age d. Female - average time in company e. Female - average FTE pay package f. Male - permanent full time g. Male - permanent part time h. Male - average age i. Male - average time in company j. Male - average FTE pay package Page 31 of 35
32 Q8. Associate/ Junior This is a transition role where learning and acquisition of practical skills continues. a. Female - permanent full time b. Female - permanent part time c. Female - average age d. Female - average time in company e. Female - average FTE pay package f. Male - permanent full time g. Male - permanent part time h. Male - average age i. Male - average time in company j. Male - average FTE pay package Q9.Graduate This is the entry level position with few pre-requisites. a. Female - permanent full time b. Female - permanent part time c. Female - average age d. Female - average time in company e. Female - average FTE pay package f. Male - permanent full time g. Male - permanent part time h. Male - average age i. Male - average time in company j. Male - average FTE pay package Section 1 (page 3 of 3): Corporate & Support Services Corporate & Support Services staff are those who work in roles such as human resources, communications, IT support, in-house legal counsel or marketing. Only those at the Principal and Senior levels are included in this survey. Q10. Principal This level is reserved for those with the skills and abilities of a high order. They will typically be recognised throughout their company as the final word in a specialised area and may be used as a national resource. a. Female - permanent full time b. Female - permanent part time c. Female - average age d. Female - average time in company e. Female - average FTE pay package f. Male - permanent full time g. Male - permanent part time h. Male - average age i. Male - average time in company j. Male - average FTE pay package Q11. Senior Employees at this level have specialised abilities. Progression to this level may not be available to all. a. Female - permanent full time b. Female - permanent part time c. Female - average age d. Female - average time in company e. Female - average FTE pay package f. Male - permanent full time g. Male - permanent part time h. Male - average age i. Male - average time in company j. Male - average FTE pay package Page 32 of 35
33 Section 2 Recruitment and Retention Section 2 (Q12 Q22) collects recruitment and retention statistics for male and female staff operating at various levels of seniority in three distinct functional groups (corporate leadership, professional services staff, corporate & support services staff). You will be asked to provide numbers of staff that have been recruited in the past 12 months, and the number that have resigned and been dismissed over the same period.. Section 2 (page 1 of 3): Corporate Leadership Corporate Leadership staff are those who sit on the board of management, are C-suite staff (CEO, CFO etc), act as business unit or regional managers, and operate at the first level of senior management. Q12. Members of the Board This series of questions relates to staff who sit on the Board of Management. a. Female - recruited in past 12 months b. Female - resigned in past 12 months c. Female - dismissed in past 12 months d. Male - recruited in past 12 months e. Male - resigned in past 12 months f. Male - dismissed in past 12 months Q13. Third Level (or Executive) Managers These are the most senior executive managers, determining strategic direction for the organisation. For example: C-Suite staff such as CEO, CFO, COO, or Senior Executives such as Senior Risk Manager. a. Female - recruited in past 12 months b. Female - resigned in past 12 months c. Female - dismissed in past 12 months d. Male - recruited in past 12 months e. Male - resigned in past 12 months f. Male - dismissed in past 12 months Q14. Second Level (or Senior) Managers Providers of business/technical leadership and strategic advice. For example: Business unit or Regional Manager (NSW Manager or Manager of Roads) or Division or Market Sector Director (Director of Infrastructure or Director of Human Resource). a. Female - recruited in past 12 months b. Female - resigned in past 12 months c. Female - dismissed in past 12 months d. Male - recruited in past 12 months e. Male - resigned in past 12 months f. Male - dismissed in past 12 months Q15. First Level Managers This level of staff may overlap with Principal level staff in the Professional services or Corporate & Support Services functional groups, and may represent a dual career ladder. For example: Project Team Leaders/Managers leaders of projects within business or regional units. a. Female - recruited in past 12 months b. Female - resigned in past 12 months c. Female - dismissed in past 12 months d. Male - recruited in past 12 months e. Male - resigned in past 12 months f. Male - dismissed in past 12 months Section 2 (page 2 of 3): Professional Services Professional Services staff include all professional service providers including such occupations as engineers, scientists, technicians, project management consultants, surveyors, architects or economic advisors. Page 33 of 35
34 Q16. Principal This level is reserved for those with the skills and abilities of a high order. They will typically be recognised throughout their company as the final word in a specialised area and may be used as a national resource. a. Female - recruited in past 12 months b. Female - resigned in past 12 months c. Female - dismissed in past 12 months d. Male - recruited in past 12 months e. Male - resigned in past 12 months f. Male - dismissed in past 12 months Q17. Senior Employees at this level have specialised abilities. Progression to this level may not be available to all. a. Female - recruited in past 12 months b. Female - resigned in past 12 months c. Female - dismissed in past 12 months d. Male - recruited in past 12 months e. Male - resigned in past 12 months f. Male - dismissed in past 12 months Q18. Proficient This is the full career position. Employees are no longer under close supervision or training and operate as, for example, a standard engineer or architect. a. Female - recruited in past 12 months b. Female - resigned in past 12 months c. Female - dismissed in past 12 months d. Male - recruited in past 12 months e. Male - resigned in past 12 months f. Male - dismissed in past 12 months Q19. Associate/ Junior This is a transition role where learning and acquisition of practical skills continues. a. Female - recruited in past 12 months b. Female - resigned in past 12 months c. Female - dismissed in past 12 months d. Male - recruited in past 12 months e. Male - resigned in past 12 months f. Male - dismissed in past 12 months Q20.Graduate This is the entry level position with few pre-requisites. a. Female - recruited in past 12 months b. Female - resigned in past 12 months c. Female - dismissed in past 12 months d. Male - recruited in past 12 months e. Male - resigned in past 12 months f. Male - dismissed in past 12 months Section 2 (page 3 of 3): Corporate & Support Services Corporate & Support Services staff are those who work in roles such as human resources, communications, IT support, in-house legal counsel or marketing. Only those at the Principal and Senior levels are included in this survey. Q21. Principal This level is reserved for those with the skills and abilities of a high order. They will typically be recognised throughout their company as the final word in a specialised area and may be used as a national resource. a. Female - recruited in past 12 months b. Female - resigned in past 12 months c. Female - dismissed in past 12 months d. Male - recruited in past 12 months e. Male - resigned in past 12 months f. Male - dismissed in past 12 months Page 34 of 35