DHANALAKSHMI COLLEGE OF ENGINEERING DEPARTMENT OF MECHANICAL ENGINEERING GE 6757 TOTAL QUALITY MANAGEMENT. Unit-IV TOOLS AND TECHNIQUES II
|
|
|
- Audrey Harmon
- 5 years ago
- Views:
Transcription
1 1 DHANALAKSHMI COLLEGE OF ENGINEERING DEPARTMENT OF MECHANICAL ENGINEERING GE 6757 TOTAL QUALITY MANAGEMENT Unit-IV TOOLS AND TECHNIQUES II 1. What are the various approaches to improving reliability of a product? A. Standardization, redundancy, over-design, de-rating, design simplification, understanding the physics of failure, burn-in, and Failure Mode and Effect Analysis (FMEA). 2. What is Product Life Characteristics Curve? A. The failure rate curve, called the product life characteristics curve, shows the failure rates (failures per unit time) against time. It is also called as bathtub curve because of its shape. 3. What are the three stages shown on a Product Life Characteristics Curve? A. The curve consists of three distinct stages: Early failure ( infant mortality or debug ), useful life ( normal failure or chance ) and wear out ( old age ) failure. The curve shows that the failure rates are higher at the early and end stages of a product s life and relatively low in between the two extremes. 4. What is the usefulness of the Product Life Characteristics Curve? A. Knowing the product life characteristics curve for a particular product helps engineers predict failure behavior and take suitable decisions. 5. What is the essential feature of Total Productive Maintenance (TPM)? A. TPM is keeping plant and equipment at their highest productive level through cooperation of all areas of the enterprise. TPM brings maintenance into focus as a necessary and vital part of the business. It is not regarded as a non-profit activity. Down time for maintenance is scheduled as an integral part of the manufacturing process. 6. What are the overall goals of TPM (nov/dec 2008)? A. The overall goals of TPM are: Maintaining and improving equipment capacity. Maintaining equipment for life. Using support from all areas of operation. Encouraging inputs from all employees. Using teams for continuous improvement. 7. What are the different ways of classifying maintenance activities? A. Maintenance activities can be classified in various ways: * Planned (or preventive) maintenance vs. Unplanned (or breakdown) maintenance * Preventive maintenance can be sub-classified into Periodic maintenance and Predictive maintenance * Running maintenance vs. Shutdown maintenance * Time-based maintenance vs. Condition-based maintenance 8. What is some performance measures used to assess the success of TPM?
2 A. Mean Time Between Failures (MTBF), Mean Time To Repair (MTTR), Availability (A), Reliability (R), Maintainability (M), Rate efficiency (RE), Speed efficiency (SE), Performance efficiency (PE), Quality rate (Q), and Overall Equipment Efficiency (OEE) What are the eight pillars of TPM? A. The eight pillars of TPM are: [1] 5S, [2] Jishu Hozen (Autonomous Maintenance), [3] Kobetsu Kaizen (KK), [4] Planned Maintenance (PM), [5] Quality Maintenance (QM), [6] Training, [7] Office TPM, and [8] Safety, Health and Environment. 10. What are the three categories of losses identified in TPM? A. (A) Losses that impede equipment efficiency (B) Losses that impede human work efficiency and (C) Losses that impede effective use of production resources. 11. What is Office TPM? A. Office TPM is aimed at improving quality, productivity and efficiency in the administrative functions and identifying and eliminating losses. 12. What is Business Process Reengineering (BPR)? A. The fundamental rethinking and radical redesign of business processes to improve performance dramatically in terms of measures like cost, quality, service, and speed. 13. What are some key requirements for success in BPR implementation? A. The key requirements for success in BPR are: (a) fundamental understanding of processes, (b) creative thinking, and (c) effective use of information technology. 14. Distinguish between Kaizen and BPR. A. Kaizen involves incremental improvements, whereas BPR involves breakthrough improvements. Both are essential for successful implementation of TQM. 15. What are the seven principles of reengineering? A. 1. Organize around outcomes, not tasks, 2. Those who use the output of the process must perform the process, 3. Merge information processing work into the real work that produces the information, 4. Treat geographically dispersed resources as though they are centralized, 5. Link parallel activities instead of integrating their results, 6. Put the decision point where the work is performed, and 7. Capture information once at the source.
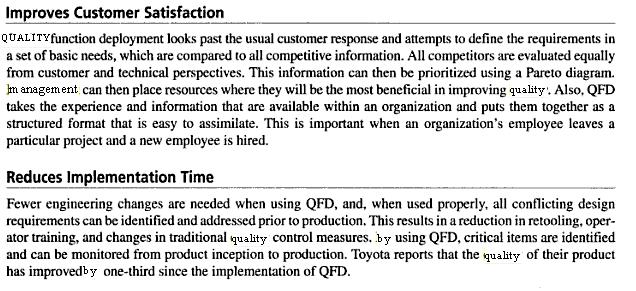
3 3 PART-B 1. Explain about TAGUCHI S QUALITY LOSS FUNCTION. Taguchi s methods are statistical methods developed largely by Genichi Taguchi to improve the quality of manufactured goods Taguchi methods are controversial among many convention western statisticians. Taguchi s principle contributions to statistics are: 1. Taguchi loss function; 2. the philosophy of off-line quality control; and 3. Innovations in the design of experiments. Taguchi loss function: Taguchi defines quality as the loss imparted by the product to society from the time the product is shipped. This loss includes costs to operate, failure to function, maintenance and repair costs, customer dissatisfaction injuries caused by poor design and similar costs. Defective products/ parts that are detected repaired reworked or scrapped before shipment are not considered part of this loss. The essence of the loss function concept is that whenever a product deviates from its target performance it generates a loss to society. This loss is minimum when performance is right on target, but it grows gradually as one deviates from the target. Therefore the loss function philosophy says that for a manufacturer, the best strategy is to produce products as close to the target as possible, rather than aiming at being LOSS FUNCTION: Taguchi has defined quality as the loss imparted to society from the time a product is shipped. Societal losses include failure to meet customer requirements, failure to meet idea performance, and harmful side effects. Many practitioners have included the losses due to production such as raw material energy and labor consumed on unusable products or toxic byproducts. 2. Highlight the benefits of QFD. BENEFITS OF QFD:
4 4

5 5 3. Briefly explain the steps involved in QFD. QUALITY FUNCTION DEVELOPMENT PROCESS: Phase 1: product planning Step1: list customer requirements Step2: List technical descriptors Step3: Develop a relationship between WHATS AND HOWS Step4: Develop a interrelationship matrix between HOWS Step5: Do competitive assessments Step6: Develop prioritized customer requirements Step7: Develop prioritized technical descriptors. Phase 2: part development Step8: Deploy QFD process down to sub-components level both in terms of requirements and characteristics. Step9: Deploy the component deployment chart. Relate the critical sub-component control characteristics. Phase 3: process planning Step10: Develop the relationship between the critical characteristics and process used to create the characteristics Step11: Develop the control plan relating critical control to critical processes. Phase 4: production planning Step 12: Tabulate operating instructions from process requirements Step13: develop prototype and do testing Step14: Launch the final product to the market. 4. Explain each section of the basic structures of house of quality.

6 HOUSE OF QUALITY: The primary planning tool used in QFD is the house of quality. The house of quality converts the voice of the customer into product design characteristics. QFD uses a series of matrix diagrams, also called quality tables, resembles connected houses. Basic structure of house of quality: 1. Customer requirements 2. Prioritized customer requirements 3. Technical descriptors 4. Relationship matrix 5. prioritized technical descriptors 6. Competitive assessments 7. Develop a relationship matrix between WHATS AND HOWS 6
7 7 Constructing the house of quality: Step1: List customer requirements Step2: List technical descriptors Step3: Develop a relationship matrix between HOWS Step4: competitive assessments Step5: Develop prioritized customer requirements Step6: Develop prioritized technical descriptors 5. DISCUSS OBJECTIVES OF QUALITY FUNCTION DEPLOYMENT. Quality function deployment is a systematic and organized approach of taking customer needs and demands into consideration while designing new products and services or while improving the existing products and services. Definition: Quality function deployment may be defined as a system for translating consumer requirements into appropriate requirements at every stage, from research through product design and development, to manufacture, distribution, installation and marketing, sales and service. OBJECTIVES OF QFD: 1. To identify the true voice of the customer and to use this knowledge to develop products which satisfy customers. 2. To help in the organization and analysis of all the pertinent information associated with the project. 3. Quality function development aims at translating the customers voice into product specifications.


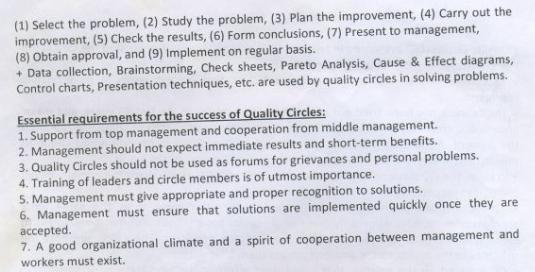
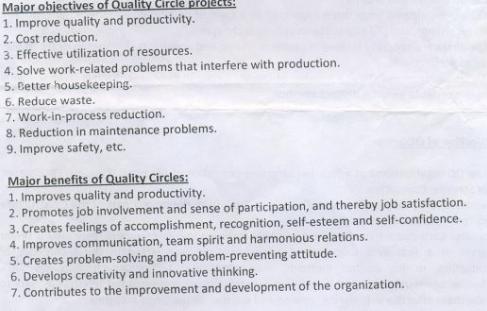
8 6.GIVE DETAILED NOTES ABOUT QUALITY CIRCLE. 8
9 9
10 7.How is house of quality constructed? Explain each section of the basic structure of HFQ and highlights the benefits of QFD. Parts of house of quality: Customer requirements Prioritized customer requirements Technical descriptors Prioritized technical descriptors Relationship between requirements and descriptors Interrelationship between technical descriptors Build a house of quality: List customer requirements List technical descriptors Develop a relationship matrix between WHATs and HOWs Develop an interrelationship matrix between HOWs Competitive assessments Develop prioritized customer requirements Develop prioritized technical descriptors 8. Explain the objectives and concepts of TPM The overall goals of Total Productive Maintenance, which is an extension of TQM are i. Maintaining and improving equipment capacity ii. Maintaining equipment for life iii. Using support from all areas of the operation iv. Encouraging input from all employees v. Using teams for continuous improvement 1 0 Concepts of TPM Promotes the new philosophy Training Management learns the new philosophy Management is funded and developed for everyone in the organization Areas of needed improvement are identified Performance goals are formulated An implementation plan is developed Autonomous work groups are established
11 1 1 9.What are the stages of FMEA? Stages of FMEA Specifying possibilities: a. Functions b. Possible failure modes c. Root causes d. Effects e. Detection/Prevention Quantifying risk: a. Probability of cause b. Severity of effect c. Effectiveness of control to prevent cause d. Risk priority number Correcting high risk causes: a. Prioritizing work b. Detailed action c. Assigning action responsibility d. Check points on completion Revaluation of risk: a. Recalculation of risk priority number 10.What are the different types of FMEA? Design FMEA Process FMEA Equipment FMEA Maintenance FMEA Concept FMEA Service FMEA System FMEA Environment FMEA. 11.What are the concepts of Six Sigma. I] It is regarded as a fresh management strategy, which can replace Quality Control (QC), Total Quality Control (TQC), Total Quality Management (TQM) and others. It is viewed as a 4S approach (Systematic, Scientific, Statistical and Smarter) for the knowledge based information society. II] It provides the base for the manpower cultivation and utilization by employing the belt system and categorizing them as green belt, black belt, master black belt and champion. A person in the company acquires belt according to the training given.
12 III] There are many success stories of successful implementation of six-sigma in world class companies. IV] It provides flexibility in the new millennium of 3Cs, which are Change: Changing Society, Customer: Power is shifted to customer and the customer demand is high, and Competition: Competition in quality & Productivity. 1 2 Critical to quality:attributes most important to the customer Defect:Failing to deliver what the customer wants Process capability: What your process can deliver Variation: What the customer sees and feels Design for six-sigma (DFSS): Designing to meet customer needs and process capability Themes of six sigma are as follows : Genuine focus on the customer Data and fact driven management Process is where the action is Proactive management Boundary less collaboration 12.Explain histogram. Histograms is to determine the spread or variation of a set of data points in a graphical form. It is always a desire to produce things that are equal to their design values. Histograms: A histogram is a tool for summarizing, analyzing, and displaying data. It provides the user with a graphical representation of the amount of variation found in a set of data. Constructing a Histogram: The following are the steps followed in the construction of a histogram: Data collection: To ensure good results, a minimum of 50 data points, or samples, need to be collected Calculate the range of the sample data: The range is the difference between the largest and smallest data points. Range = Largest point - smallest point. Calculate the size of the class interval. The class interval is the width of each class on the X axis. It is calculated by the following formula: Class interval = Range / Number of classes. Calculate the number of data points (frequency) that are in each class. A tally sheet is usually used to find the frequency of data points in each interval. Conclusion: Histogram is simple tools that allow the user to identify and interpret the variation found in a set of data points. It is important to remember that histograms do not give solutions to problems. 13. Explain the organisational structure in quality circles. A Quality Circle has an appropriate organisational structure for its effective and efficient performance. It varies from industry to industry, organisation to organisation. But it is useful to have a basic framework as a model. The structure of a Quality Circle consists of the following elements.
13 1 3 A steering committee: This is at the top of the structure. It is headed by a senior executive and includes representatives from the top management personnel and human resources development people. It establishes policy, plans and directs the program and meets usually once in a month. Co-ordinator: He may be a Personnel or Administrative officer who co-ordinates and supervises the work of the facilitators and administers the programme. Facilitator: He may be a senior supervisory officer. He co-ordiates the works of several quality circles through the Circle leaders. Circle leader: Leaders may be from lowest level workers or Supervisors. A Circle leader organises and conducts Circle activities. Circle members : They may be staff workers. Without circle members the porgramme cannot exist. They are the lifeblood of quality circles. They should attend all meetings as far as possible, offer suggestions and ideas, participate actively in group process, take training seriously with a receptive attitude.the roles of Steering Committee, Co-0rdinator, Facilitator, Circle leader and Circle members are well defined. The Quality Circles also are expected to develop internal leadership, reinforce worker morale and motivation, and encourage a strong sense of teamwork in an organization. A variety of benefits have been attributed to Quality Circles, including higher quality, improved productivity, greater upward flow of information, broader improved worker attitudes, job enrichment, and greater teamwork. 14. Explain Pareto Analysis This fact gave rise to the Pareto effect or Pareto law: the vital few and the trivial many. The Pareto effect is named after Vilfredo Pareto, an economist and sociologist who lived from 1848 to Originally trained as an engineer he was a onetime managing director of a group of coalmines. Pareto analysis is a statistical technique in decision making that is used for selection of a limited number of tasks that produce significant overall effect. It uses the Pareto principle - the idea that by doing 20% of work you can generate 80% of the advantage of doing the entire job. Or in terms of quality improvement, a large majority of problems (80%) are produced by a few key causes (20%). Pareto analysis is a formal technique useful where many possible courses of action are competing for your attention. In essence, the problem-solver estimates the benefit delivered by each action, then selects a number of the most effective actions that deliver a total benefit reasonably close to the maximal possible one. Use of Pareto principle in prioritizing or ranking a range of items which have different levels of significance. Its objective is to separate the 'vital few' from the 'useful many.'