Designing Impactful Data Visualization By Thomas Portolano
|
|
|
- Ella Murphy
- 5 years ago
- Views:
Transcription
1 Designing Impactful Data Visualization By Thomas Portolano 1
2 Workshop agenda A picture is worth a thousand words 3 But not any picture 12 Our ambition 12 Key design elements 20 Dataviz grammar 33 Wrap up 35 2
3 A picture is worth a thousand words
4 When did China s GDP overtake France s? Country China France
5 When did China s GDP overtake France s?
6 Dataviz has become convenient

7 Are danish really that lazy?

8 Is global warming total BS? Average annual global temperature in Fahrenheit ( )

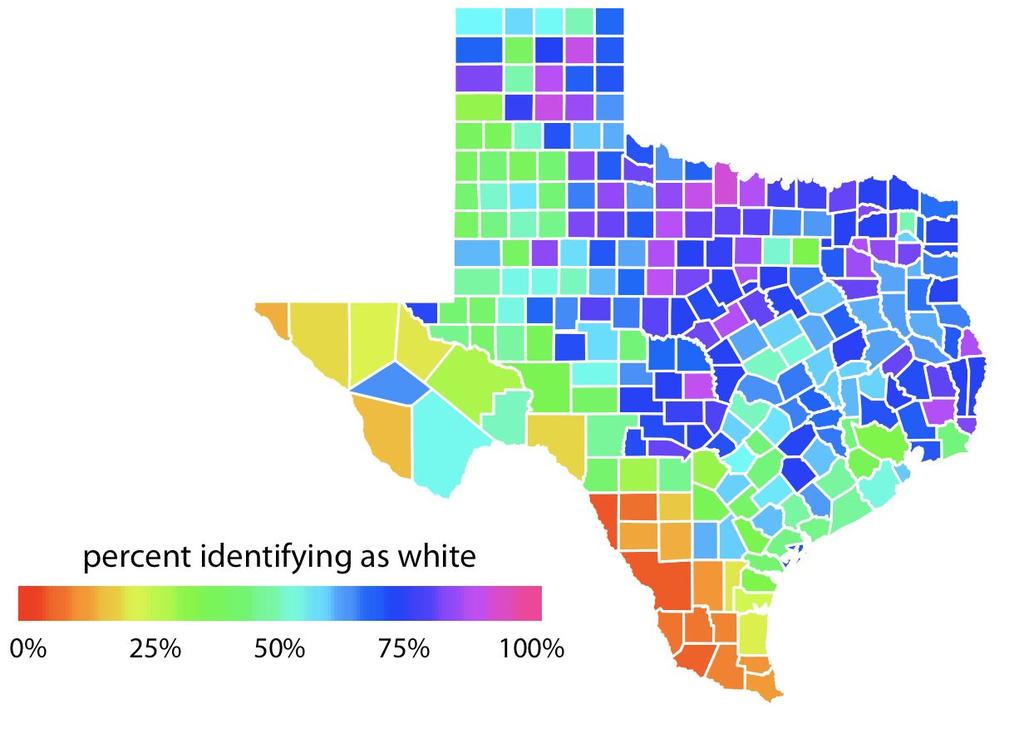
9 Why you shouldn t dribbblify your data viz? Arable land per capita (hectares per person)
 Source: Florida Department of Law")
10 To the risk of misleading your readers Gun deaths in Florida (Number of murders committed using firearms) Source: Florida Department of Law Enforcement
11 Our ambition
12 Initial questions - Is the information conceptual or data driven? - Am I declaring something or exploring something?


13 Conceptual or data-driven What s your material? Thoughts? Qualitative data? Ideas? Statistical and quantitative?
14 Declarative vs Exploratory Analysts can use a dataset to confirm or refute an hypothesis, or communicate a message. In the first case, the key is going fast, iterate, try and refute. In the second, clarity, simplicity and using the correct codes..
15 Practice
16 Know key design principles - Principle of proportional ink - Each type of data is preferably used with a specific plot - Know your grammar and you re already half way there

17 Your toolbox

18 Principle of proportional ink
19 Colors
20 Data ink ratio
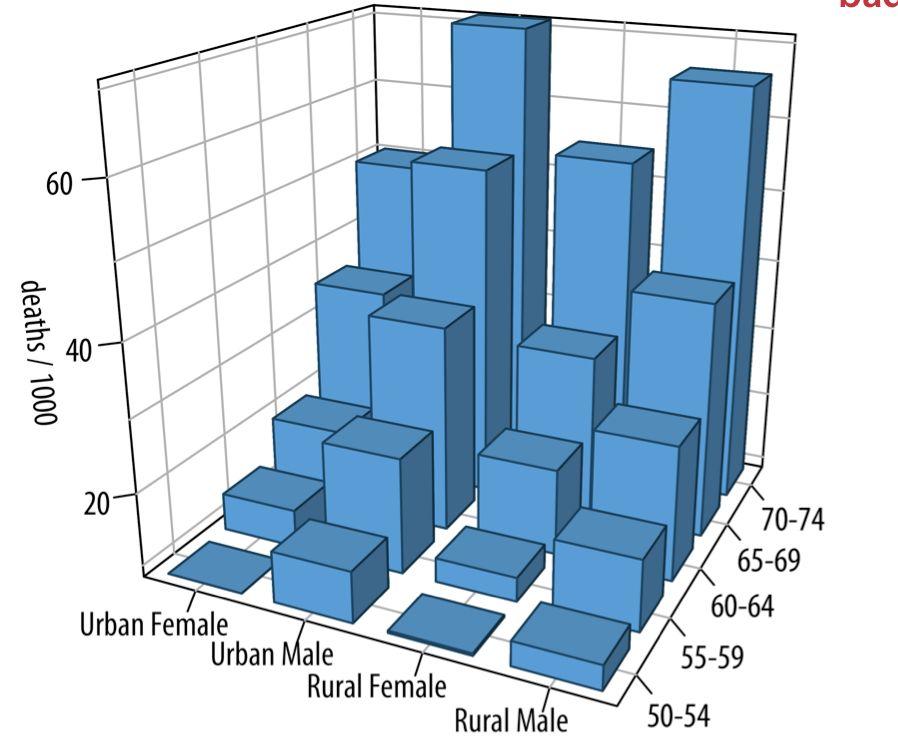
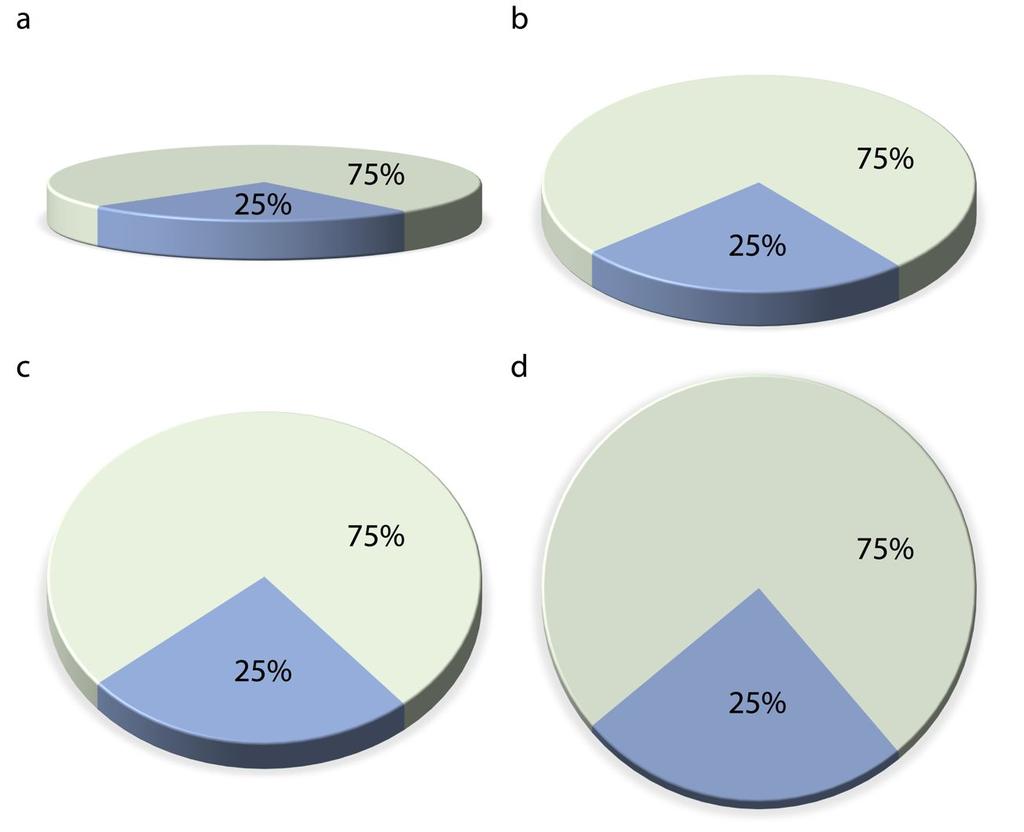
21 Avoid 3D
22 Know your grammar - Data visualization is a language - For maximal impact, better to follow conventions - Know your grammar and you re already half way there

23 Amounts - Bar plot (horizontal or vertical) - Grouped bars - Stacked charts - Gather charts per category serves a better purpose - Dot plots
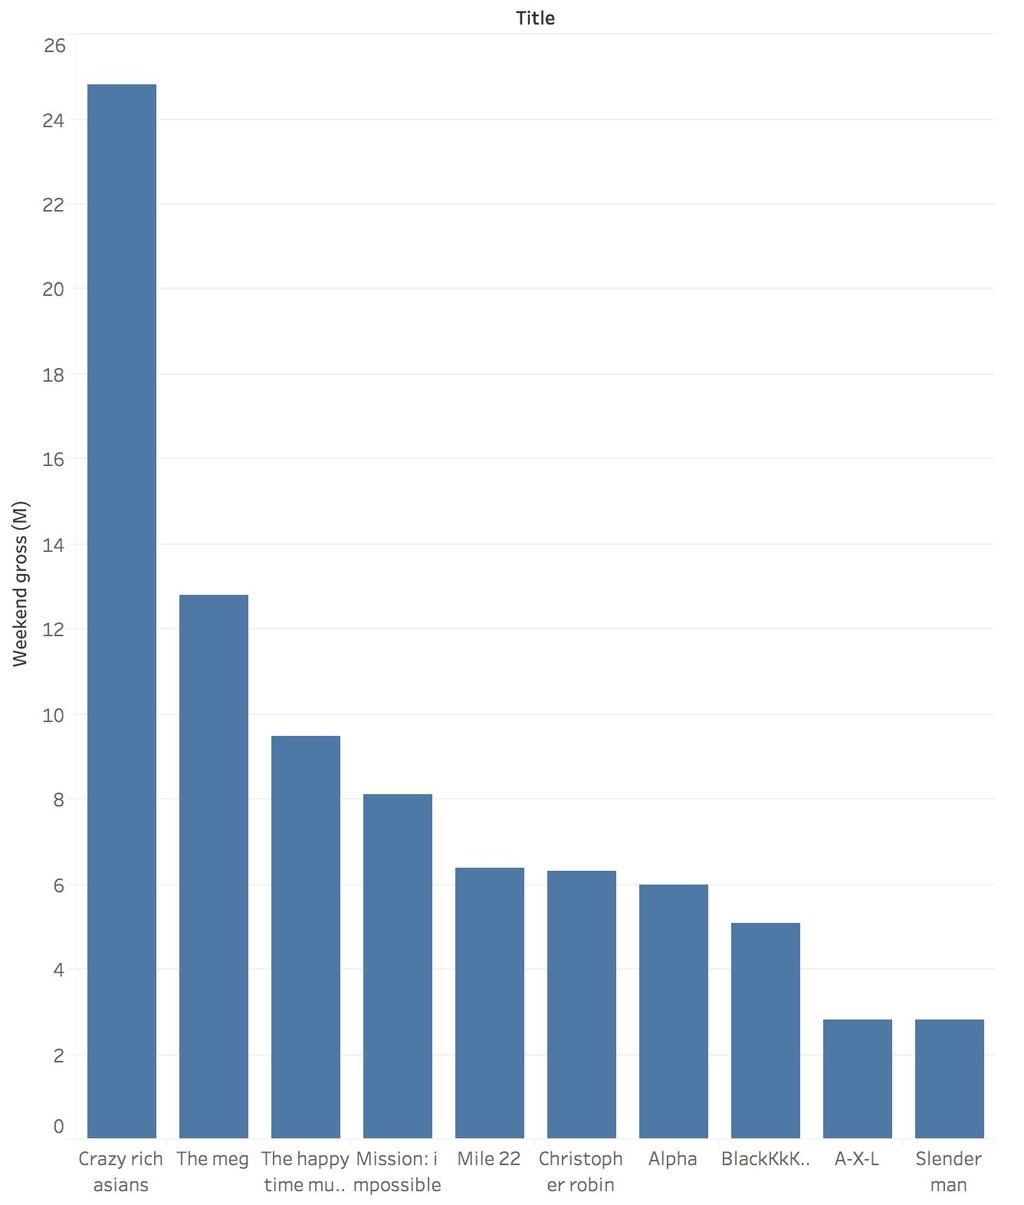
24 Bar chart
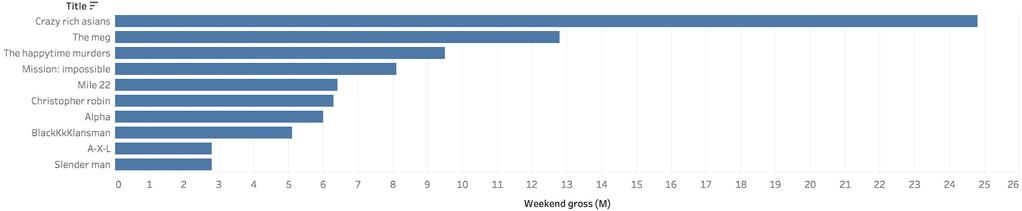
25 Horizontal bar chart

26 Grouped chart
27 Dot plot

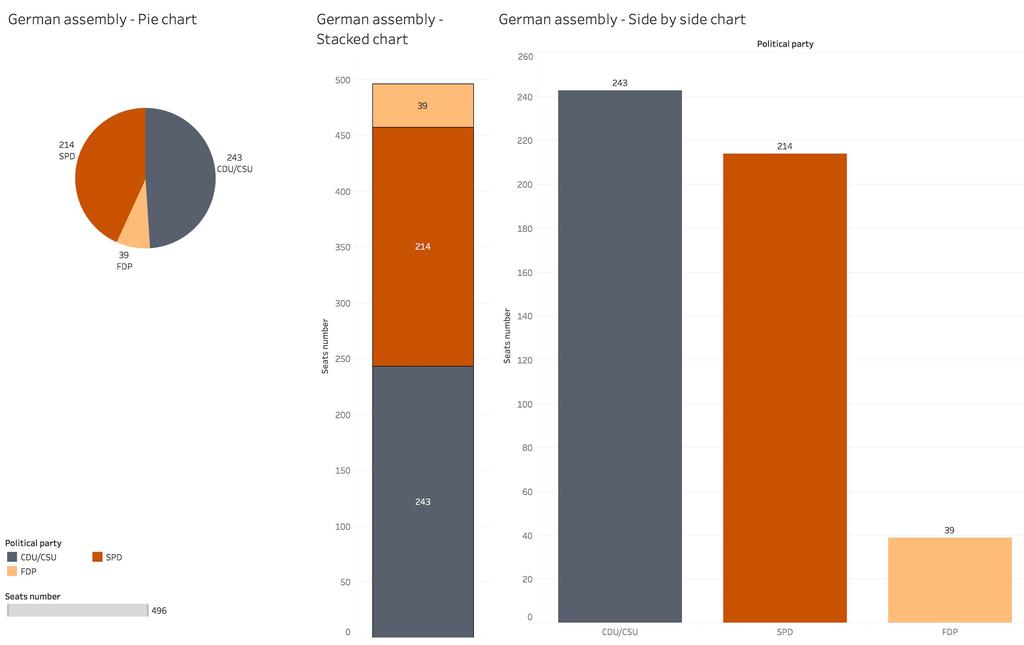
28 Proportion - Pie charts - Stacked bars - Side by side bars - More advanced proportion visualizations
29
30 Pie chart

31 Stacked bars

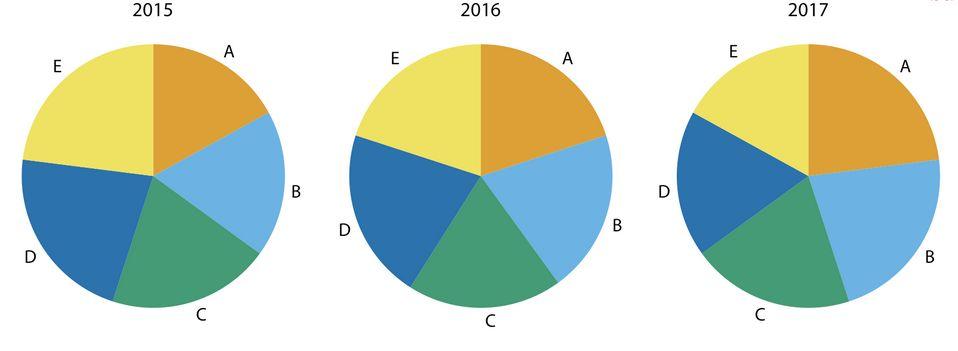
32 Side by side bars
33 Pie chart Stacked bars Side-by-side bars Clearly visualizes the data as proportions of a whole Allows easy visual comparison of the relative proportions Visually emphasizes simple fractions, such as 1/2, 1/3, 1/4 Looks visually appealing even for very small datasets Works well when the whole is broken into many pieces Works well for the visualization of many sets of proportions or time series of proportions
34 Distribution - Histogram - Stacked histogram vs pyramid - Scatter plot
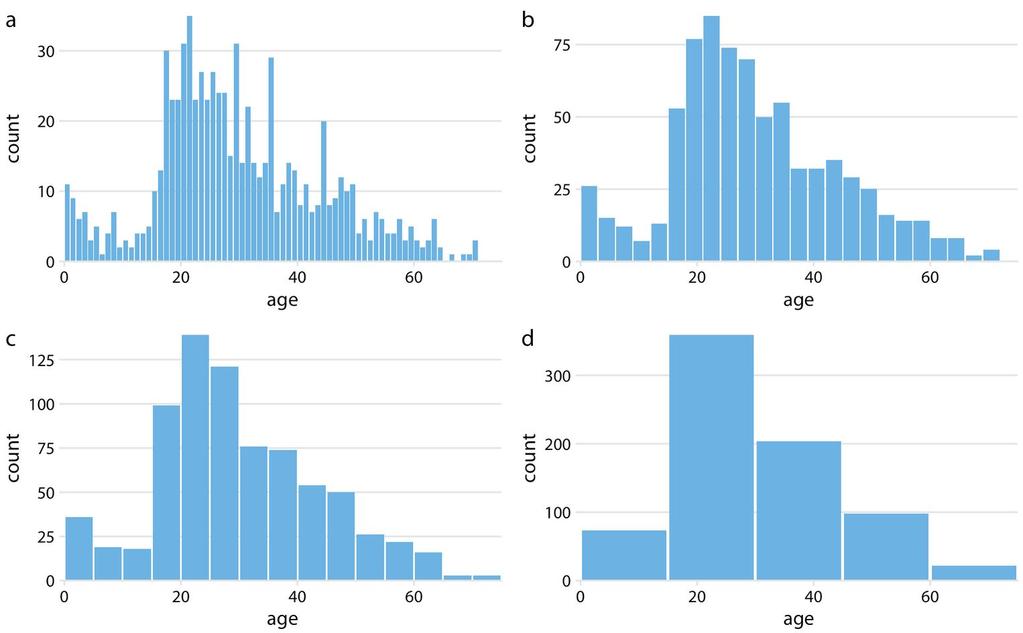
35 Histogram

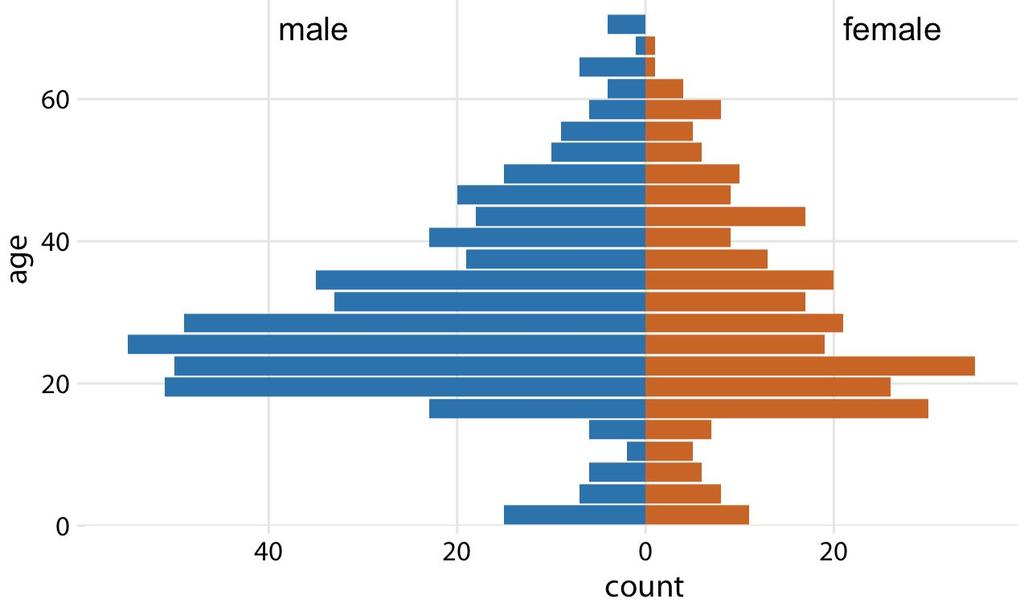
36 Stacked vs Pyramid
37 Scatter plot
38 Time series distribution
39 Wrap-up

40 We re Wiredcraft. Thanks!