WOO-SR Feasibility Study (PID 90541) Feasibility Study Report April 22, 2011
|
|
|
- Scott Berry
- 5 years ago
- Views:
Transcription
1 TABLE OF CONTENTS EXECUTIVE SUMMARY... 1 CHAPTER 1: INTRODUCTION Study Purpose and background Study Approach Study Area... 6 CHAPTER 2: DESCRIPTIONS OF ALTERNATIVES Alternative 1 New Roadway Alignment Alternative 2 CR-139/SR Alternative 3 Liberty-Hi Road/Cygnet Road (Township Hwy 3) Alternative 4 Liberty-Hi Road/Belmore Road... 8 CHAPTER 3: TRAFFIC ANALYSIS Study Area Data Collected Traffic Volume Projections Intersection Capacity Analyses Travel Time Analysis Traffic Analysis Summary CHAPTER 4: ROADWAY ASSESSMENT Existing Roadway Assessment Proposed Typical Sections Roadway Recommendations Roundabouts Roadway Improvement Costs CHAPTER 5: RIGHT-OF-WAY IMPACTS Existing Right-of-Way Right-of-Way Impacts and Cost Estimates CHAPTER 6: STRUCTURES ASSESSMENT Existing Structures Assessment Structure Impacts i
2 TABLE OF CONTENTS (Continued) CHAPTER 7: UTILITY IMPACTS Utility Investigation Methodology Existing Utilities Utility Impacts CHAPTER 8: ENVIRONMENTAL ANALYSIS Environmental Investigation Methodology Environmental Justice Air Quality and Noise Environmental Resource Impacts CHAPTER 9: COST SUMMARY, TIMING FACTORS AND COMPARISON MATRIX Cost Summary Timing Factors Alternatives Comparison Matrix CHAPTER 10: CONCLUSIONS TABLES TABLE 1: Intersection Capacity Results AM Design Hour TABLE 2: Intersection Capacity Results PM Design Hour TABLE 3: Estimated Average Travel Times Existing Intersection Controls TABLE 4: Estimated Average Travel Times Roundabout Intersection Controls TABLE 5: Roadway Cost Per Lin Ft Estimate TABLE 6: Utility Impacts/Costs TABLE 7: Estimate of Probable Construction Costs Summary TABLE 8: Alternatives Comparison Matrix APPENDICES APPENDIX A-1: Traffic Data APPENDIX A-2: Traffic Volume Calculations APPENDIX A-3: Intersection Capacity Analyses APPENDIX B-1: Roadway Appendix Log APPENDIX B-2: Proposed Roadway Typical Sections APPENDIX B-3: Proposed Roadway Alignment Plan Sheets APPENDIX B-4: Roadway Costs Per Lin Ft Estimate APPENDIX C: Right-of-Way Cost Estimate for Each Alternative APPENDIX D-1 Structures Photo Log ii
3 EXHIBITS TABLE OF CONTENTS (Continued) APPENDIX D-2 Structures Table APPENDIX E-1: OUPS Request APPENDIX E-2: Utility Correspondence APPENDIX E-3: Utility Cost Estimate Development APPENDIX F-1: Cultural Resources OHPO Summary Information APPENDIX F-2: Wood & Hancock County Auditor Information for CAUV Programs APPENDIX F-3: Wood & Hancock County Park District Information APPENDIX F-4: USFWS/ODNR Endangered Species Information APPENDIX F-5: FEMA Flood Insurance Rate Maps APPENDIX F-6: U.S. Census Bureau Factsheets APPENDIX F-7: Ohio Air Quality Area Map APPENDIX G-1 Estimate of Probable Construction Costs APPENDIX G-2 Demolition Cost Per Alternative APPENDIX G-3 Design Completion Risk Guidelines for Cost Estimating of Major Projects APPENDIX H Alternatives Comparison Matrix Exhibit 1: Exhibit 2: Exhibit 2: Exhibit 3: Project Land Use Map (Wood County 2007 Comprehensive Plan Update) Area Location Map Alternatives Routes Exhibit Environmental Resources Exhibit iii
4 EXECUTIVE SUMMARY EMH&T has completed a feasibility study for the Ohio Department of Transportation (ODOT) to assess alternative transportation routes to direct future traffic generated by the newly constructed CSX Intermodal Facility, located west of the Village of North Baltimore, Ohio. The study evaluated four (4) alternatives roadway alignments that originate at the CSX Intermodal Facility and travel through Wood and/or Hancock Counties, in order to identify a timely and cost-effective solution to accommodate commercial traffic between the Intermodal Facility and Interstate 75 (I-75). The area surrounding the CSX Intermodal Facility, stretching from the facility east to I-75, has been identified as a regionally significant key corridor and employment center in the Wood County 2007 Comprehensive Plan Update. This Feasibility Study is being performed as part of a pilot Project Development Process (PDP) designed to streamline the process of planning, designing and building Ohio s critical transportation infrastructure needs. The alternatives were evaluated for specific criteria which included: traffic analysis, roadway conditions, drainage structure assessments, utility impacts, right-of-way impacts and environmental resources. The results of the study provide recommendations for roadway improvements that can provide a safe and efficient travel corridor for the increased truck traffic generated by the CSX Intermodal Facility and associated development. The study also provides an evaluation of required right-of-way acquisitions, impacts to existing utilities, and identification of sensitive environmental resources within the study area. Four alternatives were evaluated as part of this study. Alternative 1 proposes the construction of a 2.24-mile new roadway on a new alignment between the SR 18 (Deshler Road)/Liberty Hi Road intersection and the South Main Street/SR 18 intersection in the Village of North Baltimore. To access I-75, traffic would follow SR 18 east to the I-75/ SR 18 interchange. The entire length of the route from the CSX Intermodal Facility to I-75 is 3.4 miles. Alternative 2 utilizes approximately 6.3 miles of existing roadways that extend from the SR 18/Liberty Hi Road intersection, travels south along Liberty Hi Road/County Road (CR) 139 and then east along SR 613 to the I-75/SR 613 interchange. Alternative 3 is an approximately 6.9-mile route that utilizes existing roadways along Liberty Hi Road and Cygnet Road (Township Hwy 3); it terminates at the I- 75/Cygnet Road interchange. Alternative 4 primarily utilizes existing roadways along Liberty Hi Road, CR 139 and Belmore Road. This approximately 3.7-mile route extends south from the SR 18 (Deshler Road)/Liberty Hi intersection along Liberty Hi Road/CR 139 and east along Belmore Road east into the Village of North Baltimore. A short section of new roadway would be built between Mitchell Road and North Baltimore Road. To access I-75, traffic would follow existing SR 18 east to the I-75/SR 18 interchange. 1
5 An inspection of existing roadway conditions revealed that all roadways along the proposed alignments, with the exception of State Route (SR) 613, need to be widened to meet current design standards and will require full-depth replacement of the existing pavement. Multiple drainage structures exist along each of the alignments. Based on the structure and roadway conditions, it was determined that any existing pipe culverts 36 in diameter and smaller would need to be replaced on roadway sections where full-depth pavement replacement will occur. Overhead and underground utilities exist along the majority of the existing roadways. Most roadways had wide roadside ditches/streams that could be impacted during construction, but can be avoided by aligning the roadway on the opposite sides of the ditches. Several cemeteries are located along the proposed routes but are proposed to be avoided by aligning the roadway away from these features. Traffic analyses indicated all study area intersections, including individual movements and approaches, are expected to operate at an acceptable Level of Service (LOS C or better) in each roadway network alternative. The analyses indicate that Alternative 1 provides the most direct route to/from the I-75 freeway, provides the least amount of estimated travel time (approximately 280 seconds), and requires the fewest number of stops or turning maneuvers among all alternatives considered. Alternative 4 provides the second fastest travel time (approximately 310 seconds) between the Intermodal Facility and I-75 relative to the other alternatives considered. The implementation of roundabouts at key intersections will provide additional safety benefits when compared to stop-controlled intersections, but would provide limited improvement in delay and travel time as a result of the relatively low projected traffic volumes in the area. Right-of-way acquisition and utility relocations will be required for implementation of any of the alternatives. Based on a preliminary review of the Alternative corridors, potential impacts to surface waters have been estimated. For the purposes of this planning level study, ditches are assumed to be jurisdictional streams. For all alternatives, stream impacts are not expected to exceed the thresholds of a Nationwide Permit. No stream impacts were identified for Alternative feet of stream impact was calculated for Alternative 2. A total of 130 feet of stream impact was identified for Alternative 3. Approximately 20 feet of stream impact was identified for Alternative 4. All of the potential stream impacts would occur to low to medium quality stream habitats. Two known prehistoric cultural resources sites are located on parcels within the potential impact area of Alternatives 2 and 3. Their locations are in close proximity to the alignment corridor. Additional information will need to be collected to determine the extent of impact and the quality of these two sites. No cultural resources impacts are anticipated for Alternatives 1 and 4. Land use within Wood County is predominately agricultural, with approximately 90% of the land in the county being farmed. The majority of right-of way impacts will occur to parcels in agricultural production. The relative impact of farming in the region is not 2
6 anticipated to be significant based on the overall volume of agricultural land in the area that will be left undisturbed by this project. Based on the projected land use provided in the Wood County 2007 Comprehensive Plan Update, the area surrounding the CSX Intermodal Facility and stretching east to I-75 has been identified for major highway upgrades to support expanding commercial and industrial development. There are three Section 4(f) resources within the study area; the public Birch Run Golf Course, Slippery Elm Trail and Cricket Frog Cove Area. The Golf Course is located adjacent to Alternatives 1 and 4 and could be avoided by aligning the roadways slightly north of this resource. Slippery Elm Trail and Cricket Frog Cove Area are located on Cygnet Road, along the Alternative 3 alignment. Minor impacts to the trail will likely occur due to roadway widening. Based on preliminary alignment assumptions, the road improvements could be designed to avoid or minimize impacts to the Cricket Frog Cove Area. Alternative 2 is not expected to require Section 4(f) coordination, assuming no significant cultural resources sites are identified during further investigations. Alternatives 1 and 4 are the least expensive routes to build, with construction costs estimated at $8.98 Million Dollars and $10.27 Million Dollars, respectively. Alternative 3 would cost significantly more to implement than any of the other proposed alternatives, with an estimated construction cost of $24.62 Million Dollars. Alternative 2 is the second most expensive alternative to implement, with construction costs estimated at $14.05 Million Dollars. Alternative 1 would be the quickest route to execute and would take approximately months to complete design, environmental clearance, right-of-way acquisition and construction. Alternative 4 would be the second quickest to execute, with the total project duration approximated at months. The longest routes to design and build are Alternatives 2 and 3, with a total duration of approximately months and months, respectively. (Space intentionally left blank) 3
7 WOO-SR Feasibility Study (PID 90541) Alternatives Comparison Matrix 4
8 CHAPTER 1: INTRODUCTION 1.1 Study Purpose and Background The purpose of the WOO-SR Feasibility Study is to evaluate the feasibility of alternatives proposed for roadway corridor improvements between the newly constructed CSX-Northwest Ohio Trans-Shipment Intermodal Facility, located west of the Village of North Baltimore, and Interstate 75 (I-75) in Wood and Hancock Counties, Ohio. The area surrounding the CSX Intermodal Facility, stretching from the facility east to I-75, has been identified as a regionally significant key corridor and employment center in the Wood County 2007 Comprehensive Plan Update. The corridor is a location of existing and expanding business parks and industrial centers that offer employment to the region and requires transportation upgrades to support expanding development. A copy of the Projected Land Use Plan exhibit, dated January 2008, from the Comprehensive Plan Update is provided in Exhibit 1. This corridor is in need of transportation infrastructure improvements to address congestion, accommodate large commercial vehicles, and address potential safety issues associated with the CSX Intermodal Facility and planned commercial and industrial development. The existing primary route for trucks to access I-75 is along State Route 18 (SR 18) through the Village of North Baltimore. The current alignment and geometrics of State Route 18 through the Village includes a number of intersections and turning movements that are difficult for trucks to negotiate. Traffic studies indicate that the CSX Facility and future commercial development will substantially increase the number and volume of trucks using SR 18 and other local roadways through downtown North Baltimore to access I-75. Therefore, there is a need to re-route truck traffic away from the downtown North Baltimore area to improve traffic flow and potential safety issues caused by high volumes of commercial truck traffic. At the same time, there is a need to provide a more direct and efficient access for commercial traffic to reach I-75 from the CSX Intermodal Facility. In doing this, it is also necessary to address the projected long-range transportation mobility needs in the study area through consideration of the Projected Land Use Plan for Wood County (Wood County 2007 Comprehensive Plan Update). The CSX Intermodal Facility is scheduled to open in June With this opening, the Village of North Baltimore can expect a sharp increase in truck traffic through an already congested downtown. As previously stated, the existing route through the Village includes several right turns that will complicate and slow the truck traffic, creating additional congestion, delays along the shipping route to I-75, possible safety concerns and increased air quality issues. This Feasibility Study is being performed as part of a pilot Project Development Process (PDP) designed to streamline the process of planning, designing and building Ohio s critical transportation infrastructure needs. This Feasibility Study evaluated four (4) potential alternatives in order to assist the Ohio Department of Transportation (ODOT) in identifying a timely and cost-effective short-term process for identifying the range of possible solutions for routing commercial traffic between the CSX Intermodal Facility, its supporting developments and I-75 in a manner most effective. In addition to this Feasibility Study and as a part of the recommended alignments further 5
9 development, ODOT will identify additional long-term transportation needs and priorities that may be required in a continuing effort to address the region s continued growth as a result of the CSX Intermodal Facility and its supporting developments. Where feasible, ODOT will look at options to address these long-term needs in conjunction with implementation of the preferred alignment. 1.2 Study Approach Primary sources of information utilized for the preparation of this report include secondary source materials and existing data. Field investigations of the project area were limited to those conducted to assess existing roadway conditions, inspect and inventory all bridges and drainage structures, and identify existing utilities along the proposed alternative routes. The study included an evaluation of potential right-of-way impacts, impacts to existing utilities, and identified sensitive environmental resources within the study area. The development of transportation improvement recommendations and assessment of impacts was performed in accordance with ODOT design manuals and documents as listed below. o Bridge Design Manual o Location and Design Manual - Volume 1 - Roadway Design o Location and Design Manual - Volume 2 - Drainage Design o Location and Design Manual - Volume 3 - Highway Plans o Ohio Manual of Uniform Traffic Control Devices o Traffic Engineering Manual o Cost Estimation Support o Project Development Process Manual o National Pollutant Discharge Elimination System (NPDES) o Office of Environmental Services Handbooks and Guidelines A detailed project approach to each evaluated criteria is provided at the beginning of each chapter. 1.3 Study Area The project study area encompasses areas in both Wood and Hancock Counties, Ohio (Exhibit 1). The northern extent of the study area runs along Cygnet Road between Liberty Hi Road and I-75. The southern boundary is located on State Route (SR) 613 between County Road (CR) 139 and the I-75/ SR 613 interchange. The western extent of the project area runs along Liberty Hi Road from Cygnet Road (Township Highway 3) south to SR 613. The eastern extent of the study area runs along I-75, from the I- 75/Cygnet Road interchange south to the I-75/SR 613 interchange. The CSX-Northwest Ohio Trans-Shipment Terminal is located on the western study area boundary. The Village of North Baltimore is located in the central portion of the study area. 6
10 CHAPTER 2: DESCRIPTION OF ALTERNATIVES This study evaluated four (4) proposed alternative transportation routes between the CSX Intermodal Facility and I-75, as shown in Exhibit 3. The four alternative routes were identified and provided by ODOT District 2. All alternatives provide a route that bypasses downtown and reduces truck traffic in downtown North Baltimore. Based on the Projected Land Use exhibit (Exhibit 1) provided in the Wood County 2007 Comprehensive Plan Update, the area surrounding the CSX Facility and stretching east to I-75 (encompassing the alignments for Alternatives 1 and 4) has been identified for major highway upgrades to support expanding commercial and industrial development. Alternatives 2 and 3 are outside the key corridor designated areas. A description of each alternative alignment is provided below. 2.1 Alternative 1 New Roadway Alignment Alternative 1 is a new alignment, not along an existing roadway, within the proposed study area. Construction of a 2.24 mile new road segment is proposed between the SR 18 (Deshler Road)/Liberty Hi Road intersection and the South Main Street/SR 18 intersection in the Village of North Baltimore. The new alignment extends southeast from the SR 18 (Deshler Road)/Liberty Hi Road intersection and crosses Hough Road approximately 0.25 mile north of the existing Hough Road/Belmore Road intersection. Hough Road will have two cul-de-sacs, one on the north and one on the south of the new alignment, to eliminate the need for an intersection. The new alignment continues east into the Village of North Baltimore, forming a new intersection with Mitchell Road approximately 0.25 mile north of the Mitchell Road/Belmore Road intersection. In the Village of North Baltimore, the new alignment ends at the existing intersection of South Main Street and SR 18. Deweyville Road is proposed to end in a cul-de-sac. To access I- 75, vehicles would then travel east on existing SR 18 to the I-75/SR 18 interchange. The entire length of route from the CSX Intermodal Facility to I-75 is 3.4 miles. 2.2 Alterative 2 CR 139/SR 613 Alternative 2 utilizes approximately 6.3 miles of existing roadways within the proposed study area along CR 139 and SR 613. The route for Alternative 2 follows Liberty-Hi Road south from the SR 18 (Deshler Road)/Liberty Hi intersection approximately 3.75 miles to the CR 139/SR 613 intersection (NOTE: Liberty-Hi Road transitions to CR 139 in Hancock County). The Alternative 2 route then follows SR 613 east for approximately 2.5 miles where it terminates at the I-75/SR 613 interchange. 2.3 Alternative 3 Liberty Hi Road/Cygnet Road (Township Hwy 3) Alternative 3 utilizes an existing 6.9 miles of existing roadways within the proposed study area along Liberty Hi Road and Cygnet Road (Township Hwy 3). The route for 7
11 Alternative 3 follows Liberty-Hi Road north from the SR 18 (Deshler Road)/Liberty Hi intersection approximately 4 miles to the Liberty Hi Road/Cygnet Road intersection. The Alternative 3 route then follows Cygnet Road east for approximately 2.9 miles where it terminates at the I- 75/Cygnet Road interchange. 2.4 Alternative 4 Liberty Hi Road/Belmore Road Alternative 4 utilizes primarily existing roadways within the proposed study area along Liberty-Hi Road and Belmore Road. The route for Alternative 4 follows Liberty-Hi Road south from the SR 18 (Deshler Road)/Liberty Hi intersection approximately 0.75 mile to the CR 139/Belmore Road intersection. The route then follows Belmore Road east for approximately 1.5 miles into the Village of North Baltimore. An approximately 2,700 linear foot section of new alignment, not along an existing roadway, would be built between Mitchell Road and North Baltimore Road. This new roadway segment is proposed to avoid two four-way stop/ 90 degree intersections that trucks would have to navigate along the existing roadway alignment. Deweyville Road is proposed to end in a cul-de-sac. In the Village of North Baltimore, the alignment ends at the existing intersection of South Main Street and SR 18. To access I-75, vehicles would then travel east on SR 18 to the I-75/SR 18 interchange. The entire length of route from the CSX Intermodal Facility to I-75 is approximately 3.7 miles. CHAPTER 3: TRAFFIC ANALYSIS Traffic analyses have been completed to assess transportation impacts associated with the aforementioned alternative routes developed to direct future traffic generated by the CSX Intermodal Facility, located west of the Village of North Baltimore, to the I-75 freeway system, located east of the Village of North Baltimore. Certified traffic volumes provided by ODOT were used to evaluate intersection capacity at study area intersections, as identified below, for each network alternative. A basic travel time calculation was also completed for each alternative. 3.1 Study Area The Traffic Analysis study area includes the alternative alignments shown in Exhibit 3, but also includes other critical intersections where significant traffic volume differences are expected in each alternative. Study area intersections are identified on the graphic on page 9 which includes existing conditions used in analyses, such as; intersection configuration, intersection control, speed limits, and functional classification. The figure also illustrates locations where potential roundabouts were requested by ODOT to be analyzed. 8
12 Traffic Study Area 9
13 3.2 Data Collected Certified traffic volumes, dated March 9, 2011, were provided by the ODOT Division of Planning, Modeling and Forecasting Section. Morning, afternoon, and daily traffic volumes were provided for Years 2016 and 2036 for the No Build and Build conditions. The No Build conditions represent current day roadway network configurations and the Build condition represents a new roadway connecting SR 18, west of Liberty Hi Road to SR 18 at North Baltimore Road. Certified traffic volumes also included morning, afternoon, and daily truck percentages for each roadway segment. Information provided in the Proposed CSX Intermodal Rail Yard Traffic Impact Study, (TranSystems, January 7, 2009) was referenced as well. Certified traffic volumes and copies of applicable pages from the TranSystems study are provided in Appendix A Traffic Volume Projections Certified traffic data does not explicitly provide traffic volumes for each roadway network alternative. The no build condition was used to determine traffic volumes for Alternatives 2 and 3 and the build condition was used to determine traffic volumes for Alternatives 1 and 4. However, this results in equivalent traffic volumes at locations where this would not be expected. For example, traffic volumes at the SR 613/Liberty Hi Road intersection should be greater in Alternative 2 than in Alternative 3. Therefore, site generated traffic volumes published in the above cited 2009 TranSystems traffic study were distributed to the I-75 freeway system for each alternative and added to certified traffic volumes. This provides volume differences, where expected, between alternatives and also provides for conservative results. Detailed traffic volume calculations were prepared for year 2036, morning, afternoon, and daily conditions and are provided in Appendix A Intersection Capacity Analyses Highway Capacity Software (HCS+T7F) was used to evaluate operational characteristics of traditional study area intersections based on morning and afternoon design hour traffic volume conditions. SIDRA modeling software was used to evaluate modern roundabout intersections. Intersections are graded using a level of service (LOS) designation expressed in terms of letter grades with LOS A representing the highest quality traffic flow and minimal delay, and LOS F representing poor traffic operations and significant delay. The operational level of service goal for study area intersections is considered to be LOS C. Year 2036 morning and afternoon design hour calculated traffic volumes and provided heavy vehicle percentages were used to assess intersection capacity at study area locations based on conditions outlined in the Traffic Study Area on page 9. Results indicate all study area intersections, including individual movements and approaches, are expected to operate at a LOS C or better in each roadway network alternative. Capacity 10
14 analysis reports are provided in Appendix A-3 and detailed summaries are provided in Table 1 and Table 2 for the AM design hour and PM design hour, respectively. (Space intentionally left blank) 11
15 Eastbound Table 1 Intersection Capacity Results AM Design Hour Intersection Alternative LT TH RT App. LT TH RT App. LT TH RT App. LT TH RT App. Int. Cygnet Road/ Alternative A/ A/ A/ A/ A/ A/ A/ A/ Liberty Hi Road Alternative A/ A/ A/ A/ A/ A/ A/ A/ (East/West Stop Control) Alternative A/ A/ B/ B/ A/ A/ A/ A/ Alternative A/ A/ A/ A/ A/ A/ A/ A/ (Roundabout) Alternative 3 B/ 11.6 A/ 5.1 A/ 6.3 A/ 7.7 B/ 11.3 A/ 4.7 A/ 5.5 A/ 9.7 B/ 12.3 A/ 5.1 A/ 5.9 A/ 6.3 B/ 12.3 A/ 5.2 A/ 6.8 A/ 7.0 A/ 7.5 Cygnet Road/ Alternative A/ A/ B/ B/ B/ B/ I-75 SB Ramps/CR 604 Alternative A/ A/ B/ B/ B/ B/ (North/South Stop Control) Alternative A/ A/ B/ B/ B/ B/ Alternative A/ A/ B/ B/ B/ B/ Cygnet Road/ Alternative A/ A/ A/ A/ B/ B/ I-75 NB Ramps/CR 603 Alternative A/ A/ A/ A/ B/ B/ (North/South Stop Control) Alternative A/ A/ A/ A/ B/ B/ Alternative A/ A/ A/ A/ B/ B/ SR 18/ Alternative A/ A/ A/ A/ B/ B/ C/ C/ Liberty Hi Road Alternative A/ A/ A/ A/ B/ B/ B/ B/ (North/South Stop Control) Alternative A/ A/ A/ A/ C/ C/ C/ C/ Alternative A/ A/ A/ A/ C/ C/ B/ B/ Alternative 2 B/ 11.9 A/ 5.0 A/ 5.6 A/ 6.1 B/ 12.4 A/ 5.6 A/ 7.4 A/ 6.1 B/ 13.6 A/ 6.7 A/ 7.6 B/ 11.9 B/ 13.2 A/ 6.3 A/ 7.2 B/ 11.4 A/ 7.5 (Roundabout) Alternative 3 B/ 12.0 A/ 5.2 A/ 6.6 A/ 7.8 B/ 12.7 A/ 5.9 A/ 7.7 A/ 6.4 B/ 14.1 A/ 7.2 A/ 8.3 B/ 10.9 B/ 12.5 A/ 5.6 A/ 6.5 A/ 9.2 A/ 7.9 Alternative 4 B/ 11.8 A/ 4.9 A/ 5.7 A/ 6.1 B/ 13.8 A/ 6.9 A/ 8.2 A/ 9.0 B/ 11.8 A/ 4.9 A/ 5.6 B/ 11.3 B/ 13.7 A/ 6.8 A/ 8.1 A/ 8.8 A/ 8.8 Belmore Road/ Alternative A/ A/ A/ A/ A/ A/ A/ A/ Liberty Hi Road Alternative A/ A/ A/ A/ A/ A/ A/ A/ (East/West Stop Control) Alternative A/ A/ A/ A/ A/ A/ A/ A/ Alternative C/ C/ B/ B/ A/ A/ A/ A/ (Roundabout) Alternative 4 B/ 13.3 A/ 6.5 A/ 7.7 A/ 9.2 B/ 11.8 A/ 4.9 A/ 5.7 A/ 5.9 B/ 13.3 A/ 6.5 A/ 7.7 A/ 9.2 B/ 11.7 A/ 4.8 A/ 5.5 B/ 11.1 A/ 8.4 SR 18/ Alternative A/ A/ A/ A/ A/ A/ A/ A/ 8.1 A/ 8.1 Main Street/State Street Alternative A/ A/ A/ A/ B/ B/ A/ A/ 8.5 A/ 9.4 (All-Way Stop Control) Alternative A/ A/ A/ A/ B/ B/ A/ A/ 8.5 A/ 9.4 Alternative A/ A/ A/ A/ A/ A/ A/ A/ 8.1 A/ 8.1 SR 18/ Alternative A/ A/ A/ A/ B/ B/ C/ C/ North Baltimore Road Alternative A/ A/ A/ A/ B/ B/ B/ B/ (North/South Stop Control) Alternative A/ A/ A/ A/ B/ B/ B/ B/ Alternative A/ A/ A/ A/ B/ B/ C/ C/ (Roundabout) Alternative 1 B/ 12.3 A/ 6.1 A/ 7.8 A/ 6.6 B/ 10.7 A/ 4.5 A/ 6.0 A/ 5.3 B/ 13.5 A/ 7.3 A/ 8.5 A/ 9.8 B/ 13.4 A/ 7.2 A/ 7.9 B/ 12.7 A/ 7.2 Alternative 4 B/ 12.3 A/ 6.1 A/ 7.8 A/ 6.6 B/ 10.7 A/ 4.5 A/ 6.0 A/ 5.3 B/ 13.5 A/ 7.3 A/ 8.5 A/ 9.8 B/ 13.4 A/ 7.2 A/ 7.9 B/ 12.7 A/ 7.2 SR 18/ Alternative C/ C/ 21.3 B/ 12.2 B/ B/ B/ C/ 22.3 C/ 21.5 B/ 18.9 I-75 SB Ramps Alternative C/ C/ 20.7 B/ 12.2 B/ B/ B/ C/ 20.5 B/ 19.9 B/ 18.1 (Signalized) Alternative C/ C/ 20.7 B/ 12.2 B/ B/ B/ C/ 20.5 B/ 19.9 B/ 18.1 Alternative C/ C/ 21.3 B/ 12.2 B/ B/ B/ C/ 22.3 C/ 21.5 B/ 18.9 SR 18/ Alternative B/ B/ B/ B/ 15.8 B/ B/ 16.2 B/ B/ 16.5 I-75 NB Ramps Alternative B/ B/ B/ B/ 16.3 B/ B/ 15.6 B/ B/ 16.2 (Signalized) Alternative B/ B/ B/ B/ 16.3 B/ B/ 15.6 B/ B/ 16.2 Alternative B/ B/ B/ B/ 15.8 B/ B/ 16.2 B/ B/ 16.5 SR 613/ Alternative A/ A/ A/ A/ A/ A/ B/ B/ CR 139 Alternative A/ A/ A/ A/ B/ B/ B/ B/ (North/South Stop Control) Alternative A/ A/ A/ A/ A/ A/ B/ B/ Alternative A/ A/ A/ A/ A/ A/ B/ B/ (Roundabout) Alternative 2 B/ 11.2 A/ 5.1 A/ 6.7 A/ 5.9 B/ 10.5 A/ 4.3 A/ 5.1 A/ 5.2 B/ 13.2 A/ 6.0 A/ 7.4 A/ 8.9 B/ 12.6 A/ 5.4 A/ 6.2 B/ 11.3 A/ 7.6 SR 613/ Alternative A/ A/ B/ B/ I-75 SB Ramps Alternative A/ A/ B/ B/ (North/South Stop Control) Alternative A/ A/ B/ B/ Alternative A/ A/ B/ B/ SR 613/ Alternative A/ A/ B/ B/ I-75 NB Ramps Alternative A/ A/ B/ B/ (North/South Stop Control) Alternative A/ A/ B/ B/ Alternative A/ A/ B/ B/ Notes: For signalized/roundabout intersections: X/X = Level of Service / Average Delay per Vehicle For stop controlled intersections: X/X = Level of Service/ Highest Side Street Delay per Vehicle Westbound Northbound Southbound 12
16 Table 2 Intersection Capacity Results PM Design Hour Intersection Alternative LT TH RT App. LT TH RT App. LT TH RT App. LT TH RT App. Int. Cygnet Road/ Alternative A/ A/ A/ A/ A/ A/ A/ A/ Liberty Hi Road Alternative A/ A/ A/ A/ A/ A/ A/ A/ (East/West Stop Control) Alternative A/ A/ B/ B/ A/ A/ A/ A/ Alternative A/ A/ A/ A/ A/ A/ A/ A/ (Roundabout) Alternative 3 B/ 11.9 A/ 5.1 A/ 6.4 A/ 7.8 B/ 11.5 A/ 4.8 A/ 5.8 A/ 9.1 B/ 11.6 A/ 4.8 A/ 5.6 A/ 6.2 B/ 12.4 A/ 5.3 A/ 6.8 A/ 7.4 A/ 7.6 Cygnet Road/ Alternative A/ A/ B/ B/ B/ B/ I-75 SB Ramps/CR 604 Alternative A/ A/ B/ B/ B/ B/ (North/South Stop Control) Alternative A/ A/ B/ B/ B/ B/ Alternative A/ A/ B/ B/ B/ B/ Cygnet Road/ Alternative A/ A/ A/ A/ B/ B/ I-75 NB Ramps/CR 603 Alternative A/ A/ A/ A/ B/ B/ (North/South Stop Control) Alternative A/ A/ A/ A/ B/ B/ Alternative A/ A/ A/ A/ B/ B/ SR 18/ Alternative A/ A/ A/ A/ B/ B/ B/ B/ Liberty Hi Road Alternative A/ A/ A/ A/ C/ C/ B/ B/ (North/South Stop Control) Alternative A/ A/ A/ A/ B/ B/ B/ B/ Alternative A/ A/ A/ A/ C/ C/ A/ A/ Alternative 2 B/ 11.5 A/ 4.7 A/ 5.6 A/ 6.4 B/ 12.3 A/ 5.5 A/ 7.3 A/ 6.0 B/ 13.0 A/ 6.2 A/ 7.2 B/ 10.9 B/ 13.6 A/ 6.8 A/ 8.0 A/ 8.9 A/ 7.1 (Roundabout) Alternative 3 B/ 11.6 A/ 4.8 A/ 6.2 A/ 7.3 B/ 12.3 A/ 5.5 A/ 7.3 A/ 6.0 B/ 13.2 A/ 6.4 A/ 7.7 A/ 9.1 B/ 14.0 A/ 7.2 A/ 6.9 A/ 7.9 A/ 7.0 Alternative 4 B/ 12.0 A/ 5.2 A/ 5.8 A/ 6.2 B/ 13.5 A/ 6.7 A/ 8.0 A/ 9.4 B/ 11.6 A/ 4.8 A/ 5.5 B/ 11.2 A/ 13.5 A/ 6.7 A/ 8.2 A/ 8.4 A/ 8.5 Belmore Road/ Alternative A/ A/ A/ A/ A/ A/ A/ A/ Liberty Hi Road Alternative A/ A/ A/ A/ A/ A/ A/ A/ (East/West Stop Control) Alternative A/ A/ A/ A/ A/ A/ A/ A/ Alternative C/ C/ B/ B/ A/ A/ A/ A/ (Roundabout) Alternative 4 B/ 13.8 A/ 7.0 A/ 8.3 A/ 9.7 B/ 11.7 A/ 4.9 A/ 5.6 A/ 5.8 B/ 13.7 A/ 6.9 A/ 8.2 A/ 9.6 B/ 11.5 A/ 4.7 A/ 5.5 B/ 10.9 A/ 8.7 SR 18/ Alternative A/ A/ A/ A/ A/ A/ A/ A/ 9.5 A/ 9.4 Main Street/State Street Alternative B/ B/ B/ B/ C/ C/ B/ B/ 11.7 B/ 14.2 (All-Way Stop Control) Alternative B/ B/ B/ B/ C/ C/ B/ B/ 11.7 B/ 14.2 Alternative A/ A/ A/ A/ A/ A/ A/ A/ 9.5 A/ 9.4 SR 18/ Alternative A/ A/ A/ A/ B/ B/ C/ C/ North Baltimore Road Alternative A/ A/ A/ A/ B/ B/ C/ C/ (North/South Stop Control) Alternative A/ A/ A/ A/ B/ B/ C/ C/ Alternative A/ A/ A/ A/ B/ B/ C/ C/ (Roundabout) Alternative 1 B/ 12.9 A/ 6.0 A/ 7.7 A/ 6.8 B/ 11.9 A/ 5.0 A/ 6.7 A/ 5.8 B/ 14.4 A/ 7.5 A/ 8.8 B/ 10.2 B/ 13.2 A/ 6.2 A/ 7.1 B/ 11.7 A/ 7.6 Alternative 4 B/ 12.9 A/ 6.0 A/ 7.7 A/ 6.8 B/ 11.9 A/ 5.0 A/ 6.7 A/ 5.8 B/ 14.4 A/ 7.5 A/ 8.8 B/ 10.2 B/ 13.2 A/ 6.2 A/ 7.1 B/ 11.7 A/ 7.6 SR 18/ Alternative C/ C/ 23.7 B/ 13.0 B/ B/ B/ C/ 24.1 C/ 22.8 C/ 21.6 I-75 SB Ramps Alternative C/ C/ 22.1 B/ 12.6 B/ B/ B/ C/ 22.1 C/ 21.3 B/ 19.7 (Signalized) Alternative C/ C/ 22.1 B/ 12.6 B/ B/ B/ C/ 22.1 C/ 21.3 B/ 19.7 Alternative C/ C/ 23.7 B/ 13.0 B/ B/ B/ C/ 24.1 C/ 22.8 C/ 21.6 SR 18/ Alternative B/ B/ B/ B/ 16.4 B/ B/ 15.9 B/ B/ 17.5 I-75 NB Ramps Alternative B/ B/ B/ B/ 16.3 B/ B/ 16.1 B/ B/ 16.8 (Signalized) Alternative B/ B/ B/ B/ 16.3 B/ B/ 16.1 B/ B/ 16.8 Alternative B/ B/ B/ B/ 16.4 B/ B/ 15.9 B/ B/ 17.5 SR 613/ Alternative A/ A/ A/ A/ B/ B/ B/ B/ CR 139 Alternative A/ A/ A/ A/ B/ B/ B/ B/ (North/South Stop Control) Alternative A/ A/ A/ A/ B/ B/ B/ B/ Alternative A/ A/ A/ A/ B/ B/ B/ B/ (Roundabout) Alternative 2 B/ 10.7 A/ 4.7 A/ 6.2 A/ 5.4 B/ 10.2 A/ 4.2 A/ 5.0 A/ 4.9 B/ 11.6 A/ 5.4 A/ 6.5 A/ 7.8 B/ 11.4 A/ 5.2 A/ 6.1 A/ 9.5 A/ 6.1 SR 613/ Alternative A/ A/ B/ B/ I-75 SB Ramps Alternative A/ A/ B/ B/ (North/South Stop Control) Alternative A/ A/ B/ B/ Alternative A/ A/ B/ B/ SR 613/ Alternative A/ A/ C/ C/ I-75 NB Ramps Alternative A/ A/ C/ C/ (North/South Stop Control) Alternative A/ A/ C/ C/ Alternative A/ A/ C/ C/ Notes: For signalized/roundabout intersections: X/X = Level of Service / Average Delay per Vehicle For stop controlled intersections: X/X = Level of Service/ Highest Side Street Delay per Vehicle Eastbound Westbound Northbound Southbound 13
17 3.5 Travel Time Analysis A simple travel time analysis was conducted to determine the amount of time required to travel between the SR 18/Liberty Hi Road intersection and the I-75 freeway for each alternative. Posted speed limits, in combination with vehicular delays obtained from intersection capacity analysis results for each route, were used to estimate average time of travel during peak periods. Travel times for both directions of travel, as well as for both morning and afternoon design hours were calculated and the highest result is displayed. Computations are used for comparison purposes only and results are summarized on Table 3, assuming existing intersection controls. The table also illustrates the number of stops required for each route, as well as the number of times a vehicle would be required to slow down to complete a turning maneuver. For signalized intersections, a range was provided for the number of stops required since the vehicle may or may not be required to stop at the signal, depending on the indication provided. Based on the simple travel time analysis, Alternatives 1 and 4 are expected to require the least amount of travel time while travel times for Alternatives 2 and 3 are expected to be 50 to 80 percent greater than Alternatives 1 and 4. The least number of required stops and turning movements are in Alternative 1, while the most number of required stops and turning movements are in Alternatives 3 and 4. It should also be noted that in order to access I-75, Alternative 2 involves routing intermodal traffic significantly to the south of the site and Alternative 3 involves routing traffic significantly to the north. As a result, additional travel time not included in these analyses will be incurred for trips with an origin/destination to/from the north on I-75 in Alternative 2 and to/from the south on I-75 in Alternative 3 to account for back tracking. Alternative Length (miles) Table 3 Estimated Average Travel Times Existing Intersection Controls Number of Stops Number of Turns Delay (sec.) Travel Time (sec.) Rank Notes: Number of Stops based on stop controlled approach or signalized intersection. For signalized intersections, a range is provided since the vehicle may or may not receive a red signal. Number of Turns equates to a turning movement at the free-flow approach of a stop-controlled intersection. Delay is based on intersection capacity analysis results. 14
18 Separate travel time analyses were also conducted for each alternative to account for roundabout intersections. If roundabouts are utilized at the specified locations, travel times, as well as the required number of stops for each alternative are expected to decrease slightly. Roundabouts are not expected to provide significant reduction in travel times since there are situations where the vehicle would have a free-flow movement through the intersection if a roundabout were not present. Alternative Length (miles) Table 4 Estimated Average Travel Times Roundabout Intersection Controls Number Number Delay of Turns/ of Stops (sec.) Yields Travel Time (sec.) Rank Notes: Number of Stops based on stop controlled approach or signalized intersection. For signalized intersections, a range is provided since the vehicle may or may not receive a red signal. Number of Turns/Yields equates to a turning movement at the free-flow approach of a stop-controlled intersection or any movement through a roundabout intersection. Delay based on intersection capacity analysis results. 3.6 Traffic Analysis Summary In summary, Alternative 1 provides the most direct route to/from the I-75 freeway, provides the least amount of estimated travel time, and requires the fewest number of stops or turning maneuvers among all alternatives considered. Stop controlled intersections are expected to provide adequate capacity in each alternative. Roundabouts provide additional safety benefits when compared to stop-controlled intersections, but would provide limited improvement in delay and travel time as a result of the relatively low projected traffic volumes in the area. In addition, roundabouts require greater costs compared to stop controlled intersections as a result of required elements, such as; curbing, landscaping, truck aprons, and additional right-of-way. CHAPTER 4: ROADWAY ASSESSMENT 4.1 Existing Roadway Assessment EMH&T roadway engineers performed a site visit of the study area on March 3, 2011 to review the existing roadway conditions of the four proposed alternative alignments. The physical characteristics (i.e. lane configuration, slope, pavement drainage, and lane and 15
19 shoulder widths) of each roadway segment within the four alignments were reviewed and locations of sub standard roadway geometry were identified. A photo log of each roadway corridor, keyed to a photograph location map, was assembled and is included in Appendix B-1. During the site investigation, the following observations were made: The existing roadway conditions are too narrow to handle truck traffic on some routes. Existing roads do not meet current design criteria and may require design exceptions. Liberty-Hi, Belmore, and Cygnet roads do not have the proper pavement build up to handle projected truck traffic volumes. All existing pavement on County and Township Roads will require fulldepth replacement. There is a large existing ditch, approximately feet wide, along Liberty-Hi Road. On the northern section of Liberty-Hi Road there is an existing ditch on the east side of the roadway. The ditch crosses under Liberty-Hi, to the west side, at the Hammansburg Road intersection. There are two cemeteries along the proposed alternatives, one on Liberty- Hi just north of County Road 203 South and the other on the southwest corner of the Belmore/Mitchell Road intersection. Intersection turning radii to accommodate large trucks will need to be evaluated during preliminary design. 4.2 Proposed Typical Sections Utilizing traffic data, ODOT Location and Design (L&D) Manuals, and the ODOT provided pavement build-up, two generalized typical sections were generated for the proposed roadway improvements. The first typical section is to be applied to roadway alignments where there is no existing roadside ditch. The second typical section incorporates the large existing roadside ditches already in place along many of the roadways. The following design specifications were provided by ODOT and were used to generate the two typical sections: Lane widths would be 12 feet wide with a speed limit of 55 mph and a design speed of 60 mph, per ODOT L&D Volume One, Roadway Design, Figure 301-2E. 8-foot shoulders on either side would be used based on 60 mph design speed, see ODOT L&D Volume One, Figure 301-3E cross-slopes were used based on an undivided roadway, per ODOT L&D Volume One, Figure 301-6E paved shoulder cross-slopes were used based on ODOT L&D Volume One, Figure 301-8E. A backslope of 4:1prefered, 3:1 maximum, and a foreslope of 4:1was based on a recoverable slope minimum, per ODOT L&D Volume One, Section , and Figure E. 16
20 A clear zone of 30 feet was used based on ODOT L&D Volume One, Figure 307-3E and Figure 600-1E with a 60 mph design speed and a slope of 6:1 to 4:1. ODOT will evaluate the potential to include design aesthetics in the roadway improvement plans during project development and engineering design. This process will follow ODOT Aesthetic Guidelines (September 2000) and will include public input for the evaluation of including potential design features that would improve the overall visual appearance of the proposed transportation infrastructure. Potential aesthetics may include special grading, landscaping, hardscape and aesthetically pleasing light poles and fixtures, signal poles and signage. The two generalized typical sections generated for this project are shown on the plan sheet located in Appendix B Roadway Recommendations Based on the traffic analysis, existing roadway conditions and generalized typical sections, roadway improvement recommendations were developed for the proposed alterative alignments. Plan sheets were generated for each of the four proposed alternatives and are located in Appendix B-3. The plan sheets include the general location of utilities, culverts and bridges, proposed right-of-way, and existing roadside ditches. The following determinations and assumptions were made for the purpose of generating the proposed roadway designs and recommendations: The large existing ditches along Liberty-Hi Road should be left in place and roadway widening should occur opposite of these ditches. SR 613 is in sufficient condition and no roadway improvements will be necessary for this section of roadway. SR 18, east of South Main Street in the Village of North Baltimore, is in sufficient condition and no roadway improvements will be necessary for this section of roadway. The two cemeteries should be left undisturbed and roadway widening should occur opposite of these features. The S-curve on Liberty-Hi Road just north of County Road 203 North, should be straightened out to meet current design standards. The following is a general description of the proposed improvements and alignment for each alternative. Alternative 1: Alterative 1 is a proposed new roadway, not along an existing thoroughfare, that will be aligned between the Deshler Road/Liberty-Hi Road intersection to the west and the S. Main Street/SR 18 intersection in the Village of North Baltimore to the east. This new alignment travels through active agricultural fields and farmsteads. Improvements are shown to the new intersections with Hough Road and Mitchell Road. The new roadway would be 24 feet wide with 8-foot shoulders on either side. 17
21 Alternative 2: Roadway improvements for this alternative occur along Liberty-Hi Road, from Deshler Road/ SR 18 south to SR 613. No roadway improvements are proposed along SR 613 except for the replacement of several structures under SR 613. A large roadside ditch exists on the west side of Liberty-Hi Road. This ditch is proposed to be left in place by shifting the proposed center line of the roadway to the east. Liberty-Hi would be widened from the existing 20-foot wide pavement to 24 feet with 8-foot shoulders on either side. Four homes will be taken for the implementation of this design. Alternative 3: Alterative 3 proposes roadway improvements along Liberty-Hi Road and Cygnet Road (Township Highway 3). A large ditch exists on the east side of Liberty-Hi Road and the ditch crosses under Liberty-Hi to the west at the Hammansburg Road intersection (heading north). The proposed roadway is aligned to avoid this ditch. Liberty- Hi would be widened from the existing 20-foot wide pavement to 24 feet wide with 8-foot shoulders on either side. Along the Cygnet Road section of the alternative, the center line of the proposed roadway has been shifted north to avoid the existing ditch to the south side. Cygnet would be widened from the existing 22 feet of pavement to 24 feet with 8-foot shoulders on either side. Six homes would be taken for the implementation of this design. Alternative 4: Alternative 4 extends along Liberty-Hi Road and Belmore Road to the S. Main Street/SR 18 intersection. This alternative incorporates improvements of the existing roadways and a new alignment, not along an existing roadway. The proposed improvement along Belmore Road, which is currently 14 feet wide, follows the existing center line of the roadway. Belmore Road is proposed to be widened to 24 feet with 8-foot shoulders on either side. The roadway shifts north at the intersection of Belmore and Mitchell due to a cemetery located on the south side of Belmore Road. The new alignment, not along an existing roadway, starts at Mitchell Road and continues to S. Main Street/ SR 18 through existing active agricultural fields and would be 24 feet with 8-foot shoulders on either side. Three buildings would be impacted for the implementation of this design. 4.4 Roundabouts Modern roundabouts were considered as alternative intersection controls at the following locations: Alternative 1 o SR 18/Main Street/North Baltimore Road intersection Alternative 2 o SR 18/Liberty-Hi Road intersection o SR 613/CR 139 intersection 18
22 Alternative 3 o SR 18/Liberty-Hi Road intersection o Cygnet Road/Liberty-Hi Road intersection Alternative 4 o SR 18/Main Street/North Baltimore Road intersection o Belmore Road/Liberty-Hi Road intersection o SR 18/Liberty-Hi Road intersection The design of a modern roundabout requires balancing the competing needs for a safe environment created by restrictive geometry and slow operating speed versus sweeping geometry needed to accommodate the design vehicle. The same roadway geometrics needed to produce slow operating speeds restricts the ability of large vehicles to traverse the intersection. These competing needs require balancing through an iterative design process to determine the three major components of roundabout design: roundabout size, roundabout location, and approach geometry. Since this is a labor intensive process, only the approximate location of these roundabouts with an assumed 250 foot diameter rightof-way is provided on the conceptual roadway layout exhibits. During detailed design, it may be necessary to adjust roadway alignments approaching the roundabouts to achieve the necessary design elements and has not been illustrated on the conceptual exhibits. 4.5 Roadway Improvement Costs To generate a preliminary construction cost estimate for roadway improvements, a cost per foot of proposed roadway was calculated. This cost was based on full-depth replacement of existing roadways and the pavement buildup provided by ODOT District 2. Table 5 provides the estimate of roadway cost per linear foot. The estimated cost of roadway improvements for each alternative is provided in Appendix B-4. As this is a planning level effort, the estimates were based upon standardized costs per linear foot of roadway and do not include detailed, itemized costs. The cost of utilizing roundabouts was not itemized in this study and would be minor compared to the overall project costs. 19


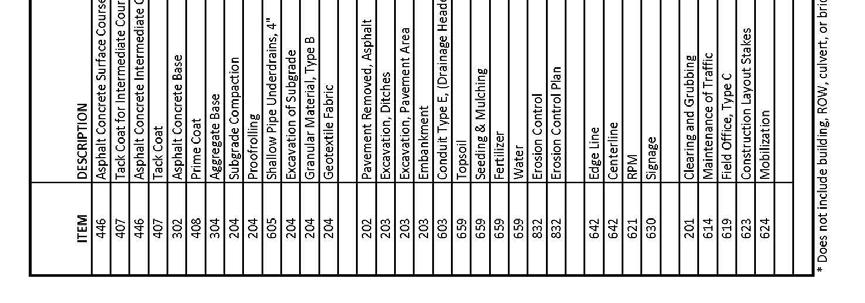
23 TABLE 5 - Roadway Cost Per Lin Ft Estimate 20
24 CHAPTER 5: RIGHT-OF-WAY IMPACTS 5.1 Existing Right-of-Way The existing right-of-way (ROW) locations were acquired from the Wood County Engineers office and from Wood County and Hancock County tax maps. In addition, GIS information from the County Engineer and Auditors offices of Wood and Hancock Counties were compiled. For roadways that had no ROW records, an assumption of a roadway easement was made of 30 feet from the centerline of the existing roadway. No field surveys were conducted to establish or verify existing ROW. A base map for each alterative alignment was prepared with the following overlays: Most current available aerial photography Parcel boundaries Current ownership for the parcels along the proposed alignments Existing roadway widths and ROW limits These base maps were used for creating the proposed roadway alignment exhibits shown in Appendix B Right-of-way Impacts and Cost Estimates EMH&T evaluated potential ROW impacts for each alterative alignment based on the proposed roadway typical section and existing ROW limits. For each alternative, ROW impacts were estimated for each parcel along the alignment. No adjustments were made for the highest and best use land values, no temporary easement assumptions were made, and no individual land appraisals were conducted. Detailed right-of-way impact cost tables for each alterative are located in Appendix C. The tables provide the following information: County Auditor s Parcel ID number Owner name Auditor s Improvement Value Auditor s Total Acreage Auditor s Land Value Auditor s Average Value/Acre Take Acreage Value of ROW Take Value of Improvements (i.e. houses, barns, structures) Total Value of Take 21
25 The following method was used to determine the total ROW acreage take value in dollars ($) necessary for each alternative: For each parcel, total acreage, Auditor assessed land value and Auditor assessed improvement value was retrieved from the Wood and Hancock County Auditors Offices. A land value of $26,750 was used for the estimated value per acre for the parcels in close proximity to the WOO project which is currently under construction. This was based off the average value of the recent property sales in this area. This value was used for all parcels in Alternatives 1 and 4, and the parcels from SR 18 to the Belmore Road intersection for Alternative 2. A value of $2,400 was used for the estimated value per acre for the rest of the parcels unless the Auditor assessed land value was higher. The total land value was divided by the total acreage to get an average value in dollars per acre. The ROW take acreage was calculated for each parcel by determining the difference between the extents of the existing ROW and the proposed ROW. For each parcel, the ROW take acreage necessary for the roadway improvements was multiplied by average value per acre to determine the total cost of the ROW take land value. If there were building/structure impacts on a particular parcel, then the ROW take land value was added to a averaged improvement value to determine the total ROW take in dollars For each alternative, the total take values for each of the parcels were added together for a sum total of ROW impact costs. CHAPTER 6: STRUCTURES ASSESSMENT 6.1 Existing Structures Assessment On March 1, 2011, EMH&T engineers conducted a field visit to the existing bridges and culverts within the study area. All existing bridges, box culverts, pipe culverts, and catch basins located within the limits of the four project alternatives were recorded and an assessment of the physical condition for each structure was performed to determine the recommended improvements. A photo log of the structures in the study area was prepared and is provided in Appendix D-1. Locations of structures proposed to be replaced or widened within the study area are shown on the plan sheet exhibits in Appendix B-3. Please note that four proposed pipe culverts designated as Structures 1, 4, 8, and 11 are proposed to be replaced along SR-613. These structures are not included in the plan sheet exhibits since improvements along this stretch of roadway, except for the culvert replacements, are not proposed. 22
26 6.2 Structure Impacts Based on the proposed roadway typical sections and the proposed roadway alignments, a determination was made as to which of the existing structures would be affected by the proposed improvements. It was determined that any existing pipe culverts 36 in diameter and smaller would be replaced on roadway sections where full-depth pavement replacement will occur. A spreadsheet listing all of the existing structures, recommendation for improvements and the cost of improvements are included in Appendix D-2. The following assumptions were made in the assessment of structure impacts: Private driveway bridges encountered along Alternative 2 and Alternative 3 are assumed to remain without modification. o These structures are utilized by property owners to traverse drainage ditches to access the identified routes. o The horizontal alignment of affected roadways will be shifted slightly to avoid impacts to these structures and the ditches they span. o If the driveway bridges are impacted, the total cost for structure improvements would increase by approximately $600,000 for Alternative 2 and approximately $750,000 for Alternative 3. No existing field drains were observed during our field visit along Alternative 1, however, we have included a contingency cost for the installation of 3-12" CMP's along this stretch of roadway. Regardless of the route chosen, roadway improvements may affect adjacent privately owned drainage conduits. While not a significant cost factor, it has been assumed that the impact will be proportional to roadway improvement length. As part of this assessment, EMH&T contacted the Soil and Water Conservation District of both Wood and Hancock Counties. We learned that many individual property owner records are available, but comprehensive mapping was not available at the time of this report. It is understood that coordination with these agencies and affected property owners will be necessary once the preferred alternative is selected. CHAPTER 7: UTILITY IMPACTS 7.1 Utility Investigation Methodology An investigation was conducted to determine which utilities (both private and public) are present along the alignments of the four identified alternatives. This information is being utilized to determine the extent (both from a physical and a cost standpoint) that utilities will be impacted by the planned roadway improvements. A three-step process was utilized to determine the presence, type and general location of existing utilities along each proposed roadway corridor. 23
27 (1) This investigation began with submittal of OUPS requests for planning information for each of the proposed alternatives. Copies of the OUPS tickets, dated February 24, 2011, are included in Appendix E-1. (2) Follow-up phone calls where then made to all utilities identified on the OUPS request from which mapping information had not yet been received. (3) Finally, field investigations were conducted to identify and verify the physical presence of existing utilities. A table that summarizes the OUPS ticket numbers, utilities identified within the project area, type of information received, and a representative contact for each alternative is provided in Appendix E-1. Copies of all correspondence with accompanied mapping provided from utility owners are included in Appendix E-2, though complete copies of the mapping are not included herewith due to the volume. A complete copy of all utility correspondence and mapping is maintained on-file at EMH&T, Columbus, Ohio. No evidence was found in the field that indicated utilities owned by entities that do not subscribe to OUPS were present. It should be noted that at the time of this report, two utility owners had not provided information. These owners include: Hancock/Wood Electric Hancock County Engineers Office 7.2 Existing Utilities The following is a summary of the utilities identified along each alternative. Locations of all identified utilities along the four alternative alignments are shown on the proposed roadway alignment plan sheets located in Appendix B-3. The descriptions below correspond to the locations shown on the overall planimetric exhibits. ALTERNATIVE 1: Electric: Two aerial crossings (single phase and 3-phase lines) of SR 18 near North Baltimore Road (Owner: AEP). One aerial crossing (single phase) at the proposed intersection of the new roadway and Hough Road (Owner: AEP). One aerial crossing (3-phase) at the connection at the new roadway and Liberty Hi Road (Owner: Hancock/Wood Electric) Communications: The two crossings of SR 18 near North Baltimore Road (identified under electric) and the associated pole lines appear to also have other utilities present. These appear to be communications in nature (Owner: Unknown). 24
28 Natural Gas: An existing 2-inch gas line is present along the south side of SR 18 from North Baltimore Road, east to South Tarr Street (Owner: Columbia Gas of Ohio). ALTERATIVE 2: Electric: One aerial crossing (single phase) along the north side of SR-613 at the intersection with Liberty Hi Road (Owner: Hancock/Wood Electric). Parallel aerial lines (3-phase) along the west side of Liberty Hi Road from SR-613, north to Township Road 113. These lines are located a significant distance outside of the existing roadway corridor. At TR 113, these line cross to the east side of the Liberty-Hi Road where they run parallel with the roadway in close proximity and extend north to the intersection of Liberty-Hi Road and SR 18 (Owner: Hancock/Wood Electric). Aerial electric crossings of Liberty Hi Road were also noted at Township Road 113 (east), County Road 203 (west), Belmore Road (east) along with various service drops to the residences along the roadway (Owner: Hancock/Wood Electric). Communications: Mapping and utility marking posts indicate underground telephone lines along the north side of SR 613, the east side of Liberty Hi Road from SR 613 to CR 203 where it switches to the west side of the road and continues north to Belmore Road. North of Belmore Road, it appears that communications facilities may be present on the electric pole line. Aerial service drops are present along the entire length of Liberty Hi Road.(Owner: Frontier Communications) ALTERNATIVE 3: Electric: Aerial electric (3-phase) is present along the north side of Cygnet Road from the I-75 interchange, west to the intersection with Liberty Hi Road. Aerial crossings are present at Mitchell Road (south), Rudolph Road (north and south) and various service drops for the residences along the route. (Owner: Hancock/Wood Electric) Aerial electric (single phase) is present along the east side of Liberty Hi Road from Cygnet Road, extending south to a point north of Hammansburg Road. The termination point of this line defines the service area limit of Hancock/Wood Electric. Aerial crossings are also present at the intersection with Freyman Road and for various service drops. (Owner: Hancock/Wood Electric) Aerial electric (single phase) is present along the west side of Liberty Hi Road from Hammansburg Road, extending south and terminating at a point south of Needles Road. Aerial crossings are present at Hammansburg Road (east and west), Ohio Oil Road (east and west), Oil Center Road (east and west), Needles Road (west) and for various service drops along the roadway. (Owner: AEP) Aerial electric (single and 3-phase) is present along the west side of Liberty Hi Road from a point north of Quarry Road, extending south to the intersection with SR
29 Aerial crossings are present at Quarry road and for various service drops along the roadway. (Owner: Hancock/Wood Electric) Communications: Underground telephone cable is present along the north side of Cygnet Road from the I-75 Interchange, west to Liberty Hi Road. From there, the cable extends south along the east side of Liberty Hi Road, south to Hammansburg Road, where it crosses to the west side and continues south where it terminates at Needles Road. (Owner: Century Link) An underground fiber optic line runs along the east side of Rudolph Road, crosses Cygnet Road at an angle and then continues north along the west side of Rudolph Road. (Owner: Time Warner Cable) An underground telephone line identified from mapping is present along the west side of Liberty Hi Road from SR 18, north to Needles Road. (Owner: Frontier Communications) Natural Gas: A natural gas transmission main approaches the south side of Cygnet Road near Mitchell Road, parallels the south side of Cygnet Road for approximately 4,000 feet where it then crosses to the north side of Cygnet Road. The main then runs parallel along the north side of Cygnet Road, crosses Liberty Hi Road and continues west. (Owner: Crossroads Pipeline) An 8-inch natural gas transmission main crosses Liberty Hi Road along the north side of Needles Road. (Owner: Suburban Natural Gas) ALTERATIVE 4: Electric: Two aerial electric (single and 3-phase) crossings are present along SR 18 near North Baltimore Road. (Owner: AEP) Aerial electric (single phase) is resent along the south side of Belmore Road from Mitchell Road, west to Hough Road. Aerial crossings are present at Hough Road (north and south) and for residential services. (Owner: AEP) Aerial electric (3-phase) is present along the east side of Liberty Hi Road from Belmore Road, extending north to SR 18. (Owner: Hancock/Wood Electric) Communications: Aerial communications line appear to be on the electric pole lines which cross SR 18 near North Baltimore Road and on the pole lines along the east side of Liberty Hi Road as well. (Owner: Unknown) Natural Gas 2-inch natural gas lines are present along the south side of SR 18 from North Baltimore Road, east of South Tarr Street. (Owner: Columbia Gas of Ohio) 26
30 7.3 Utility Impacts For the purposes of this planning level effort, the following assumptions have been made regarding utility impacts: All utilities within the immediate proposed roadway improvement alignments will be impacted to some extent, with many requiring relocation. (This assumption has been made to ensure a conservative approach to determining total costs for each alternative). The determination regarding if the existing utilities are or are not within existing easements is beyond the scope of this study. Therefore, it has been assumed that the cost for all relocations will be a burden of the improvement. Table 6 provides a summary of the magnitude of the utility impacts anticipated for each alternative. The basis for the cost estimates for each utility impact is presented in Appendix E-3. (Space intentionally left blank) 27
31 TABLE 6 Utility Impacts/Costs ALTERNATIVE UTILITY RELOCATION LENGTH COST (PER FOOT) TOTAL COST Alt. 1 1 Ø OHE 200 feet $4.00 $800 1 Ø OHE w/ 200 feet $6.50 $1,300 OHU 3 Ø OHE w/ 200 feet $10.50 $2,100 OHU 2-inch Gas Line 600 feet $72.00 $43,200 Alt. 1 Total Cost $47,400 Alt. 2 3 Ø OHE 9,800 feet $8.00 $78,400 3 Ø OHE w/ 4,400 feet $10.50 $46,200 OHU 1 Ø OHE w/ 300 feet $6.50 $1,950 OHU OHU 200 feet $4.00 $800 UGT 15,000 feet $8.00 $120,000 Alt. 2 Total Cost $247,350 Alt. 3 3Ø OHE 16,400 feet $8.00 $131,000 1Ø OHE 16,900 feet $4.00 $67,600 UGT 24,900 feet $8.00 $199,200 8-inch Gas 200 feet $ $50,000 Trans line Unknown size 2,000 feet $ $240,000 Gas Trans line UGFO 400 feet $50.00 $20,000 Alt. 3 Total Cost $708,000 Alt. 4 1 Ø OHE 3,000 feet $4.00 $12,000 3 Ø OHE w/ 4,100 feet $10.50 $43,050 OHU 1 Ø OHE w/ 1,200 feet $6.50 $7,800 OHU OHU 200 feet $4.00 $800 2-inch Gas line 600 feet $72.00 $43,200 Alt. 4 Total Cost $106,850 OHE-Overhead Electric OHU-Overhead Utilities UGT-Underground Telephone UGFO- Underground Fiber Optic Cable 28
32 CHAPTER 8: ENVIRONMENTAL ANALYSIS 8.1 Environmental Investigation Methodology A secondary source investigation was conducted to identify environmental resources present along the alignments of the four identified alternatives. This information is being identified to determine the extent these resources may be impacted by the planned roadway improvements. ODOT initially provided EMH&T with environmental resource data for both Wood and Hancock Counties via GIS data files. This secondary source information was filtered to only include the environmental resources located within the study area. Exhibit 4 shows all the identified environmental resources included in the GIS information supplied by ODOT for the study area. Additional environmental resources information was gathered for the study area by completing the following: The Ohio Historic Preservation Office (OHPO) website was reviewed for known Cultural Resources cites within the four alignment corridors. The information obtained from the OHPO website is included in Appendix 8-A. The Wood and Hancock County Auditors Offices were contacted about potential agricultural districts and Current Agricultural Use Value (CAUV) assessment program parcels within the areas of the four alignment corridors. Staff members from each Auditor s office reviewed the alignment corridors and supplied parcel information for any properties that are included in an agricultural district or participate in the CAUV program. The Wood County Comprehensive Plan Update was also reviewed to research prime farmland locations in reference to the alignment corridors. The information received from the Wood and Hancock County Auditor s offices and a copy of the Wood County Comprehensive Plan update are included in Appendix 8-B. The Wood and Hancock County Park Districts were contacted about public recreation areas that would qualify as 4(f) and 6(f) resources located in the alignment corridors. The information received from the Wood and Hancock County Park Districts appear in Appendix 8-C. The United States Fish and Wildlife Service (USFWS) published list of endangered and threatened species in Ohio (January, 2011) was reviewed for Hancock and Wood Counties to determine if any endangered and/or threatened species have the potential to be located within the alignment corridors. The USFWS published list of endangered/threatened species appear in Appendix 8-D. A review of the Ohio Department of Natural Resources (ODNR) Natural Heritage maps and files was also completed and this information appears in Appendix 8-D. A review of the aerial photographs and roadway improvement plans, shown on the exhibits in Appendix B-3, was completed to identify other potential environmental impacts not identified by other data sources. This review looked at other potential structure impacts and potential stream/wetland areas not adjacent to existing roadway alignments. 29
33 The Federal Emergency Management Agency (FEMA) Flood Insurance Rate Maps (FIRM) was reviewed for the four alignment corridors. These FEMA Flood Insurance Rate Maps appear in Appendix 8-E. To get a preliminary overview of the air quality surrounding the project area, the Ohio County Air Quality non-attainment and maintenance map was reviewed for Wood and Hancock Counties and is included in Appendix 8-G. 8.2 Environmental Justice The United States Census Bureau factsheets were reviewed for the Village of North Baltimore, Wood County and Hancock County to determine if there is a potential for any environmental justice populations within the study area. The Census Bureau Factsheet for the Village of North Baltimore appear in Appendix 8-F. The Wood County Comprehensive Plan Update was also reviewed to examine population trends within the area of the four alternative corridors. A copy of the Wood County Comprehensive Plan Update is located in Appendix 8-B. Based on the Census Bureau information for the Village of North Baltimore, Wood County and Hancock County, there appears to be no demographic or economic populations within the study area that would indicate an environmental justice issue. However, as this project becomes better defined with a chosen alternative, additional investigations will be made into appropriately addressing potential environmental justice impacts. 8.3 Air Quality and Noise Per 23 CFR 772, Procedure for Abatement of Highway Traffic Noise and Construction Noise (Effective July 2011), Federal Highway Traffic Noise Policy and Guidance (July 2010) and ODOT Noise Standard Procedure (February 2010), a noise analysis is required for federally funded projects that either construct a highway on a new location or alter an existing highway such that there is a substantial change in either alignment or the number of through-traffic lanes. Because of the increase in truck traffic volumes generated by the new CSX Intermodal Facility and the associated roadway improvements that could increase travel lanes or construct new roadways, a noise analysis may be required for this project. The noise policy should be reviewed once a preferred roadway alignment is selected. Because the project has potential to add capacity and a new road on a new alignment, a Mobile Source Air Toxins Analysis (MSAT) could be required. Since the study area is located in Wood and Hancock Counties and these counties are not identified as a Particulate Matter 2.5 (PM 2.5) Non-Attainment or maintenance area, no PM 2.5 analysis is required. A carbon monoxide (CO) analysis may be required if the project results in an increase in the ADT of more than 10,000 vehicles within 10 years of the project completion date or if the project involves new right-of-way that will have an ADT of more than 20,000 vehicles within 10 years of construction. As far as Ozone analysis, if the project is listed in the STIP/TIP, then ozone concerns have been addressed. 30
34 8.4 Environmental Resource Impacts Impacts to environmental resources are based upon the roadway improvements proposed for the four alternative alignments. It is assumed that the environmental resources within the immediate roadway corridor would be impacted to some extent. The actual impacts to these resources could vary depending on the further design and refinement of the roadway improvements. The following is a summary of the extent of environmental resource impacts anticipated for each alternative. For the purposes of this feasibility study, roadside ditches (where present) have been assumed to be potential streams. It should be noted, however, that many of these ditches contain hydrophytic vegetation (e.g. cattails) and may ultimately be determined by the U. S. Army Corps of Engineers to constitute linear wetlands. Wood County is predominately agricultural, with approximately 90% of the land in the county being farmed. The majority of right-of way impacts will occur to parcels in agricultural production. The relative impact of this project to farming in the region is not anticipated to be significant based on the overall volume of remaining agricultural land. In addition, based on the Projected Land Use provided in the Wood County 2007 Comprehensive Plan Update, the area surrounding the CSX Facility and stretching east to I- 75 has been identified for major highway upgrades to support expanding commercial and industrial development. This key corridor area encompasses the alignments for Alternatives 1 and 4 and has been identified for major highway upgrades to support expanding commercial and industrial development. Alternatives 2 and 3 are outside the key corridor designated areas. ALTERNATIVE 1: Wetlands/Streams: Impacts to streams or wetlands are not anticipated under this alternative. Cultural Resources: There are no known Cultural Resources within the alignment and none are anticipated to be impacted for this alternative. NOTE: The Historic Sites located at 318 and 400 South Main are located north of alignment corridor and are outside the proposed impact area. Cemeteries: No cemeteries are proposed to be impacted as part of this alignment. Maplewood Cemetery is located at the southwest corner of Mitchell Road and Belmore Road, south of SR 18. The proposed alignment is located north of the Maplewood Cemetery. 31
35 4 (f)/6(f) Resources: Birch Run Golf Course-Public Golf Course (PN: F /F ) (labeled on plan sheets in Appendix B-3) o Birch Run Golf Course is a 4(f) resource but not a 6(f) resource. o A small area of the Birch Run Golf Course along SR-18 may be impacted as part of this alternative. o The roadway may be able to be aligned to completely avoid this resource; this determination will need to be made during further engineering design. Agricultural District/CAUV (Current Agricultural Use Value) Program Parcels along alternative: CAUV parcels impacted within Wood County F F F F F F F F An approximate total of 18 acres of CAUV land is proposed to be impacted by this alternative. No CAUV Program parcels are being impacted in Hancock County. Endangered/Threatened Species: A total of three federally listed endangered/threatened species are known to occur in Wood and Hancock Counties: Myotis sodalis (Indiana bat), Pleurobema clava (clubshell mussel), and Villosa fabalis (Rayed bean mussel). No suitable habitat appears to be present for the clubshell mussel and rayed bean mussel, but this would need to be field verified during further design. No impacts to these species are anticipated. During further design, all trees within the project corridor(s) will need to be investigated for their potential to provide suitable bat habitat and appropriate coordination with the US Fish and Wildlife Service will need to be conducted. Floodplains: The Alternative 1 corridor is located on two (2) FIRM panels: B and B. The majority of the alignment corridor is located in 32
36 Zone C which is designated as areas of minimal flooding. The portion of the corridor located along Deweyville Road at the eastern termini of the alignment is located in Zone A3 which is designated as areas of 100-year flood where base flood elevations and flood hazard factors are determined. The Zone A3 area is associated with the Rocky Fork Creek and Rocky Fork Creek Tributary. Potential ESA Sites: No potential ESA sites will be impacted (based solely on GIS data supplied by ODOT). ALTERNATIVE 2: Wetlands/Streams: Potential streams are located along both sides of Liberty Hi Road, south of SR 18 extending to SR 613. These are generally low quality stream habitats (i.e. manmade roadside ditches). These areas will not be impacted by this alternative. Approximately 16 linear feet of potential stream impact will be required for the lengthening of an existing box beam bridge at a stream crossing under Liberty Hi Road, as indicated on Alternative 2 Sheet 2 in Appendix B-3. The impacted stream consists of low to medium quality habitat. Cultural Resources: WO0343-OHI prehistoric site (PN: ) HK0079-OHI prehistoric site (PN: ) These two prehistoric sites are located on parcels within the potential impact area of this alternative. Their locations are in close proximity to the alignment corridor. Additional information will need to be collected to determine the extent of impact and the quality of these two sites. Cemeteries: Ten Mile Cemetery (PN: ) (labeled on plan sheets in Appendix B-3) o A small area of the Ten Mile Cemetery along the western edge of Liberty Hi Road may be impacted as part of this alternative. Impacts will be in areas that do not appear to be used for burial, but this would need to be verified during preliminary design and areas for burial should be avoided. o The roadway may be able to be aligned to completely avoid this resource; this determination will need to be made during further engineering design. 33
37 4 (f)/6(f) Resources: There are no public owned parks, recreational areas or wildlife/waterfowl areas within the alternative alignment that would be classified as a 4(f)/6(f) resource. If based on additional information, the two prehistoric sites listed above are determined to be eligible for the National Register and are proposed to be impacted as part of the alignment, these sites would also require 4(f) coordination. No 4(f) or 6(f) resources are anticipated to be impacted by this alternative. Alternative 2 is not expected to require Section 4(f) coordination, assuming no significant cultural resources site are identified further investigations. Agricultural District/CAUV (Current Agricultural Use Value) Program Parcels along alternative: CAUV Parcels impacted within Wood County F F F F F F F F F No CAUV Program parcels are being impacted in Hancock County. An approximate total of 5.2 acres of CAUV land is proposed to be impacted by this alternative. Endangered/Threatened Species: A total of three federally listed endangered/threatened species are known to occur in Wood and Hancock Counties: Myotis sodalis (Indiana bat), Pleurobema clava (clubshell mussel), and Villosa fabalis (Rayed bean mussel). No suitable habitat appears to be present for the clubshell mussel and rayed bean mussel, but this would need to be field verified during further design. No impacts to these species are anticipated. During further design, all trees within the project corridor(s) will need to be investigated for their potential to provide suitable bat habitat and appropriate coordination with the US Fish and Wildlife Service will need to be conducted. Floodplains: The Alternative 2 corridor is located on two (2) FIRM panels: B and B. The majority of the corridor is located in Zone X which is designated as areas of minimal flooding. The small portion of the corridor located along Liberty Road, just south of County Road 203, is located in Zone 34
38 A which is designated as areas of 100-year flood where base flood elevations and flood hazard factors are determined. This Zone A area is associated with the Ten Mile Creek (R.B. Worden Ditch). Potential ESA Sites: No potential ESA sites will be impacted (based solely on GIS data supplied by ODOT). ALTERNATIVE 3: Wetlands/Streams: Potential Stream/Wetland areas located along the western side of Liberty Hi Road from SR 18 to Hammansburg Road, north of SR 18. These are generally low quality stream habitats (i.e. manmade roadside ditches). These areas will not be impacted by this alternative. Potential Stream/Wetland areas are located along the eastern side of Liberty Hi Road from Hammansburg Road to Cygnet Road, north of SR 18. These are generally low quality stream habitats (i.e. manmade roadside ditches). These areas will not be impacted by this alternative. Potential Stream/Wetland areas are located along Cygnet Road from Liberty Hi Road to Interstate 75. These are generally low quality stream habitats (i.e. manmade roadside ditches). These areas will not be impacted by this alternative. A total of approximately 130 linear feet of potential stream impacts will be required for the extension of several existing culverts under Liberty Hi Road and Cygnet Road, as well as the lengthening of a box beam bridge under Cygnet Road, as indicated on Alternative 3 Sheets 4-7 in Appendix B-3. The impacted streams represent generally low to medium quality stream habitat. Cultural Resources: WO0485-OHI historic site (PN: F ) WO0486-OHI historic site (PN: F ) These two historic sites are located on parcels within the potential impact area of this alternative. Their locations are in close proximity to the alignment corridor. Additional information will need to be collected to determine the extent of impact and the type of historic importance of these two sites. Cemeteries: No cemeteries are located within the area of the alignments and none appear to be impacted as part of this alternative. 35
39 4 (f)/6(f) Resources: Slippery Elm Trail (labeled on plan sheets in Appendix B-3) o Based on discussions with the Wood County Park District the Slippery Elm Trail is a 4 (f) resource but not a 6 (f) resource. o This trail crosses over Cygnet Road east of Liberty-Hi Road. o Minor impacts to the trail, on both sides of Cygnet Road, will likely occur due to roadway widening, with portions of the trail being incorporated into the transportation infrastructure. Cricket Frog Cove Area o Based on discussions with the Wood County Park District the Cricket Frog Cove Area is a 4 (f) resource but not a 6 (f) resource. o The roadway could be designed to completely avoid or minimize impacts to this resource. If based on additional information, the two historic sites listed above are determined to be eligible for the National Register and are proposed to be impacted as part of the alignment, these sites would also require 4(f) coordination. Agricultural District/CAUV (Current Agricultural Use Value) Program Parcels in alternative: CAUV Parcels impacted within Wood County F F F F F F F F F F F F F F F F F F F F F F F F F F F F F F F F F F F F F F F F F F F F F F
40 F F F F F F F No CAUV Program parcels are being impacted in Hancock County. An approximate total of 36.6 acres of CAUV land is proposed to be impacted by this alternative. Endangered/Threatened Species: A total of three federally listed endangered/threatened species are known to occur in Wood and Hancock Counties: Myotis sodalis (Indiana bat), Pleurobema clava (clubshell mussel), and Villosa fabalis (Rayed bean mussel). No suitable habitat appears to be present for the clubshell mussel and rayed bean mussel, but this would need to be field verified during further design. No impacts to these species are anticipated. During further design, all trees within the project corridor(s) will need to be investigated for their potential to provide suitable bat habitat and appropriate coordination with the US Fish and Wildlife Service will need to be conducted. Floodplains: The Alternative 3 corridor is located on two (2) FIRM panels: B and B.The entire corridor for Alternative 3 is located in Zone C which is designated as areas of minimal flooding. Potential ESA Sites: No potential ESA sites will be impacted (based solely on GIS data supplied by ODOT). ALTERNATIVE 4: Wetlands/Streams: Potential stream/wetland areas are located along both sides of Liberty Hi Road, south of SR 18. These are generally low quality stream habitats (i.e. manmade roadside ditches). These areas will not be impacted by this alternative. Potential stream/wetland areas are located along both sides of Belmore Road until just west of Mitchell Road. These are generally low quality stream habitats (i.e. manmade roadside ditches). These areas will not be impacted by this alternative. 37
41 Approximately 20 linear feet of potential stream impact will be required for the lengthening of a culvert at a stream crossing under Belmore Road, as indicated on Alternative 4 Sheet 2 in Appendix B-3. The impacted stream consists of low quality stream habitat. Cultural Resources: No Cultural Resources appear to be impacted. NOTE: The Historic Sites located at 318 and 400 South Main, shown on Exhibit 4, are located north of alignment corridor and are outside the proposed impact area. Cemeteries: Maplewood Cemetery is located at the southwest corner of Mitchell Road and Belmore Road, south of SR 18. The proposed roadway plans shift the alignment to the north of the cemetery, thereby proposing to avoid impacting the cemetery. 4 (f)/6(f) Resources: Birch Run Golf Course-Public Golf Course (PN: F /F ) (labeled on plan sheets in Appendix B-3) o Birch Run Golf Course is a 4(f) resource but not a 6(f) resource. o A small area of the Birch Run Golf Course along SR 18 may be impacted as part of this alternative. o The roadway could be able to be aligned to completely avoid or minimize impacts to this resource. Agricultural District/CAUV (Current Agricultural Use Value) Program Parcels: CAUV Parcels impacted within Wood County F F F F F F F F F F F F F F No CAUV Program parcels are being impacted in Hancock County. An approximate total of 14.3 acres of CAUV land is proposed to be impacted by this alternative. Endangered/Threatened Species: A total of three federally listed endangered/threatened species are known to occur in Wood and Hancock Counties: Myotis sodalis (Indiana bat), Pleurobema clava (clubshell mussel), and Villosa fabalis (Rayed bean mussel). 38
42 No suitable habitat appears to be present for the clubshell mussel and rayed bean mussel, but this would need to be field verified during further design. No impacts to these species are anticipated. During further design, all trees within the project corridor(s) will need to be investigated for their potential to provide suitable bat habitat and appropriate coordination with the US Fish and Wildlife Service will need to be conducted. Floodplains: The Alternative 4 corridor is located on two (2) FIRM panels: B and B. The majority of the corridor is located in Zone C which is designated as areas of minimal flooding. The portion of the corridor located along Deweyville Road at the eastern termini of the alignment is located in Zone A3 which is designated as areas of 100-year flood where base flood elevations and flood hazard factors are determined. The Zone A3 area is associated with the Rocky Fork Creek and Rocky Fork Creek Tributary. Potential ESA Sites: No potential ESA sites will be impacted (based solely on GIS data supplied by ODOT). CHAPTER 9: COST SUMMARY, TIMING FACTORS AND COMPARISON MATRIX 9.1 Cost Summary This section of report provides a total preliminary construction cost for each of the four proposed alternative alignments. The total estimated probable construction cost is a sum of the costs associated with roadway improvements, right-of-way acquisition, building demolition, structure replacements, and utility impacts, as provided in the earlier sections of this document. Table 7 depicts the summary of probable construction costs for each alternative (table also located in Appendix G-1). 39
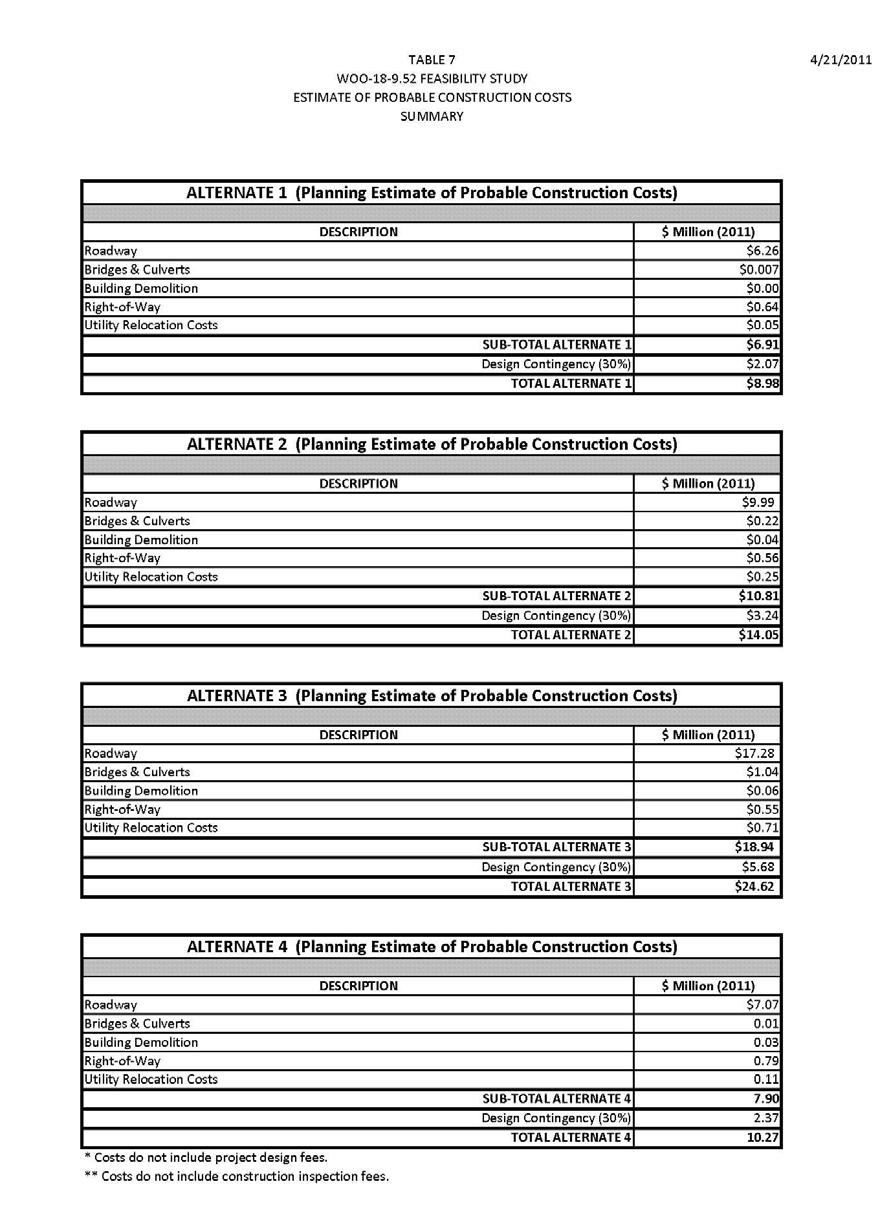
43 40
44 The estimate of probable building demolition costs for each alterative is provided in Appendix G-2. A 30% contingency value was included in the calculation of the total cost. This contingency value was determined using the ODOT Design Completion Risk Guidelines for Cost Estimating of Major Projects (provided in Appendix G-3) and is based on an approximate 5% design completion. 9.2 Timing Factors Design and Environmental Clearance: Because the design and environmental clearance processes overlap, for timing purposes they are considered as one unit. With the understanding that this project would be a priority to ODOT and could advance swiftly through the project development process, Alternative 1 and Alternative 4 should take approximately 8 months to complete detailed design and obtain environmental clearance. Alternative 2 and Alternative 3 would take approximately 16 months to complete design and environmental clearance due to the overall project lengths of these two alternatives. Right-of-Way (ROW) Acquisition: All alternatives would require right-of-way (ROW) acquisitions in order to implement the proposed transportation improvements. Alternative 1 would require approximately 8 mounts to obtain ROW through the ODOT ROW acquisition process (this alternative would neither incur structure impacts nor require any relocations). Alternative 4 could result in several structure impacts and relocations which would likely add an additional 6 months to the ROW acquisition time, extending the ROW process to 14 months for this alternative. Alternative 2 would take approximately 18 months and Alterative 3 would take approximately 24 months to acquire all ROW through the ODOT process due to the volume of ROW necessary to complete these roadway improvements. Construction: Based on a typical construction season, lasting from approximately March/April through October/November, the duration of construction for each alternative was estimated. Alternative 1 would be the quickest route to implement, with construction lasting approximately 6 months to 9 months. Alterative 4 would take approximately 9 months to 12 months to construct. Alternative 2 and Alternative 3 would take the longest to construct, because of the lengths of roadway improvements, both having construction durations of approximately 15 months to 18 months. 9.3 Alternatives Comparison Matrix A comparison matrix of the four alternative alignments was prepared that compares the critical design, cost and timing elements of each alternative. The matrix includes the following comparison factors: Estimated average travel time (seconds) 41
45 Length of roadway improvements (linear feet) Right-of-way impacts (acres) Building impacts (number of buildings) Parcel impacts (approx. no. of parcels) Bridge/Culvert impacts (number of structure replacements) Utility Relocations (number and type of utilities) Known cultural resources impacts (yes/no/maybe) Farmland impacts (acres of CAUV* farmland) Potential Wetland/Stream impacts (yes/no) Potential Section 4(f) coordination (yes/no/maybe) Constructability and Maintenance of Traffic (Good, Fair, Poor) Estimated construction costs ($ Million (2011)) Estimated design duration (months) Estimated right-of-way acquisition duration (months) Estimated construction time (months) A copy of the alternatives comparison matrix is provided in Table 8 and is also located in Appendix H. (This space left intentionally blank) 42

46 TABLE 8 Alternatives Comparison Matrix 43