Fold, Hold, Double Up - which hand to play next?
|
|
|
- Tyrone Matthews
- 5 years ago
- Views:
Transcription
 10th Annual Capital Link")
1 Fold, Hold, Double Up - which hand to play next? Dr Adam Kent - Maritime Strategies International (MSI) 10th Annual Capital Link Shipping, Marine Services & Offshore Forum
2 Fold, Hold, Double Up - which hand to play next? Agenda 1. Demand 2. Supply 3. Earnings 4. Newbuilding Prices 5. Secondhand Prices 6. The Winning Hand? Maritime Strategies International 2


3 Fold, Hold, Double Up Demand Maritime Strategies International

4 Seaborne Cargo Growth - Positive Positive cargo growth across the board Maritime Strategies International
5 Average Annual Cargo Growth Relative Ranking Historical Forecast Ranking Movement (Forecast v Historical) Maritime Strategies International 5

6 Incremental Product Imports Strong products growth towards end of decade Maritime Strategies International 6
7 China and Cape Market Dynamics Chinese Share of Discharge by Vessel Size Chinese Ore Production Dynamics Changing 100% 90% 80% 70% 60% 50% 40% 30% 20% 10% China Other 0% k Dwt k Dwt 120+ k Dwt Capesize remains a China bet EAF steel production increase and the end of domestic ore substitution limits upside Maritime Strategies International 7

8 Support from Non Mainlane Trades North-South trades supporting mainlane recovery Maritime Strategies International 8

9 Organic Chemical Growth Imbalance will drive trade Maritime Strategies International 9
10 Cargo Growth Only Presents Part of the Picture Maritime Strategies International 10


11 How Many Ships? Routes Distance Speed Waiting/Port Time Operating Days Ballast Ratio Carrying Capacity Size Changes Maritime Strategies International 11
12 Incremental Vessel Requirements (H )* 300 # of Vessels Crude Oil Product Chemicals * Assuming a current supply-demand equilibrium LPG LNG Maritime Strategies International 12 Bulker Container PCTC Cruise AHTS
13 Full Picture Includes Supply Maritime Strategies International 13
14 Fold, Hold, Double Up Supply Maritime Strategies International
15 Vessel Requirements (H ) v s Current Orderbook 350 # of Vessels Ships Required Ships on order Over supply Crude Oil Product Chemicals LPG LNG Bulker Container PCTC Cruise AHTS Maritime Strategies International 15

16 Supply Side - 3 Card Trick Maritime Strategies International 16

17 Contracting as % of Fleet Contracting historically low * Includes MSI s forecast assessments for contracting, scrapping, slippage and cancellations Maritime Strategies International 17

18 Cancellations - Cancellations generally trending down Maritime Strategies International 18


19 Fleet Age Profile Youngest Fleet Oldest Fleet Maritime Strategies International 19
20 When to Fold - Average Age At Scrap 40 Average Age Oil Tanker Bulker Chem Tankers LPG Carriers Containerships Dry Cargo Reefer Vehicle Carrier Maritime Strategies International 20

21 Differentiating Hands Dry Bulk Effective Speed* Deck stacked against older tonnage? * Calculation is representative of port-to-port speed, including slow steaming, anchoring, waiting etc. Maritime Strategies International 21

22 Average Annual Fleet Growth Supply odds favourable * Includes MSI s forecast assessments for contracting, scrapping, slippage and cancellations Maritime Strategies International 22

23 Fold, Hold, Double Up Earnings Maritime Strategies International


24 Where on the Earnings Cycle Are We? Schematic for illustrative purposes only! Crude and Product Tanker OSVs LPG Carrier Rigs LNG MPP Chemical Tanker PCTC Container Bulker RoRo Maritime Strategies International

25 Earnings Maritime Strategies International 25

26 Fold, Hold, Double Up Newbuilding Prices Maritime Strategies International
27 Forward Cover = Pricing Power MSI s Shipbuilding Model Sector Specific Freight Rates Regional Yard Developments & Capacity Sector Specific Contracting Global Yard Capacity Global Orderbook Forward Berth Cover (years) Average Yard Price Index ($ CGT) Newbuilding Price (by vessel type by size) Global Cost Components (steel & machinery price, exchange rates) Regional Cost Components (wage, inflation, productivity) Weighted Average of Yard Costs Costs = Pricing Floor Maritime Strategies International Ltd. 27

28 Shipyard Deliveries versus Contracts 2017 YTD Yards are being dealt a dead man s hand Deliveries > Contracts Maritime Strategies International 28
29 Big Shipyards- Orderbook Health & Sustainability Mid 2015 Size of bubble = Orderbook in GT Maritime Strategies International 29
30 Big Shipyards- Orderbook Health & Sustainability Mid 2017 Size of bubble = Orderbook in GT Maritime Strategies International 30

31 Shipyard Capacity & Forward Cover Further capacity cuts Forward Cover = Shipyard Capacity, Orderbook ratio Maritime Strategies International 31
32 Cost Index Index 2009= 100 Weighted Average Index Korea Japan China 130% 120% 110% 100% 90% 80% 70% 60% Maritime Strategies International 32

33 Newbuilding Price Outlook Trough Zone Reduction in capacity along with ordering volumes and rising costs push up NB prices Maritime Strategies International 33

34 Fold, Hold, Double Up Secondhand Prices Maritime Strategies International

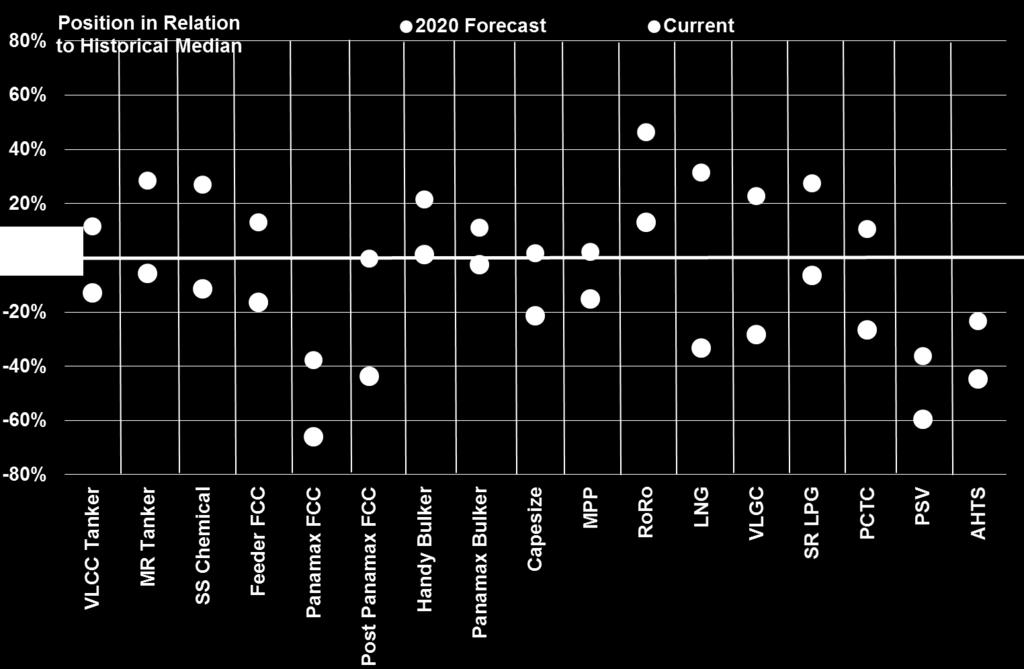
35 5 Year Old Prices Worst Hand Has Been Played The secondhand trough has been passed for the majority of sectors Maritime Strategies International 35

36 Fold, Hold, Double Up The Winning Hand Maritime Strategies International


37 MSI - FMV MSI Forecast Marine evaluator (FMV) is the first web-based tool to provide forecast and historical price data covering virtually all of the deepsea shipping fleet. Data includes forecasts of newbuilding, second-hand prices, 1 year timecharter rates and operating costs for specific vessels. MSI FMV draws on MSI s proven, proprietary models and a consistent cross-sectional view across all principal shipping sectors. It puts asset values in the context of the near term market to enable reliable benchmarking with outputs based on annual averages. Coverage: Crude Oil Tanker Chemical Tanker Multi Purpose Product Oil Tanker LPG Carrier Containership Dry Bulk Carrier LNG Carrier PCC/PCTC AHTS /fmv PSV Maritime Strategies International 37
38 Pure Asset Play Maritime Strategies International 38
39 Yet To See How the Trump Card Plays Out! or Thank You For Listening! Maritime Strategies International 39
40 MSI Background For over 30 years, MSI has developed integrated relationships with a diverse client base of financial institutions, ship owners, shipyards, brokers, investors, insurers and equipment and service providers. MSI s expertise covers a broad range of shipping sectors, providing clients with a combination of sector reports, forecasting models, vessel valuations and bespoke consultancy services. MSI is staffed by economists and scientists offering a structured quantitative perspective to shipping analysis combined with a wide range of industry experience. MSI balances analytical power with service flexibility, offering a comprehensive support structure and a sound foundation on which to build investment strategies and monitor/assess exposure to market risks. Maritime Strategies International 40
41 Disclaimer While this document has been prepared, and is presented, in good faith, Maritime Strategies International assumes no responsibility for errors of fact, opinion or market changes, and cannot be held responsible for any losses incurred or action arising as a result of information contained in this document. The copyright and other intellectual property rights in data, information or advice contained in this document are and will at all times remain the property of Maritime Strategies International. Maritime Strategies International 41
207 940 0070 Fax: +44 (0)207 940 0071 Email:")
42 Maritime Strategies International Ltd 6 Baden Place Crosby Row London SE1 1YW United Kingdom Tel: +44 (0) Fax: +44 (0) info@msiltd.com