Enabling Lean Manufacturing through ERP
|
|
|
- Clementine Parrish
- 5 years ago
- Views:
Transcription
1 Enabling Lean Manufacturing through ERP T.G.Dhandapani Group CIO Sundaram-Clayton Limited 1
2 Agenda Introduction Digitizing Lean in ERP Ecosystem Problem and baseline metrics Digitized Pull system Digitized TPM Benefits Interactions 2
3 Technology The first rule of any technology used in business is that automation applied to an efficient operation will magnify the efficiency. The second is that automation applied to an inefficient operation will magnify the inefficiency Enabling Lean manufacturing - through Bill Gates 3
4 Power of Digitization Lean your process improve, eliminate and automate steps Manage by exception Automate information flow from P2E and E2E Integrate people and their roles and functions 4
5 Power of Digitization Customize to individual work styles and decision making Manage and audit production process more effectively and consistently Share production best practices and collaborate on process 5
6 What is Lean? Balanced use of people, equipment and material that gives lowest manufacturing cost Lowest manufacturing cost assumes all wastes is eliminated Supply of material as per customer requirement as and when required with specified quality and quantity Lean = management of Waste 6
7 Drivers of Lean Cost element Drivers Material cost Value engineering Value addition Processing Energy, logistics, cost consumables, equipment Personal cost maintenance Low cost automation, people Finance cost Inventory asset 7
8 8
9 9
10 10


11 QS 9000 Certification TQM - Group s TQM Journey TQM journey and Recognitions TQM Introduction TQM Promotion Deployment Deming Prize ISO Certification ACMA Technology Award Japan Quality Medal ACMA Gold Trophy for Overall Manufacturing Excellence ERP & WEB linked supply chain Milk run TPM initiatives Lean manufacturing initiatives
12 Business ecosystem Single supplier Variety complexity Varying demand High value propriety products Non propriety small vendors 12
13 Problem and base level metrics Key performance areas Measure Customer complaints per month 7 Delivery service level 70% Premium dispatches pa 721 Stock in pipeline Nonmoving stock in transporters godown for > 60 days Line stopper due to supplier parts - % man hours lost 20 crores 3.30 crores 3.5% Value added per employee 19 Inventory turn 23 13


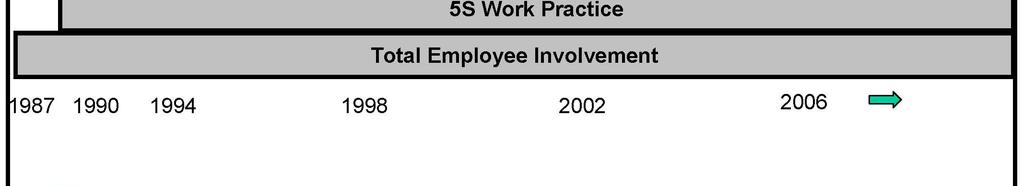
14 Lean journey in TVS M 14
15 Seven step approach for Lean manufacturing Steps Metrics Step 1: Value stream mapping Process ratio in percentage Step 2: Create a flow Step 3: Balance to takt time Step 4: Stabilize the production - TPM Step 5: Improve flow Step 6: Zero defect Single piece flow Ratio between cell bottleneck time and takt time OLE of the cell, Lost cost tree Percentage of missed cards per shift, service level, inventory turnover PPM Step 7: Leveled production Every part every day / every shift / every hour 15
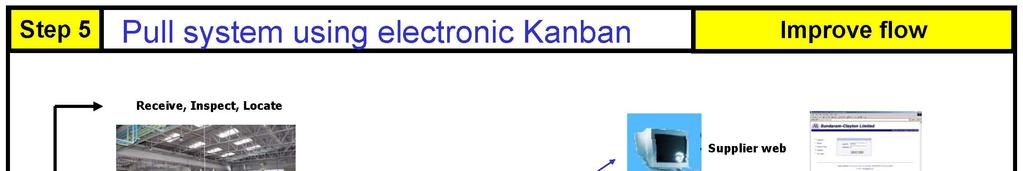
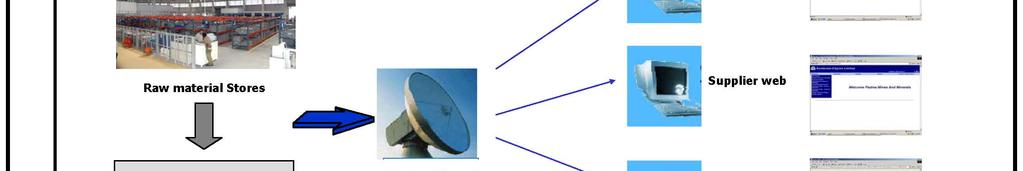
16 Seven step approach for Lean manufacturing Steps Metrics SAP tools/modules Step 1: Value stream mapping - Process ratio in percentage Step 2: Create a flow Single piece flow Step 3: Balance to takt time - Ratio between cell bottleneck time and takt time Routing Step 4: Stabilize the production - loss elimination through TPM Step 5: Improve flow - paced withdrawal pull system Step 6: Zero defect poka yoke, Kaizen, PM analysis OLE of the cell, Lost cost tree Percentage of missed cards per shift, service level, inventory turnover PPM Step 7: Leveled production - Every part every day / every shift / every hour PM, CO XI, PP, electronic Kanbhan, ITS server QM / PM 16
17 Pull system using SAP 17


18 Pull system in manufacturing Production Marketing Customer Supplier Purchase Stores Units SWH Netting with Min.norms Issue Order Schedule MRP MRP Generate MRP Resource planning Produce M/c shop Assembly 2 weeks - daily 4 weeks Ten. Produce Produce Pull I WIP Transfer 18
19 Replenishment signal in a pull system Replenishment signal PO Strategic buffer WH near customer Vendo r Consumption 6 days vendor lead time Strategic buffer on site 3 Days Manufacturing lead time JIT supply to customer Replenishment signal for Mfg 19


20 SCL - Multi purpose bar coded cards Kanban card for triggering production Identification label Documentation of production confirmation Documentation of backflushing Delivery document creation FIFO control 20

21 21

22 e Kanban status for vendors Vendor Kanban details on-line display in WEB 22
23 TPM through SAP Plant Maintenance module 23
24 TPM Targets P Productivity - Achieve 85% OEE minimum Q Quality - Reduce rejections by 50%. Zero defect products to customer. C Cost - Reduce manufacturing cost by 20%. D Delivery - Supply 100% as per customer requirement S Safety - Achieve Zero accident M Man - Achieve 30 suggestions per employee per year 24
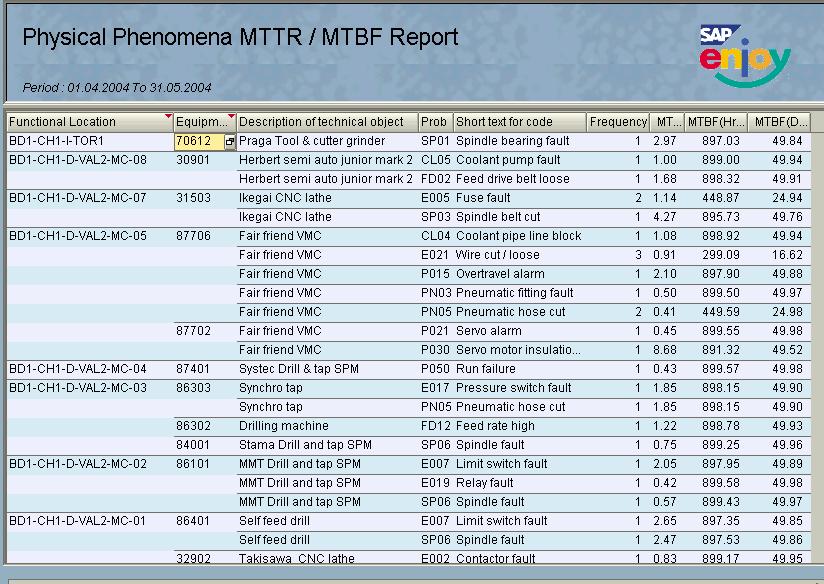
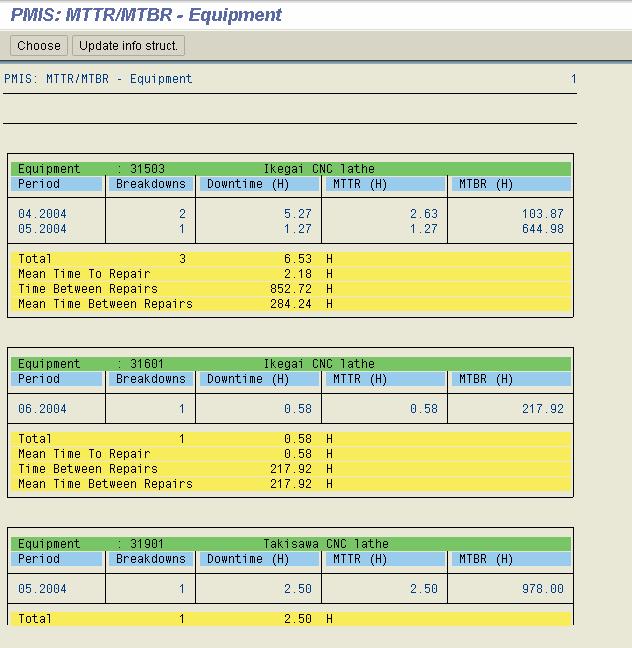
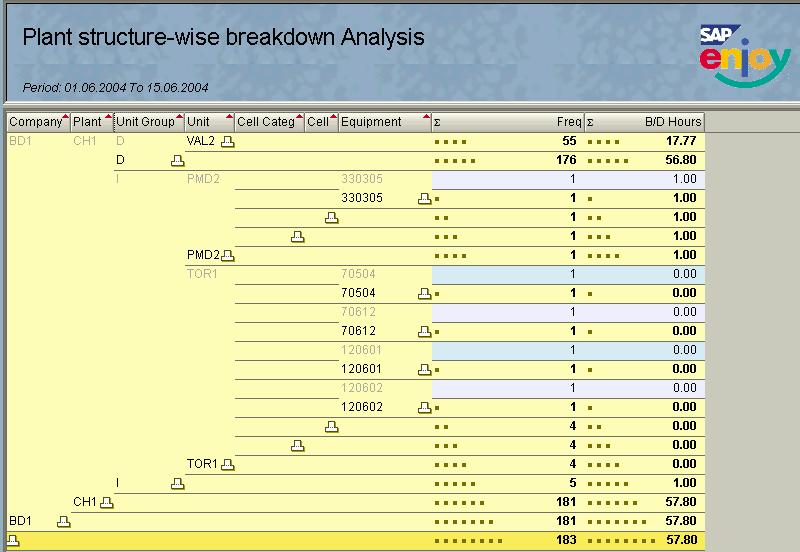
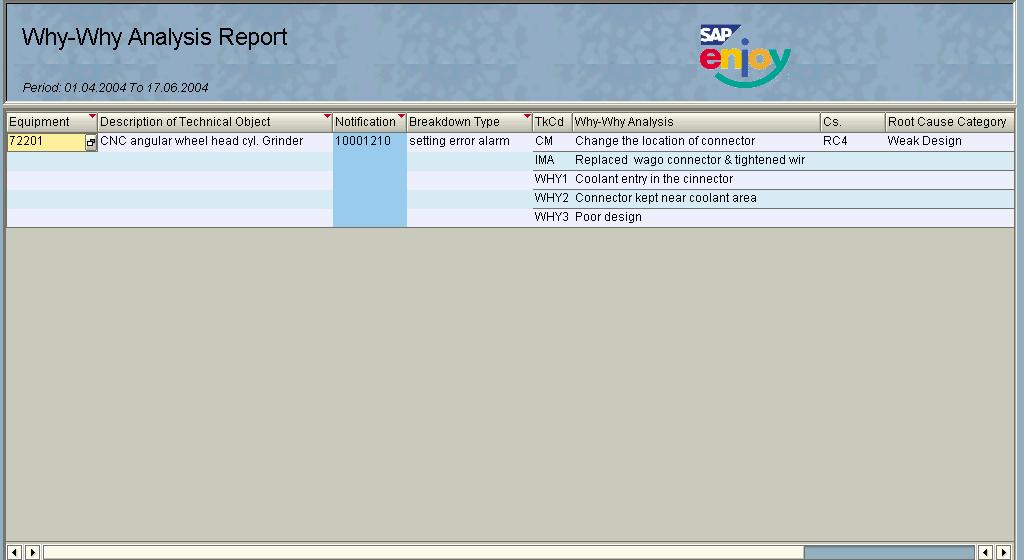
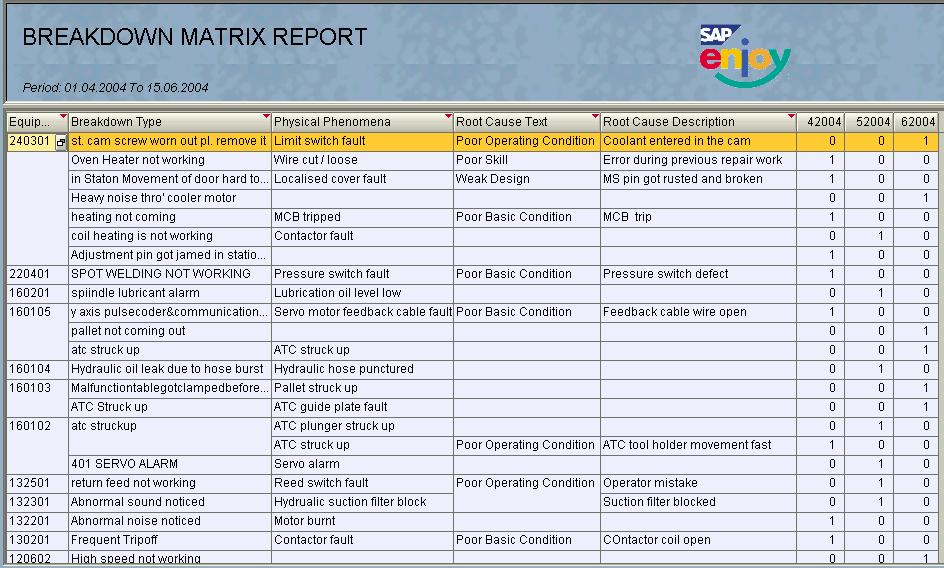
25 Equipment & Functional Location maintenance SMS alerts PM plans & Check list Horizontal deployment Work order management for preventive and breakdown maintenance Breakdown matrix Why-Why analysis Breakdown analysis Notification analysis Plant Maintenance Mean Time Taken to Repair (MTTR) / Mean Time between Failures (MTBF) Linkage to MM and FI for Purchasing and cost centre-wise tracking 25
26 26
27 27
28 28
29 29
30 30


31 Internet SMS alerts on breakdown Online printing SMS message 31
32 Performance measurement Key measurement task Define measurement variables Perform baseline measurement Perform final measurement Analyze results and calculate benefits If you can t measure, you can t manage it Andy 32
33 Lost cost tree in TPM Prepare loss cost tree for plant Link the losses with financial elements Identify & implement projects to reduce the losses Pillar wise Review the project implementation Link the benefits into business results 33

34 Loss due to Equipment effectiveness 34

35 Break up of availability loss 35

36 Break Up of Quality Loss 36

37 Measurements Focused Deployable Simple Visible Stratification manufacturing unit wise 37
38 Stratification warehouse wise 38
39 360 degree view of inventory The more inventory a company has, less likely they are of what they need Taiichi Ohno 39


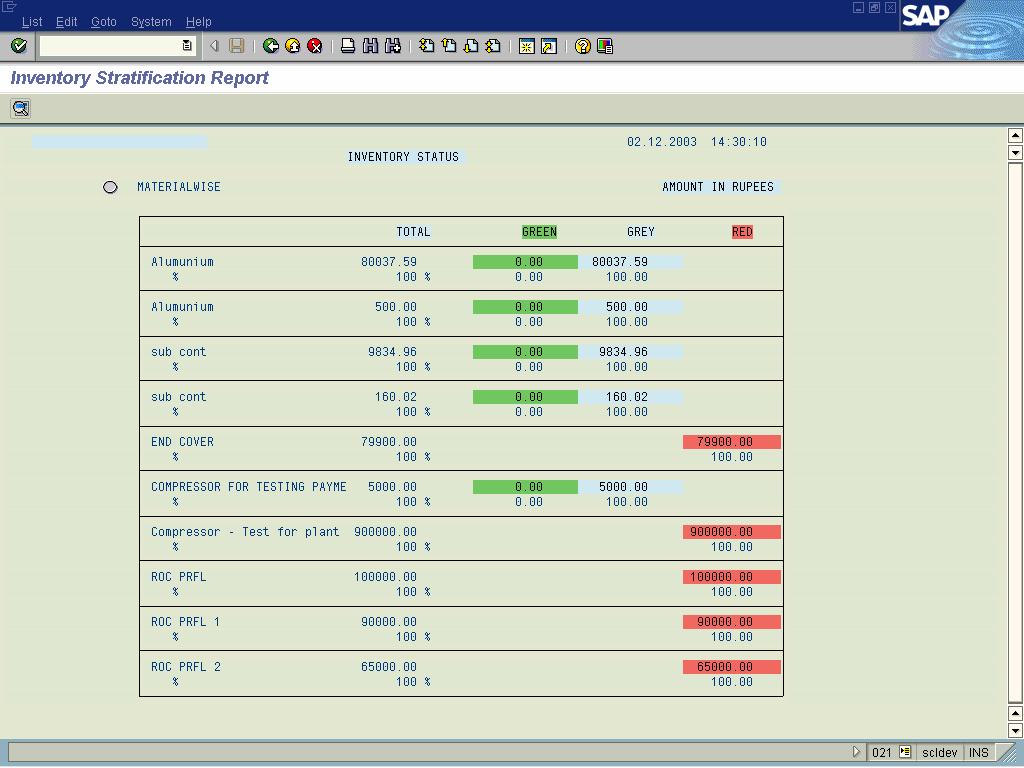
40 Inventory analysis Red, Gray, Green 40
41 Performance measure in indirect areas GRN creation time for local supplies >100 41
42 Better Performance measurement for IT in PPM Reduce Information systems downtime UOM : PPM Downtime 42
43 43
44 44
45 45
46 Over all business results Key performance areas Base level Measure Measure after LEAN Customer complaints per month 7 2 % > 100% Delivery service level 70% 90% 30% Premium dispatches pa % Stock in pipeline 20 cr 10 cr 50% Nonmoving stock in transporters godown for > 60 days Line stopper due to supplier parts - % man hours lost 3.30 crores 0 >100% 3.5% 0.45% 87% Value added per employee % Inventory turn % 46
47 Summing up IT plays a critical role in Lean manufacturing as business driver Gateway to success comes out of: Lean physical processes thro TQM Integrating business processes thro IT solutions ERP Extending IT support to supply partners Instituting performance measures for Continuous improvements Sustained controls on Inventories Productivity measures Assets utilization Wastes and non value adds 47
48 Question and answers 48
49 Thank you 49